Cities with the Highest Percentage of Population with a Degree in Education in New Jersey
RELATED REPORTS & OPTIONS
Education
New Jersey
Compare Cities
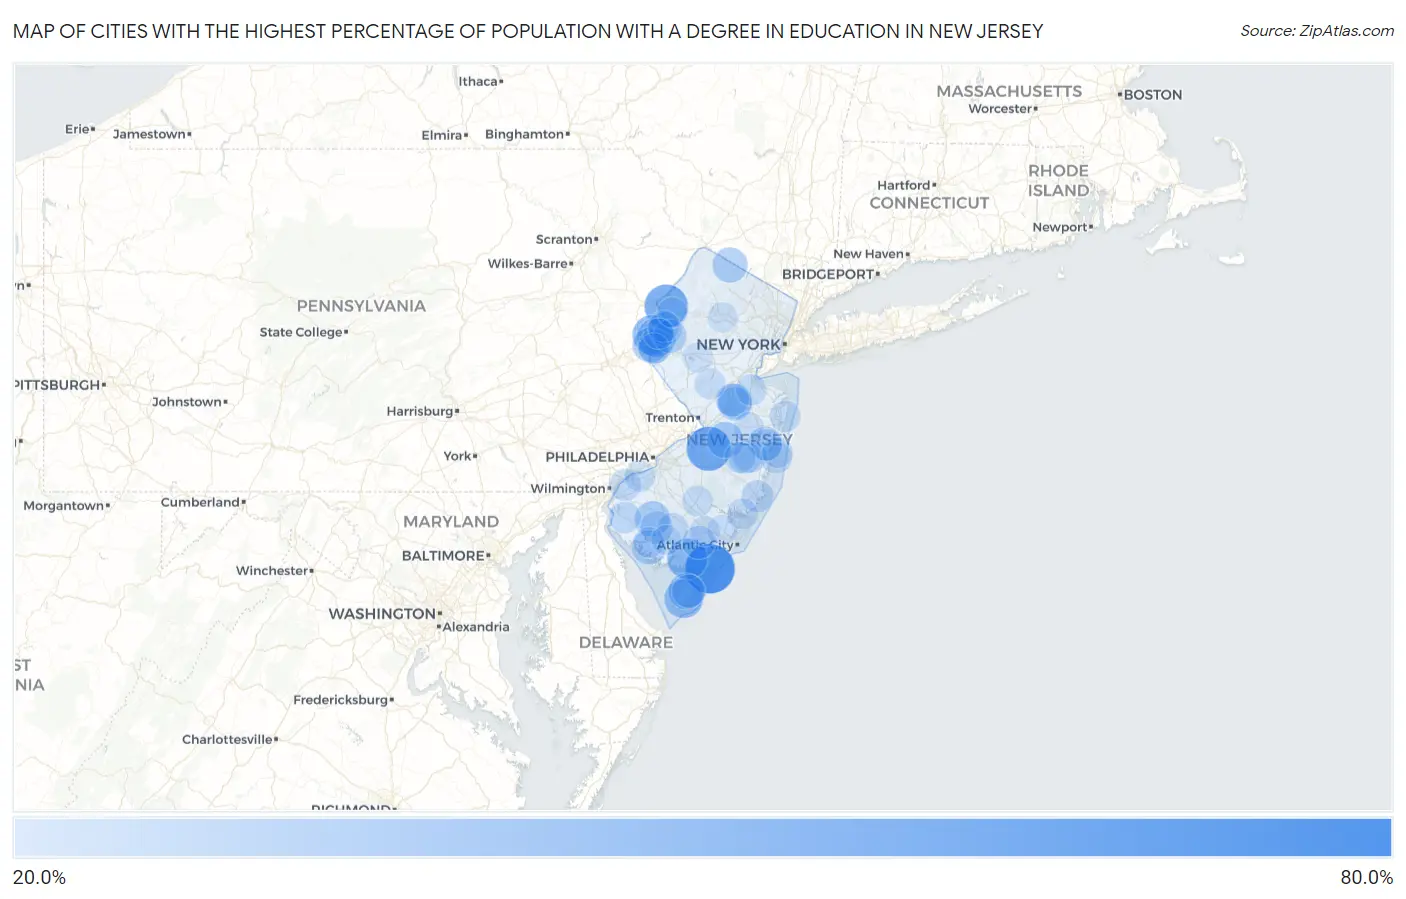
Map of Cities with the Highest Percentage of Population with a Degree in Education in New Jersey
0.0%
80.0%
Cities with the Highest Percentage of Population with a Degree in Education in New Jersey
| City | % Graduates | vs State | vs National | |
| 1. | Strathmere | 77.1% | 10.3%(+66.8)#1 | 11.1%(+66.1)#584 |
| 2. | Deerfield Street | 69.2% | 10.3%(+58.9)#2 | 11.1%(+58.2)#761 |
| 3. | Juliustown | 61.1% | 10.3%(+50.8)#3 | 11.1%(+50.1)#1,023 |
| 4. | Hainesburg | 58.5% | 10.3%(+48.2)#4 | 11.1%(+47.4)#1,161 |
| 5. | Belleplain | 50.0% | 10.3%(+39.7)#5 | 11.1%(+38.9)#1,616 |
| 6. | Brainards | 48.0% | 10.3%(+37.7)#6 | 11.1%(+36.9)#1,909 |
| 7. | Lakeside-Beebe Run | 46.7% | 10.3%(+36.3)#7 | 11.1%(+35.6)#2,021 |
| 8. | Harmony | 44.9% | 10.3%(+34.6)#8 | 11.1%(+33.8)#2,223 |
| 9. | Mauricetown | 44.8% | 10.3%(+34.4)#9 | 11.1%(+33.7)#2,236 |
| 10. | Erma | 44.8% | 10.3%(+34.4)#10 | 11.1%(+33.7)#2,237 |
| 11. | Shiloh Borough | 44.2% | 10.3%(+33.9)#11 | 11.1%(+33.1)#2,317 |
| 12. | Money Island | 42.9% | 10.3%(+32.5)#12 | 11.1%(+31.8)#2,527 |
| 13. | Newfield Borough | 40.9% | 10.3%(+30.5)#13 | 11.1%(+29.8)#2,785 |
| 14. | Silver Lake | 40.5% | 10.3%(+30.1)#14 | 11.1%(+29.4)#2,836 |
| 15. | East Vineland | 37.7% | 10.3%(+27.4)#15 | 11.1%(+26.7)#3,342 |
| 16. | New Egypt | 37.2% | 10.3%(+26.9)#16 | 11.1%(+26.2)#3,460 |
| 17. | Whitesboro | 37.0% | 10.3%(+26.6)#17 | 11.1%(+25.9)#3,504 |
| 18. | Gouldtown | 36.8% | 10.3%(+26.5)#18 | 11.1%(+25.8)#3,526 |
| 19. | Nesco | 36.0% | 10.3%(+25.7)#19 | 11.1%(+24.9)#3,723 |
| 20. | Carlls Corner | 35.5% | 10.3%(+25.2)#20 | 11.1%(+24.4)#3,849 |
| 21. | Olivet | 34.7% | 10.3%(+24.3)#21 | 11.1%(+23.6)#4,048 |
| 22. | Vernon Valley | 34.4% | 10.3%(+24.0)#22 | 11.1%(+23.3)#4,122 |
| 23. | West Park | 33.9% | 10.3%(+23.5)#23 | 11.1%(+22.8)#4,240 |
| 24. | Delaware Park | 33.1% | 10.3%(+22.8)#24 | 11.1%(+22.1)#4,619 |
| 25. | Silver Lake Cdp Warren County | 32.9% | 10.3%(+22.6)#25 | 11.1%(+21.9)#4,648 |
| 26. | Tuckahoe | 32.6% | 10.3%(+22.2)#26 | 11.1%(+21.5)#4,741 |
| 27. | West Wildwood Borough | 32.2% | 10.3%(+21.9)#27 | 11.1%(+21.1)#4,832 |
| 28. | Whittingham | 31.9% | 10.3%(+21.6)#28 | 11.1%(+20.9)#4,910 |
| 29. | Cedarville | 31.7% | 10.3%(+21.4)#29 | 11.1%(+20.6)#4,970 |
| 30. | Goshen | 31.4% | 10.3%(+21.1)#30 | 11.1%(+20.4)#5,071 |
| 31. | Leisure Village | 31.3% | 10.3%(+21.0)#31 | 11.1%(+20.2)#5,115 |
| 32. | Lopatcong Overlook | 31.2% | 10.3%(+20.9)#32 | 11.1%(+20.2)#5,124 |
| 33. | Concordia | 30.4% | 10.3%(+20.1)#33 | 11.1%(+19.3)#5,430 |
| 34. | South Seaville | 30.1% | 10.3%(+19.7)#34 | 11.1%(+19.0)#5,511 |
| 35. | Brookfield | 30.0% | 10.3%(+19.6)#35 | 11.1%(+18.9)#5,578 |
| 36. | Brass Castle | 29.7% | 10.3%(+19.3)#36 | 11.1%(+18.6)#5,673 |
| 37. | Washington Crossing | 28.9% | 10.3%(+18.6)#37 | 11.1%(+17.8)#6,012 |
| 38. | Burleigh | 28.8% | 10.3%(+18.4)#38 | 11.1%(+17.7)#6,055 |
| 39. | Rossmoor | 28.5% | 10.3%(+18.2)#39 | 11.1%(+17.4)#6,191 |
| 40. | Estell Manor | 28.4% | 10.3%(+18.1)#40 | 11.1%(+17.4)#6,219 |
| 41. | Mickleton | 27.9% | 10.3%(+17.6)#41 | 11.1%(+16.9)#6,400 |
| 42. | Pine Ridge At Crestwood | 27.8% | 10.3%(+17.5)#42 | 11.1%(+16.8)#6,433 |
| 43. | Rosenhayn | 27.4% | 10.3%(+17.1)#43 | 11.1%(+16.4)#6,606 |
| 44. | Crestwood Village | 27.3% | 10.3%(+16.9)#44 | 11.1%(+16.2)#6,704 |
| 45. | Totowa Borough | 27.0% | 10.3%(+16.6)#45 | 11.1%(+15.9)#6,825 |
| 46. | Barnegat Light Borough | 26.2% | 10.3%(+15.9)#46 | 11.1%(+15.2)#7,147 |
| 47. | Malaga | 26.1% | 10.3%(+15.8)#47 | 11.1%(+15.1)#7,178 |
| 48. | Manahawkin | 25.8% | 10.3%(+15.5)#48 | 11.1%(+14.7)#7,329 |
| 49. | Surf City Borough | 25.8% | 10.3%(+15.4)#49 | 11.1%(+14.7)#7,331 |
| 50. | Renaissance At Monroe | 25.7% | 10.3%(+15.4)#50 | 11.1%(+14.7)#7,352 |
| 51. | Port Morris | 25.3% | 10.3%(+15.0)#51 | 11.1%(+14.3)#7,522 |
| 52. | Dover Beaches South | 25.1% | 10.3%(+14.8)#52 | 11.1%(+14.0)#7,619 |
| 53. | Pedricktown | 25.0% | 10.3%(+14.7)#53 | 11.1%(+13.9)#7,735 |
| 54. | Vineland | 24.9% | 10.3%(+14.6)#54 | 11.1%(+13.9)#7,897 |
| 55. | Quinton | 24.6% | 10.3%(+14.3)#55 | 11.1%(+13.5)#7,998 |
| 56. | Cologne | 24.6% | 10.3%(+14.3)#56 | 11.1%(+13.5)#7,999 |
| 57. | Othello | 24.3% | 10.3%(+14.0)#57 | 11.1%(+13.3)#8,120 |
| 58. | Ship Bottom Borough | 24.1% | 10.3%(+13.8)#58 | 11.1%(+13.1)#8,204 |
| 59. | Leisure Village East | 23.7% | 10.3%(+13.4)#59 | 11.1%(+12.6)#8,436 |
| 60. | Dutch Neck | 23.7% | 10.3%(+13.4)#60 | 11.1%(+12.6)#8,455 |
| 61. | Belvidere | 23.6% | 10.3%(+13.2)#61 | 11.1%(+12.5)#8,515 |
| 62. | Gibbstown | 23.2% | 10.3%(+12.9)#62 | 11.1%(+12.2)#8,705 |
| 63. | Cedar Glen Lakes | 23.2% | 10.3%(+12.8)#63 | 11.1%(+12.1)#8,740 |
| 64. | Brownville | 23.0% | 10.3%(+12.7)#64 | 11.1%(+12.0)#8,841 |
| 65. | Rockleigh Borough | 23.0% | 10.3%(+12.7)#65 | 11.1%(+11.9)#8,858 |
| 66. | South Dennis | 22.9% | 10.3%(+12.6)#66 | 11.1%(+11.8)#8,911 |
| 67. | Loch Arbour | 22.9% | 10.3%(+12.5)#67 | 11.1%(+11.8)#8,919 |
| 68. | Regency At Monroe | 22.9% | 10.3%(+12.5)#68 | 11.1%(+11.8)#8,924 |
| 69. | Sweetwater | 22.7% | 10.3%(+12.4)#69 | 11.1%(+11.6)#9,029 |
| 70. | Mystic Island | 22.6% | 10.3%(+12.2)#70 | 11.1%(+11.5)#9,111 |
| 71. | Harlingen | 22.5% | 10.3%(+12.1)#71 | 11.1%(+11.4)#9,156 |
| 72. | Alpha Borough | 22.4% | 10.3%(+12.0)#72 | 11.1%(+11.3)#9,211 |
| 73. | Teterboro Borough | 22.2% | 10.3%(+11.9)#73 | 11.1%(+11.2)#9,352 |
| 74. | Dover Beaches North | 22.2% | 10.3%(+11.9)#74 | 11.1%(+11.1)#9,361 |
| 75. | Hammonton | 22.2% | 10.3%(+11.9)#75 | 11.1%(+11.1)#9,369 |
| 76. | Elmer Borough | 22.1% | 10.3%(+11.8)#76 | 11.1%(+11.1)#9,390 |
| 77. | Upper Pohatcong | 22.1% | 10.3%(+11.8)#77 | 11.1%(+11.1)#9,401 |
| 78. | Fairton | 22.0% | 10.3%(+11.7)#78 | 11.1%(+10.9)#9,456 |
| 79. | Cape May Point Borough | 22.0% | 10.3%(+11.6)#79 | 11.1%(+10.9)#9,494 |
| 80. | The Ponds | 21.7% | 10.3%(+11.4)#80 | 11.1%(+10.6)#9,644 |
| 81. | Brooklawn Borough | 21.6% | 10.3%(+11.3)#81 | 11.1%(+10.5)#9,708 |
| 82. | West Cape May Borough | 21.5% | 10.3%(+11.2)#82 | 11.1%(+10.5)#9,730 |
| 83. | Dividing Creek | 21.4% | 10.3%(+11.1)#83 | 11.1%(+10.4)#9,800 |
| 84. | Allenhurst Borough | 21.4% | 10.3%(+11.1)#84 | 11.1%(+10.4)#9,807 |
| 85. | Seaside Park Borough | 21.3% | 10.3%(+11.0)#85 | 11.1%(+10.3)#9,865 |
| 86. | Thorofare | 21.2% | 10.3%(+10.8)#86 | 11.1%(+10.1)#9,962 |
| 87. | Pomona | 21.1% | 10.3%(+10.8)#87 | 11.1%(+10.0)#10,006 |
| 88. | Hutchinson | 21.1% | 10.3%(+10.7)#88 | 11.1%(+9.99)#10,058 |
| 89. | Mount Hope | 20.9% | 10.3%(+10.5)#89 | 11.1%(+9.80)#10,172 |
| 90. | Mays Landing | 20.8% | 10.3%(+10.5)#90 | 11.1%(+9.79)#10,179 |
| 91. | Bargaintown | 20.8% | 10.3%(+10.4)#91 | 11.1%(+9.70)#10,232 |
| 92. | Franklinville | 20.7% | 10.3%(+10.3)#92 | 11.1%(+9.60)#10,296 |
| 93. | Point Pleasant Beach Borough | 20.6% | 10.3%(+10.3)#93 | 11.1%(+9.57)#10,318 |
| 94. | Mount Hermon | 20.5% | 10.3%(+10.2)#94 | 11.1%(+9.49)#10,375 |
| 95. | Vista Center | 20.5% | 10.3%(+10.2)#95 | 11.1%(+9.45)#10,398 |
| 96. | Dover | 20.3% | 10.3%(+10.0)#96 | 11.1%(+9.29)#10,462 |
| 97. | Pitman Borough | 20.3% | 10.3%(+10.0)#97 | 11.1%(+9.29)#10,465 |
| 98. | Brielle Borough | 20.3% | 10.3%(+9.95)#98 | 11.1%(+9.23)#10,502 |
| 99. | Millville | 20.3% | 10.3%(+9.92)#99 | 11.1%(+9.20)#10,515 |
| 100. | White House Station | 20.3% | 10.3%(+9.92)#100 | 11.1%(+9.20)#10,516 |
Common Questions
What are the Top 10 Cities with the Highest Percentage of Population with a Degree in Education in New Jersey?
Top 10 Cities with the Highest Percentage of Population with a Degree in Education in New Jersey are:
#1
77.1%
#2
61.1%
#3
58.5%
#4
50.0%
#5
48.0%
#6
44.9%
#7
44.8%
#8
37.2%
#9
37.0%
#10
34.7%
What city has the Highest Percentage of Population with a Degree in Education in New Jersey?
Strathmere has the Highest Percentage of Population with a Degree in Education in New Jersey with 77.1%.
What is the Percentage of Population with a Degree in Education in the State of New Jersey?
Percentage of Population with a Degree in Education in New Jersey is 10.3%.
What is the Percentage of Population with a Degree in Education in the United States?
Percentage of Population with a Degree in Education in the United States is 11.1%.