Cities with the Most Immigrants from Korea in New Jersey
RELATED REPORTS & OPTIONS
Korea
New Jersey
Compare Cities
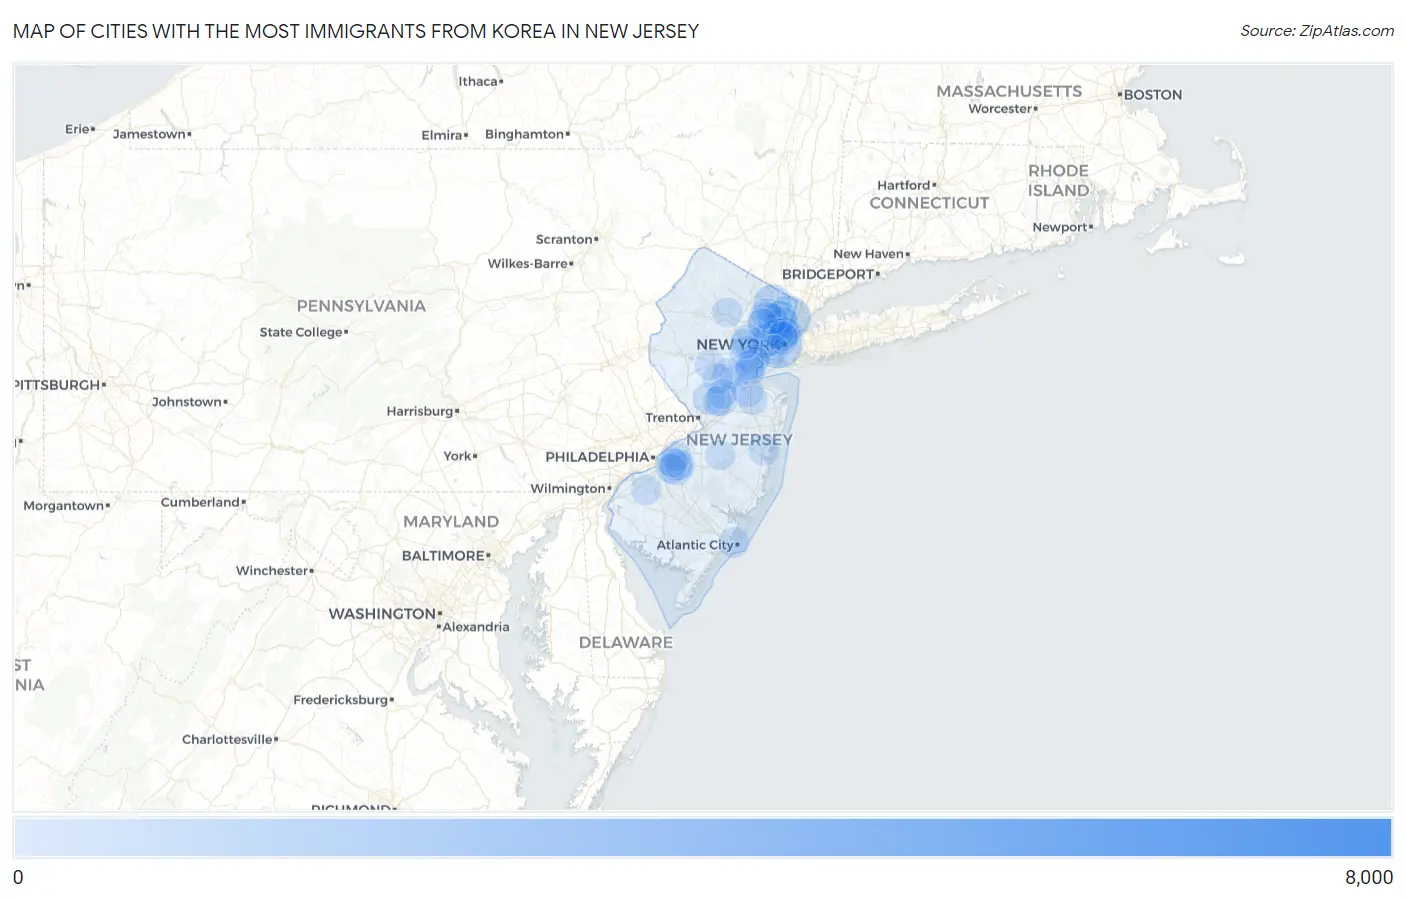
Map of Cities with the Most Immigrants from Korea in New Jersey
0
8,000
Cities with the Most Immigrants from Korea in New Jersey
| City | Korea | vs State | vs National | |
| 1. | Palisades Park Borough | 7,969 | 70,512(11.30%)#1 | 1,034,299(0.77%)#9 |
| 2. | Fort Lee Borough | 6,565 | 70,512(9.31%)#2 | 1,034,299(0.63%)#14 |
| 3. | Ridgefield Borough | 2,201 | 70,512(3.12%)#3 | 1,034,299(0.21%)#50 |
| 4. | Edgewater Borough | 2,014 | 70,512(2.86%)#4 | 1,034,299(0.19%)#57 |
| 5. | Jersey City | 1,968 | 70,512(2.79%)#5 | 1,034,299(0.19%)#59 |
| 6. | Tenafly Borough | 1,907 | 70,512(2.70%)#6 | 1,034,299(0.18%)#63 |
| 7. | Leonia Borough | 1,717 | 70,512(2.44%)#7 | 1,034,299(0.17%)#70 |
| 8. | Cresskill Borough | 1,430 | 70,512(2.03%)#8 | 1,034,299(0.14%)#95 |
| 9. | Englewood | 1,422 | 70,512(2.02%)#9 | 1,034,299(0.14%)#96 |
| 10. | Closter Borough | 1,186 | 70,512(1.68%)#10 | 1,034,299(0.11%)#119 |
| 11. | Norwood Borough | 1,163 | 70,512(1.65%)#11 | 1,034,299(0.11%)#121 |
| 12. | Old Tappan Borough | 1,112 | 70,512(1.58%)#12 | 1,034,299(0.11%)#126 |
| 13. | Paramus Borough | 1,076 | 70,512(1.53%)#13 | 1,034,299(0.10%)#134 |
| 14. | Cliffside Park Borough | 880 | 70,512(1.25%)#14 | 1,034,299(0.09%)#171 |
| 15. | Ridgewood | 877 | 70,512(1.24%)#15 | 1,034,299(0.08%)#173 |
| 16. | River Edge Borough | 828 | 70,512(1.17%)#16 | 1,034,299(0.08%)#181 |
| 17. | Clifton | 820 | 70,512(1.16%)#17 | 1,034,299(0.08%)#185 |
| 18. | Northvale Borough | 796 | 70,512(1.13%)#18 | 1,034,299(0.08%)#193 |
| 19. | Little Ferry Borough | 746 | 70,512(1.06%)#19 | 1,034,299(0.07%)#212 |
| 20. | Englewood Cliffs Borough | 696 | 70,512(0.99%)#20 | 1,034,299(0.07%)#229 |
| 21. | Wood Ridge Borough | 575 | 70,512(0.82%)#21 | 1,034,299(0.06%)#275 |
| 22. | West New York | 520 | 70,512(0.74%)#22 | 1,034,299(0.05%)#313 |
| 23. | Newark | 494 | 70,512(0.70%)#23 | 1,034,299(0.05%)#324 |
| 24. | Hackensack | 463 | 70,512(0.66%)#24 | 1,034,299(0.04%)#348 |
| 25. | Demarest Borough | 433 | 70,512(0.61%)#25 | 1,034,299(0.04%)#370 |
| 26. | Springdale | 390 | 70,512(0.55%)#26 | 1,034,299(0.04%)#399 |
| 27. | Harrington Park Borough | 378 | 70,512(0.54%)#27 | 1,034,299(0.04%)#410 |
| 28. | Glen Rock Borough | 372 | 70,512(0.53%)#28 | 1,034,299(0.04%)#414 |
| 29. | Dumont Borough | 370 | 70,512(0.52%)#29 | 1,034,299(0.04%)#416 |
| 30. | Allendale Borough | 368 | 70,512(0.52%)#30 | 1,034,299(0.04%)#419 |
| 31. | Bergenfield Borough | 353 | 70,512(0.50%)#31 | 1,034,299(0.03%)#429 |
| 32. | Westfield | 343 | 70,512(0.49%)#32 | 1,034,299(0.03%)#446 |
| 33. | East Rutherford Borough | 311 | 70,512(0.44%)#33 | 1,034,299(0.03%)#487 |
| 34. | Upper Saddle River Borough | 309 | 70,512(0.44%)#34 | 1,034,299(0.03%)#491 |
| 35. | Princeton | 293 | 70,512(0.42%)#35 | 1,034,299(0.03%)#521 |
| 36. | Greentree | 290 | 70,512(0.41%)#36 | 1,034,299(0.03%)#527 |
| 37. | Maywood Borough | 283 | 70,512(0.40%)#37 | 1,034,299(0.03%)#538 |
| 38. | Ridgefield Park | 274 | 70,512(0.39%)#38 | 1,034,299(0.03%)#552 |
| 39. | Princeton Meadows | 260 | 70,512(0.37%)#39 | 1,034,299(0.03%)#574 |
| 40. | Rutherford Borough | 258 | 70,512(0.37%)#40 | 1,034,299(0.02%)#579 |
| 41. | Hoboken | 256 | 70,512(0.36%)#41 | 1,034,299(0.02%)#589 |
| 42. | Sicklerville | 249 | 70,512(0.35%)#42 | 1,034,299(0.02%)#602 |
| 43. | Franklin Lakes Borough | 239 | 70,512(0.34%)#43 | 1,034,299(0.02%)#627 |
| 44. | Old Bridge | 235 | 70,512(0.33%)#44 | 1,034,299(0.02%)#642 |
| 45. | Fair Lawn Borough | 226 | 70,512(0.32%)#45 | 1,034,299(0.02%)#667 |
| 46. | Montvale Borough | 219 | 70,512(0.31%)#46 | 1,034,299(0.02%)#684 |
| 47. | Haworth Borough | 217 | 70,512(0.31%)#47 | 1,034,299(0.02%)#697 |
| 48. | Preakness | 212 | 70,512(0.30%)#48 | 1,034,299(0.02%)#711 |
| 49. | Short Hills | 210 | 70,512(0.30%)#49 | 1,034,299(0.02%)#715 |
| 50. | Highland Park Borough | 203 | 70,512(0.29%)#50 | 1,034,299(0.02%)#734 |
| 51. | Fairview Borough | 202 | 70,512(0.29%)#51 | 1,034,299(0.02%)#741 |
| 52. | Alpine Borough | 201 | 70,512(0.29%)#52 | 1,034,299(0.02%)#747 |
| 53. | Toms River | 188 | 70,512(0.27%)#53 | 1,034,299(0.02%)#787 |
| 54. | Somerset | 182 | 70,512(0.26%)#54 | 1,034,299(0.02%)#808 |
| 55. | Ramsey Borough | 182 | 70,512(0.26%)#55 | 1,034,299(0.02%)#809 |
| 56. | Elmwood Park Borough | 180 | 70,512(0.26%)#56 | 1,034,299(0.02%)#813 |
| 57. | Secaucus | 179 | 70,512(0.25%)#57 | 1,034,299(0.02%)#815 |
| 58. | Westwood Borough | 178 | 70,512(0.25%)#58 | 1,034,299(0.02%)#818 |
| 59. | Dunellen Borough | 173 | 70,512(0.25%)#59 | 1,034,299(0.02%)#837 |
| 60. | Tinton Falls Borough | 160 | 70,512(0.23%)#60 | 1,034,299(0.02%)#888 |
| 61. | Whippany | 159 | 70,512(0.23%)#61 | 1,034,299(0.02%)#891 |
| 62. | Sayreville Borough | 156 | 70,512(0.22%)#62 | 1,034,299(0.02%)#901 |
| 63. | Garfield | 154 | 70,512(0.22%)#63 | 1,034,299(0.01%)#912 |
| 64. | Avenel | 154 | 70,512(0.22%)#64 | 1,034,299(0.01%)#915 |
| 65. | Rutgers University-Busch Campus | 154 | 70,512(0.22%)#65 | 1,034,299(0.01%)#919 |
| 66. | Rahway | 150 | 70,512(0.21%)#66 | 1,034,299(0.01%)#941 |
| 67. | Paterson | 143 | 70,512(0.20%)#67 | 1,034,299(0.01%)#970 |
| 68. | New Brunswick | 139 | 70,512(0.20%)#68 | 1,034,299(0.01%)#995 |
| 69. | Atlantic City | 139 | 70,512(0.20%)#69 | 1,034,299(0.01%)#996 |
| 70. | Watchung Borough | 133 | 70,512(0.19%)#70 | 1,034,299(0.01%)#1,027 |
| 71. | Upper Montclair | 130 | 70,512(0.18%)#71 | 1,034,299(0.01%)#1,041 |
| 72. | Emerson Borough | 129 | 70,512(0.18%)#72 | 1,034,299(0.01%)#1,045 |
| 73. | Mullica Hill | 126 | 70,512(0.18%)#73 | 1,034,299(0.01%)#1,063 |
| 74. | Iselin | 121 | 70,512(0.17%)#74 | 1,034,299(0.01%)#1,104 |
| 75. | The Hills | 120 | 70,512(0.17%)#75 | 1,034,299(0.01%)#1,110 |
| 76. | Oradell Borough | 120 | 70,512(0.17%)#76 | 1,034,299(0.01%)#1,111 |
| 77. | Robbinsville Center | 118 | 70,512(0.17%)#77 | 1,034,299(0.01%)#1,128 |
| 78. | Metuchen Borough | 115 | 70,512(0.16%)#78 | 1,034,299(0.01%)#1,148 |
| 79. | New Milford Borough | 114 | 70,512(0.16%)#79 | 1,034,299(0.01%)#1,153 |
| 80. | Fords | 112 | 70,512(0.16%)#80 | 1,034,299(0.01%)#1,171 |
| 81. | Bradley Gardens | 111 | 70,512(0.16%)#81 | 1,034,299(0.01%)#1,178 |
| 82. | Guttenberg | 108 | 70,512(0.15%)#82 | 1,034,299(0.01%)#1,203 |
| 83. | Robertsville | 106 | 70,512(0.15%)#83 | 1,034,299(0.01%)#1,224 |
| 84. | Union City | 103 | 70,512(0.15%)#84 | 1,034,299(0.01%)#1,238 |
| 85. | Summit | 102 | 70,512(0.14%)#85 | 1,034,299(0.01%)#1,244 |
| 86. | Parsippany | 97 | 70,512(0.14%)#86 | 1,034,299(0.01%)#1,284 |
| 87. | Blackwells Mills | 95 | 70,512(0.13%)#87 | 1,034,299(0.01%)#1,306 |
| 88. | Bernardsville Borough | 94 | 70,512(0.13%)#88 | 1,034,299(0.01%)#1,312 |
| 89. | Eatontown Borough | 88 | 70,512(0.12%)#89 | 1,034,299(0.01%)#1,365 |
| 90. | Marlton | 84 | 70,512(0.12%)#90 | 1,034,299(0.01%)#1,408 |
| 91. | Madison Borough | 83 | 70,512(0.12%)#91 | 1,034,299(0.01%)#1,419 |
| 92. | Browns Mills | 83 | 70,512(0.12%)#92 | 1,034,299(0.01%)#1,421 |
| 93. | Monmouth Junction | 82 | 70,512(0.12%)#93 | 1,034,299(0.01%)#1,436 |
| 94. | White Meadow Lake | 82 | 70,512(0.12%)#94 | 1,034,299(0.01%)#1,437 |
| 95. | Moorestown Lenola | 81 | 70,512(0.11%)#95 | 1,034,299(0.01%)#1,443 |
| 96. | Ashland | 81 | 70,512(0.11%)#96 | 1,034,299(0.01%)#1,446 |
| 97. | Kingston Estates | 81 | 70,512(0.11%)#97 | 1,034,299(0.01%)#1,447 |
| 98. | Bayonne | 79 | 70,512(0.11%)#98 | 1,034,299(0.01%)#1,460 |
| 99. | Oceanport Borough | 78 | 70,512(0.11%)#99 | 1,034,299(0.01%)#1,484 |
| 100. | Plainsboro Center | 75 | 70,512(0.11%)#100 | 1,034,299(0.01%)#1,527 |
Common Questions
What are the Top 10 Cities with the Most Immigrants from Korea in New Jersey?
Top 10 Cities with the Most Immigrants from Korea in New Jersey are:
#1
1,968
#2
1,422
#3
877
#4
820
#5
520
#6
494
#7
463
#8
390
#9
343
#10
293
What city has the Most Immigrants from Korea in New Jersey?
Jersey City has the Most Immigrants from Korea in New Jersey with 1,968.
What is the Total Immigrants from Korea in the State of New Jersey?
Total Immigrants from Korea in New Jersey is 70,512.
What is the Total Immigrants from Korea in the United States?
Total Immigrants from Korea in the United States is 1,034,299.