Cities with the Highest Percentage of Immigrants from Western Africa in New Jersey
RELATED REPORTS & OPTIONS
Western Africa
New Jersey
Compare Cities
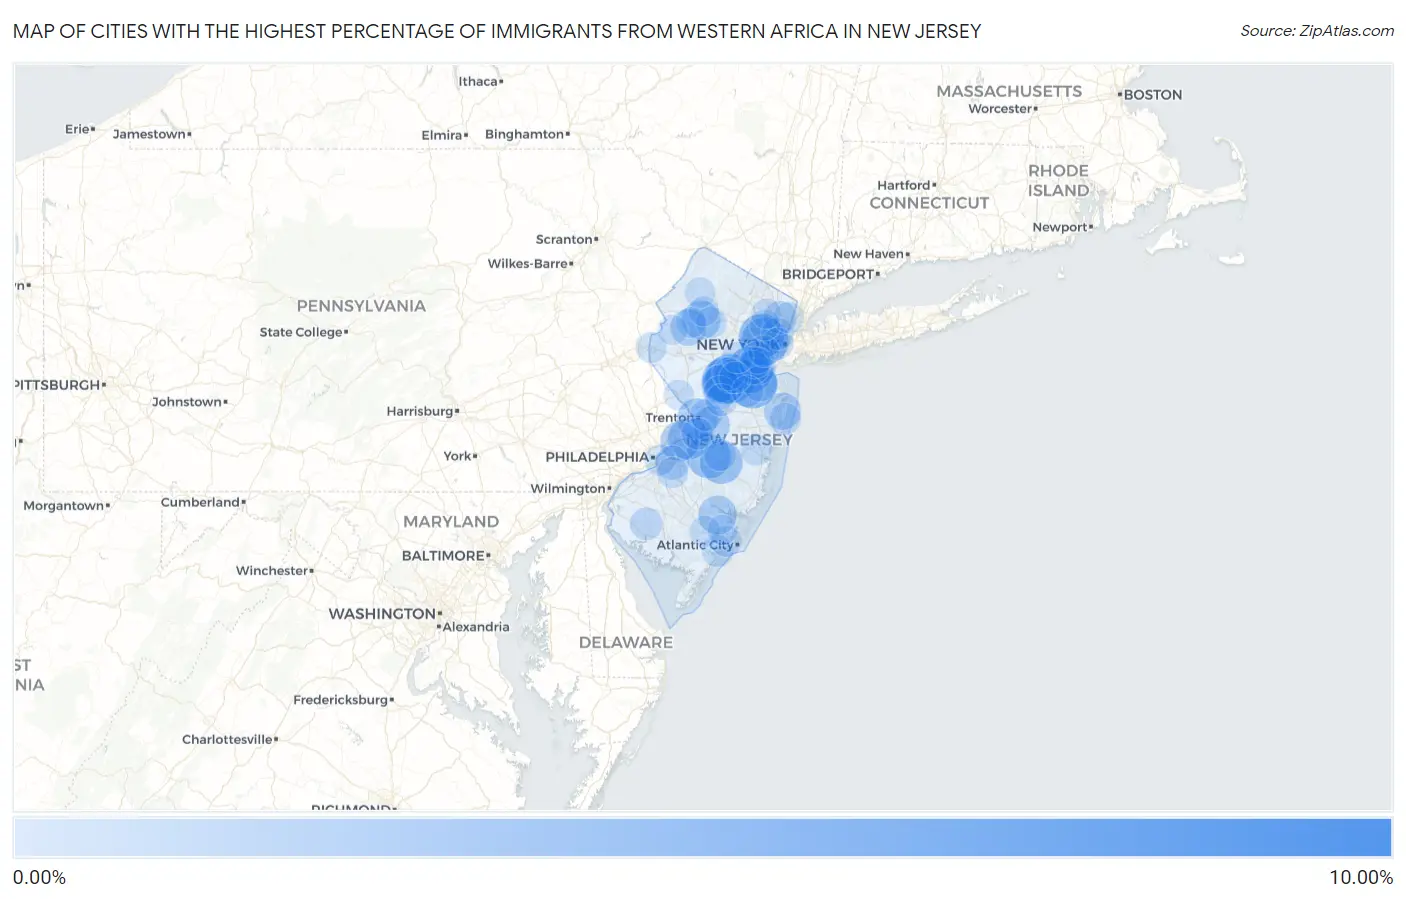
Map of Cities with the Highest Percentage of Immigrants from Western Africa in New Jersey
0.00%
10.00%
Cities with the Highest Percentage of Immigrants from Western Africa in New Jersey
| City | Western Africa | vs State | vs National | |
| 1. | Vauxhall | 9.90% | 0.66%(+9.24)#-1 | 0.30%(+9.61)#0 |
| 2. | Voorhees | 4.95% | 0.66%(+4.29)#0 | 0.30%(+4.65)#1 |
| 3. | Madison Park | 4.95% | 0.66%(+4.28)#1 | 0.30%(+4.65)#2 |
| 4. | Newark | 4.49% | 0.66%(+3.83)#58 | 0.30%(+4.19)#998 |
| 5. | Forsgate | 4.22% | 0.66%(+3.55)#59 | 0.30%(+3.92)#999 |
| 6. | Fords | 4.21% | 0.66%(+3.54)#60 | 0.30%(+3.91)#1,000 |
| 7. | Six Mile Run | 4.05% | 0.66%(+3.38)#61 | 0.30%(+3.75)#1,001 |
| 8. | East Orange | 3.81% | 0.66%(+3.14)#62 | 0.30%(+3.51)#1,002 |
| 9. | Pemberton Heights | 3.67% | 0.66%(+3.01)#63 | 0.30%(+3.38)#1,003 |
| 10. | Wrightstown Borough | 3.43% | 0.66%(+2.76)#64 | 0.30%(+3.13)#1,004 |
| 11. | Presidential Lakes Estates | 3.37% | 0.66%(+2.71)#65 | 0.30%(+3.08)#1,005 |
| 12. | Ampere North | 3.20% | 0.66%(+2.53)#66 | 0.30%(+2.90)#1,006 |
| 13. | Peapack And Gladstone Borough | 3.12% | 0.66%(+2.46)#67 | 0.30%(+2.83)#1,007 |
| 14. | Burlington | 3.06% | 0.66%(+2.40)#68 | 0.30%(+2.76)#1,008 |
| 15. | Franklin Park | 2.91% | 0.66%(+2.24)#69 | 0.30%(+2.61)#1,009 |
| 16. | Trenton | 2.87% | 0.66%(+2.21)#70 | 0.30%(+2.58)#1,010 |
| 17. | Bargaintown | 2.83% | 0.66%(+2.16)#71 | 0.30%(+2.53)#1,011 |
| 18. | Beverly | 2.60% | 0.66%(+1.93)#72 | 0.30%(+2.30)#1,012 |
| 19. | Budd Lake | 2.44% | 0.66%(+1.78)#73 | 0.30%(+2.15)#1,013 |
| 20. | Hightstown Borough | 2.39% | 0.66%(+1.72)#74 | 0.30%(+2.09)#1,014 |
| 21. | Egg Harbor City | 2.35% | 0.66%(+1.69)#75 | 0.30%(+2.06)#1,015 |
| 22. | Groveville | 2.13% | 0.66%(+1.46)#76 | 0.30%(+1.83)#1,016 |
| 23. | Pleasant Plains | 2.10% | 0.66%(+1.43)#77 | 0.30%(+1.80)#1,017 |
| 24. | Sayreville Borough | 2.02% | 0.66%(+1.36)#78 | 0.30%(+1.73)#1,018 |
| 25. | Oakhurst | 2.02% | 0.66%(+1.35)#79 | 0.30%(+1.72)#1,019 |
| 26. | Port Reading | 1.98% | 0.66%(+1.32)#80 | 0.30%(+1.68)#1,020 |
| 27. | Beattystown | 1.90% | 0.66%(+1.24)#81 | 0.30%(+1.61)#1,021 |
| 28. | Pottersville | 1.80% | 0.66%(+1.14)#82 | 0.30%(+1.51)#1,022 |
| 29. | Roselle Borough | 1.66% | 0.66%(+0.998)#83 | 0.30%(+1.36)#1,023 |
| 30. | Cliffwood Beach | 1.60% | 0.66%(+0.931)#84 | 0.30%(+1.30)#1,024 |
| 31. | Parsippany | 1.54% | 0.66%(+0.872)#85 | 0.30%(+1.24)#1,025 |
| 32. | Sicklerville | 1.53% | 0.66%(+0.869)#86 | 0.30%(+1.24)#1,026 |
| 33. | Carteret Borough | 1.40% | 0.66%(+0.731)#87 | 0.30%(+1.10)#1,027 |
| 34. | Pompton Plains | 1.36% | 0.66%(+0.697)#88 | 0.30%(+1.06)#1,028 |
| 35. | Port Morris | 1.36% | 0.66%(+0.694)#89 | 0.30%(+1.06)#1,029 |
| 36. | Lindenwold Borough | 1.33% | 0.66%(+0.667)#90 | 0.30%(+1.03)#1,030 |
| 37. | Kingston Estates | 1.31% | 0.66%(+0.650)#91 | 0.30%(+1.02)#1,031 |
| 38. | Woodbridge | 1.27% | 0.66%(+0.602)#92 | 0.30%(+0.969)#1,032 |
| 39. | East Franklin | 1.24% | 0.66%(+0.571)#93 | 0.30%(+0.938)#1,033 |
| 40. | William Paterson University Of New Jersey | 1.20% | 0.66%(+0.532)#94 | 0.30%(+0.899)#1,034 |
| 41. | Hi Nella Borough | 1.13% | 0.66%(+0.468)#95 | 0.30%(+0.835)#1,035 |
| 42. | Heathcote | 1.11% | 0.66%(+0.443)#96 | 0.30%(+0.810)#1,036 |
| 43. | Hackensack | 1.10% | 0.66%(+0.435)#97 | 0.30%(+0.802)#1,037 |
| 44. | Somerset | 1.03% | 0.66%(+0.367)#98 | 0.30%(+0.733)#1,038 |
| 45. | Pine Beach Borough | 1.00% | 0.66%(+0.335)#99 | 0.30%(+0.702)#1,039 |
| 46. | Great Notch | 1.00% | 0.66%(+0.331)#100 | 0.30%(+0.698)#1,040 |
| 47. | Stockton University | 0.99% | 0.66%(+0.324)#101 | 0.30%(+0.690)#1,041 |
| 48. | Westville Borough | 0.98% | 0.66%(+0.318)#102 | 0.30%(+0.685)#1,042 |
| 49. | Seabrook Farms | 0.97% | 0.66%(+0.303)#103 | 0.30%(+0.670)#1,043 |
| 50. | Lodi Borough | 0.97% | 0.66%(+0.302)#104 | 0.30%(+0.669)#1,044 |
| 51. | Keasbey | 0.91% | 0.66%(+0.246)#105 | 0.30%(+0.613)#1,045 |
| 52. | Secaucus | 0.90% | 0.66%(+0.239)#106 | 0.30%(+0.606)#1,046 |
| 53. | Mercerville | 0.90% | 0.66%(+0.234)#107 | 0.30%(+0.600)#1,047 |
| 54. | Linden | 0.89% | 0.66%(+0.230)#108 | 0.30%(+0.597)#1,048 |
| 55. | Bergenfield Borough | 0.88% | 0.66%(+0.218)#109 | 0.30%(+0.585)#1,049 |
| 56. | Princeton Meadows | 0.85% | 0.66%(+0.189)#110 | 0.30%(+0.556)#1,050 |
| 57. | Woodlynne Borough | 0.83% | 0.66%(+0.162)#111 | 0.30%(+0.529)#1,051 |
| 58. | Browns Mills | 0.83% | 0.66%(+0.161)#112 | 0.30%(+0.527)#1,052 |
| 59. | Jersey City | 0.82% | 0.66%(+0.158)#113 | 0.30%(+0.525)#1,053 |
| 60. | Lawnside Borough | 0.82% | 0.66%(+0.153)#114 | 0.30%(+0.520)#1,054 |
| 61. | Bloomsbury Borough | 0.81% | 0.66%(+0.149)#115 | 0.30%(+0.516)#1,055 |
| 62. | Ocean Grove | 0.80% | 0.66%(+0.134)#116 | 0.30%(+0.501)#1,056 |
| 63. | Roebling | 0.80% | 0.66%(+0.131)#117 | 0.30%(+0.498)#1,057 |
| 64. | Avenel | 0.77% | 0.66%(+0.108)#118 | 0.30%(+0.475)#1,058 |
| 65. | Montclair State University | 0.76% | 0.66%(+0.094)#119 | 0.30%(+0.461)#1,059 |
| 66. | Old Bridge | 0.74% | 0.66%(+0.079)#120 | 0.30%(+0.446)#1,060 |
| 67. | Somers Point | 0.73% | 0.66%(+0.061)#121 | 0.30%(+0.427)#1,061 |
| 68. | Elizabeth | 0.70% | 0.66%(+0.038)#122 | 0.30%(+0.405)#1,062 |
| 69. | New Brunswick | 0.70% | 0.66%(+0.035)#123 | 0.30%(+0.402)#1,063 |
| 70. | Plainfield | 0.70% | 0.66%(+0.035)#124 | 0.30%(+0.401)#1,064 |
| 71. | Raritan Borough | 0.69% | 0.66%(+0.022)#125 | 0.30%(+0.389)#1,065 |
| 72. | Pine Lake Park | 0.68% | 0.66%(+0.015)#126 | 0.30%(+0.382)#1,066 |
| 73. | Tenafly Borough | 0.67% | 0.66%(+0.002)#127 | 0.30%(+0.369)#1,067 |
| 74. | Pleasantville | 0.66% | 0.66%(-0.008)#128 | 0.30%(+0.359)#1,068 |
| 75. | Highland Park Borough | 0.65% | 0.66%(-0.011)#129 | 0.30%(+0.356)#1,069 |
| 76. | Gouldtown | 0.63% | 0.66%(-0.030)#130 | 0.30%(+0.337)#1,070 |
| 77. | Netcong Borough | 0.63% | 0.66%(-0.033)#131 | 0.30%(+0.334)#1,071 |
| 78. | Hillsborough | 0.63% | 0.66%(-0.038)#132 | 0.30%(+0.329)#1,072 |
| 79. | Succasunna | 0.62% | 0.66%(-0.044)#133 | 0.30%(+0.323)#1,073 |
| 80. | Camden | 0.60% | 0.66%(-0.066)#134 | 0.30%(+0.301)#1,074 |
| 81. | Englewood | 0.59% | 0.66%(-0.070)#135 | 0.30%(+0.297)#1,075 |
| 82. | Phillipsburg | 0.59% | 0.66%(-0.073)#136 | 0.30%(+0.294)#1,076 |
| 83. | Echelon | 0.59% | 0.66%(-0.074)#137 | 0.30%(+0.293)#1,077 |
| 84. | Mays Landing | 0.57% | 0.66%(-0.098)#138 | 0.30%(+0.268)#1,078 |
| 85. | Newton | 0.55% | 0.66%(-0.115)#139 | 0.30%(+0.252)#1,079 |
| 86. | South Toms River Borough | 0.55% | 0.66%(-0.118)#140 | 0.30%(+0.248)#1,080 |
| 87. | Ramapo College Of New Jersey | 0.53% | 0.66%(-0.129)#141 | 0.30%(+0.237)#1,081 |
| 88. | Brookdale | 0.52% | 0.66%(-0.141)#142 | 0.30%(+0.226)#1,082 |
| 89. | Hackettstown | 0.50% | 0.66%(-0.160)#143 | 0.30%(+0.207)#1,083 |
| 90. | Penns Grove Borough | 0.50% | 0.66%(-0.169)#144 | 0.30%(+0.198)#1,084 |
| 91. | Caldwell Borough | 0.49% | 0.66%(-0.170)#145 | 0.30%(+0.197)#1,085 |
| 92. | Wood Ridge Borough | 0.47% | 0.66%(-0.193)#146 | 0.30%(+0.173)#1,086 |
| 93. | Lambertville | 0.44% | 0.66%(-0.228)#147 | 0.30%(+0.138)#1,087 |
| 94. | Pomona | 0.43% | 0.66%(-0.236)#148 | 0.30%(+0.130)#1,088 |
| 95. | Collingswood Borough | 0.42% | 0.66%(-0.247)#149 | 0.30%(+0.120)#1,089 |
| 96. | Watsessing | 0.41% | 0.66%(-0.250)#150 | 0.30%(+0.117)#1,090 |
| 97. | Dumont Borough | 0.41% | 0.66%(-0.254)#151 | 0.30%(+0.113)#1,091 |
| 98. | Byram Center | 0.41% | 0.66%(-0.258)#152 | 0.30%(+0.109)#1,092 |
| 99. | Oxford | 0.40% | 0.66%(-0.264)#153 | 0.30%(+0.103)#1,093 |
| 100. | Paterson | 0.40% | 0.66%(-0.265)#154 | 0.30%(+0.102)#1,094 |
Common Questions
What are the Top 10 Cities with the Highest Percentage of Immigrants from Western Africa in New Jersey?
Top 10 Cities with the Highest Percentage of Immigrants from Western Africa in New Jersey are:
#1
4.95%
#2
4.95%
#3
4.49%
#4
4.21%
#5
4.05%
#6
3.81%
#7
3.67%
#8
3.37%
#9
3.06%
#10
2.91%
What city has the Highest Percentage of Immigrants from Western Africa in New Jersey?
Voorhees has the Highest Percentage of Immigrants from Western Africa in New Jersey with 4.95%.
What is the Percentage of Immigrants from Western Africa in the State of New Jersey?
Percentage of Immigrants from Western Africa in New Jersey is 0.66%.
What is the Percentage of Immigrants from Western Africa in the United States?
Percentage of Immigrants from Western Africa in the United States is 0.30%.