Cities with the Highest Median Costs of Housing in New Jersey
RELATED REPORTS & OPTIONS
Highest Median Housing Costs
New Jersey
Compare Cities
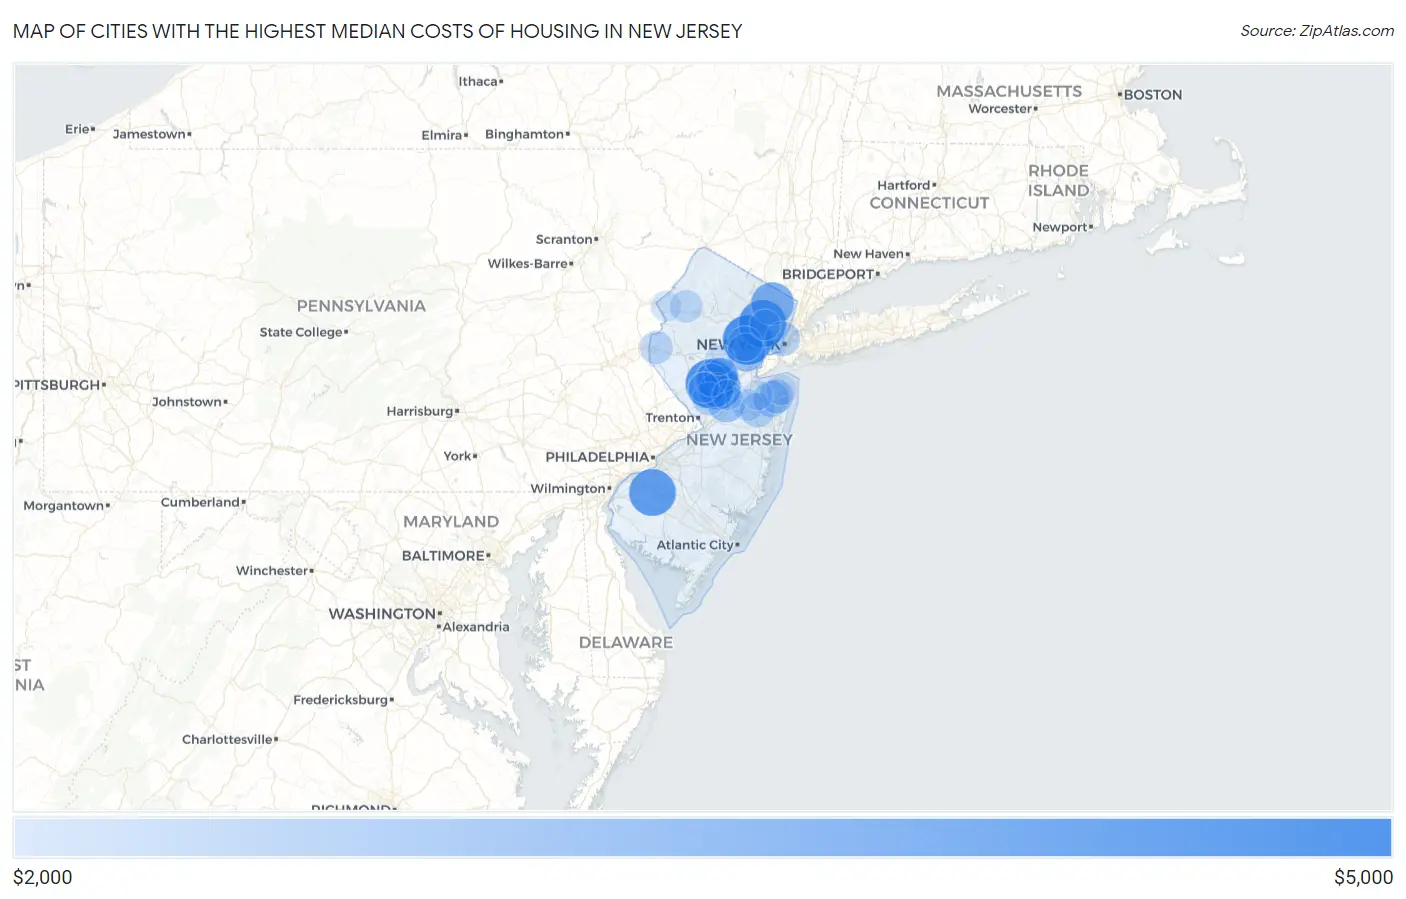
Map of Cities with the Highest Median Costs of Housing in New Jersey
$0
$5,000
Cities with the Highest Median Costs of Housing in New Jersey
| City | Housing Costs | vs State | vs National | |
| 1. | Short Hills | $4,001 | $1,818(+2.18k)#1 | $1,276(+2.73k)#8 |
| 2. | Upper Saddle River Borough | $4,001 | $1,818(+2.18k)#2 | $1,276(+2.73k)#18 |
| 3. | Rumson Borough | $4,001 | $1,818(+2.18k)#3 | $1,276(+2.73k)#21 |
| 4. | Liberty Corner | $4,001 | $1,818(+2.18k)#4 | $1,276(+2.73k)#77 |
| 5. | Rockleigh Borough | $4,001 | $1,818(+2.18k)#5 | $1,276(+2.73k)#114 |
| 6. | Harlingen | $3,950 | $1,818(+2.13k)#6 | $1,276(+2.67k)#147 |
| 7. | Essex Fells Borough | $3,917 | $1,818(+2.10k)#7 | $1,276(+2.64k)#152 |
| 8. | Mount Royal | $3,917 | $1,818(+2.10k)#8 | $1,276(+2.64k)#153 |
| 9. | Upper Montclair | $3,866 | $1,818(+2.05k)#9 | $1,276(+2.59k)#163 |
| 10. | Ho Ho Kus Borough | $3,845 | $1,818(+2.03k)#10 | $1,276(+2.57k)#167 |
| 11. | Richwood | $3,808 | $1,818(+1.99k)#11 | $1,276(+2.53k)#174 |
| 12. | Saddle River Borough | $3,775 | $1,818(+1.96k)#12 | $1,276(+2.50k)#184 |
| 13. | Glen Ridge Borough | $3,743 | $1,818(+1.93k)#13 | $1,276(+2.47k)#195 |
| 14. | Mountain Lakes Borough | $3,724 | $1,818(+1.91k)#14 | $1,276(+2.45k)#198 |
| 15. | Alpine Borough | $3,721 | $1,818(+1.90k)#15 | $1,276(+2.44k)#199 |
| 16. | Cream Ridge | $3,653 | $1,818(+1.83k)#16 | $1,276(+2.38k)#215 |
| 17. | Haworth Borough | $3,643 | $1,818(+1.82k)#17 | $1,276(+2.37k)#216 |
| 18. | Franklin Lakes Borough | $3,622 | $1,818(+1.80k)#18 | $1,276(+2.35k)#223 |
| 19. | Mendham Borough | $3,614 | $1,818(+1.80k)#19 | $1,276(+2.34k)#225 |
| 20. | Ten Mile Run | $3,592 | $1,818(+1.77k)#20 | $1,276(+2.32k)#231 |
| 21. | Fair Haven Borough | $3,544 | $1,818(+1.73k)#21 | $1,276(+2.27k)#241 |
| 22. | Ridgewood | $3,530 | $1,818(+1.71k)#22 | $1,276(+2.25k)#246 |
| 23. | Deans | $3,520 | $1,818(+1.70k)#23 | $1,276(+2.24k)#252 |
| 24. | Demarest Borough | $3,448 | $1,818(+1.63k)#24 | $1,276(+2.17k)#274 |
| 25. | Blackwells Mills | $3,440 | $1,818(+1.62k)#25 | $1,276(+2.16k)#278 |
| 26. | Old Tappan Borough | $3,438 | $1,818(+1.62k)#26 | $1,276(+2.16k)#279 |
| 27. | Tenafly Borough | $3,435 | $1,818(+1.62k)#27 | $1,276(+2.16k)#281 |
| 28. | North Caldwell Borough | $3,430 | $1,818(+1.61k)#28 | $1,276(+2.15k)#283 |
| 29. | Llewellyn Park | $3,408 | $1,818(+1.59k)#29 | $1,276(+2.13k)#288 |
| 30. | Little Silver Borough | $3,348 | $1,818(+1.53k)#30 | $1,276(+2.07k)#315 |
| 31. | Woodcliff Lake Borough | $3,271 | $1,818(+1.45k)#31 | $1,276(+2.00k)#345 |
| 32. | Monroe Manor | $3,258 | $1,818(+1.44k)#32 | $1,276(+1.98k)#353 |
| 33. | Chatham Borough | $3,254 | $1,818(+1.44k)#33 | $1,276(+1.98k)#354 |
| 34. | Glen Rock Borough | $3,208 | $1,818(+1.39k)#34 | $1,276(+1.93k)#375 |
| 35. | Bernardsville Borough | $3,195 | $1,818(+1.38k)#35 | $1,276(+1.92k)#384 |
| 36. | Westfield | $3,188 | $1,818(+1.37k)#36 | $1,276(+1.91k)#388 |
| 37. | Allendale Borough | $3,164 | $1,818(+1.35k)#37 | $1,276(+1.89k)#404 |
| 38. | New Vernon | $3,149 | $1,818(+1.33k)#38 | $1,276(+1.87k)#412 |
| 39. | Cranbury | $3,133 | $1,818(+1.31k)#39 | $1,276(+1.86k)#424 |
| 40. | Pines Lake | $3,123 | $1,818(+1.30k)#40 | $1,276(+1.85k)#429 |
| 41. | Lyons | $3,108 | $1,818(+1.29k)#41 | $1,276(+1.83k)#435 |
| 42. | Mountainside Borough | $3,085 | $1,818(+1.27k)#42 | $1,276(+1.81k)#450 |
| 43. | Fanwood Borough | $3,051 | $1,818(+1.23k)#43 | $1,276(+1.77k)#472 |
| 44. | Blawenburg | $3,044 | $1,818(+1.23k)#44 | $1,276(+1.77k)#479 |
| 45. | Lincroft | $3,042 | $1,818(+1.22k)#45 | $1,276(+1.77k)#481 |
| 46. | Haddonfield Borough | $3,036 | $1,818(+1.22k)#46 | $1,276(+1.76k)#485 |
| 47. | Ramsey Borough | $3,004 | $1,818(+1.19k)#47 | $1,276(+1.73k)#504 |
| 48. | Summit | $2,988 | $1,818(+1.17k)#48 | $1,276(+1.71k)#512 |
| 49. | Pleasantdale | $2,987 | $1,818(+1.17k)#49 | $1,276(+1.71k)#514 |
| 50. | Norwood Borough | $2,964 | $1,818(+1.15k)#50 | $1,276(+1.69k)#533 |
| 51. | Hoboken | $2,962 | $1,818(+1.14k)#51 | $1,276(+1.69k)#538 |
| 52. | Shrewsbury Borough | $2,962 | $1,818(+1.14k)#52 | $1,276(+1.69k)#540 |
| 53. | Kinnelon Borough | $2,949 | $1,818(+1.13k)#53 | $1,276(+1.67k)#546 |
| 54. | Oradell Borough | $2,946 | $1,818(+1.13k)#54 | $1,276(+1.67k)#548 |
| 55. | East Freehold | $2,941 | $1,818(+1.12k)#55 | $1,276(+1.67k)#550 |
| 56. | Brookside | $2,938 | $1,818(+1.12k)#56 | $1,276(+1.66k)#553 |
| 57. | Fairview | $2,934 | $1,818(+1.12k)#57 | $1,276(+1.66k)#559 |
| 58. | East Millstone | $2,932 | $1,818(+1.11k)#58 | $1,276(+1.66k)#561 |
| 59. | Packanack Lake | $2,931 | $1,818(+1.11k)#59 | $1,276(+1.66k)#562 |
| 60. | East Rocky Hill | $2,929 | $1,818(+1.11k)#60 | $1,276(+1.65k)#564 |
| 61. | Hillsdale Borough | $2,912 | $1,818(+1.09k)#61 | $1,276(+1.64k)#576 |
| 62. | Neshanic Station | $2,908 | $1,818(+1.09k)#62 | $1,276(+1.63k)#579 |
| 63. | Closter Borough | $2,897 | $1,818(+1.08k)#63 | $1,276(+1.62k)#584 |
| 64. | Harrington Park Borough | $2,875 | $1,818(+1.06k)#64 | $1,276(+1.60k)#602 |
| 65. | Cresskill Borough | $2,874 | $1,818(+1.06k)#65 | $1,276(+1.60k)#604 |
| 66. | Forsgate | $2,872 | $1,818(+1.05k)#66 | $1,276(+1.60k)#606 |
| 67. | Springfield | $2,863 | $1,818(+1.04k)#67 | $1,276(+1.59k)#616 |
| 68. | Mantoloking Borough | $2,846 | $1,818(+1.03k)#68 | $1,276(+1.57k)#631 |
| 69. | Princeton | $2,845 | $1,818(+1.03k)#69 | $1,276(+1.57k)#633 |
| 70. | Greenwich | $2,845 | $1,818(+1.03k)#70 | $1,276(+1.57k)#634 |
| 71. | Roseland Borough | $2,842 | $1,818(+1.02k)#71 | $1,276(+1.57k)#636 |
| 72. | Stirling | $2,840 | $1,818(+1.02k)#72 | $1,276(+1.56k)#638 |
| 73. | Belle Mead | $2,828 | $1,818(+1.01k)#73 | $1,276(+1.55k)#645 |
| 74. | Oakland Borough | $2,826 | $1,818(+1.01k)#74 | $1,276(+1.55k)#647 |
| 75. | Florham Park Borough | $2,825 | $1,818(+1.01k)#75 | $1,276(+1.55k)#649 |
| 76. | Far Hills Borough | $2,818 | $1,818(+1,000)#76 | $1,276(+1.54k)#655 |
| 77. | Johnsonburg | $2,810 | $1,818(+992)#77 | $1,276(+1.53k)#661 |
| 78. | Cedar Knolls | $2,779 | $1,818(+961)#78 | $1,276(+1.50k)#685 |
| 79. | Oldwick | $2,763 | $1,818(+945)#79 | $1,276(+1.49k)#698 |
| 80. | Englewood Cliffs Borough | $2,761 | $1,818(+943)#80 | $1,276(+1.49k)#701 |
| 81. | Yorketown | $2,749 | $1,818(+931)#81 | $1,276(+1.47k)#722 |
| 82. | Peapack And Gladstone Borough | $2,734 | $1,818(+916)#82 | $1,276(+1.46k)#739 |
| 83. | Edgewater Borough | $2,730 | $1,818(+912)#83 | $1,276(+1.45k)#743 |
| 84. | Sea Girt Borough | $2,701 | $1,818(+883)#84 | $1,276(+1.43k)#772 |
| 85. | Navesink | $2,694 | $1,818(+876)#85 | $1,276(+1.42k)#776 |
| 86. | Montvale Borough | $2,693 | $1,818(+875)#86 | $1,276(+1.42k)#778 |
| 87. | Bridgewater Center | $2,687 | $1,818(+869)#87 | $1,276(+1.41k)#787 |
| 88. | Towaco | $2,687 | $1,818(+869)#88 | $1,276(+1.41k)#788 |
| 89. | Brookdale | $2,684 | $1,818(+866)#89 | $1,276(+1.41k)#790 |
| 90. | Waldwick Borough | $2,681 | $1,818(+863)#90 | $1,276(+1.41k)#793 |
| 91. | Hainesburg | $2,676 | $1,818(+858)#91 | $1,276(+1.40k)#796 |
| 92. | Skillman | $2,667 | $1,818(+849)#92 | $1,276(+1.39k)#803 |
| 93. | Dayton | $2,665 | $1,818(+847)#93 | $1,276(+1.39k)#805 |
| 94. | Martinsville | $2,663 | $1,818(+845)#94 | $1,276(+1.39k)#807 |
| 95. | Bedminster | $2,662 | $1,818(+844)#95 | $1,276(+1.39k)#809 |
| 96. | Flagtown | $2,656 | $1,818(+838)#96 | $1,276(+1.38k)#820 |
| 97. | Spring Lake Borough | $2,651 | $1,818(+833)#97 | $1,276(+1.38k)#828 |
| 98. | Troy Hills | $2,645 | $1,818(+827)#98 | $1,276(+1.37k)#833 |
| 99. | Morganville | $2,645 | $1,818(+827)#99 | $1,276(+1.37k)#834 |
| 100. | Madison Borough | $2,642 | $1,818(+824)#100 | $1,276(+1.37k)#841 |
Common Questions
What are the Top 10 Cities with the Highest Median Costs of Housing in New Jersey?
Top 10 Cities with the Highest Median Costs of Housing in New Jersey are:
#1
$4,001
#2
$3,950
#3
$3,866
#4
$3,808
#5
$3,592
#6
$3,530
#7
$3,440
#8
$3,188
#9
$3,133
#10
$3,044
What city has the Highest Median Costs of Housing in New Jersey?
Short Hills has the Highest Median Costs of Housing in New Jersey with $4,001.
What is the Median Housing Costs in the State of New Jersey?
Median Housing Costs in New Jersey is $1,818.
What is the Median Housing Costs in the United States?
Median Housing Costs in the United States is $1,276.