Cities with the Highest Poverty Level Among Single Males in New Jersey
RELATED REPORTS & OPTIONS
Highest Poverty | Single Male
New Jersey
Compare Cities
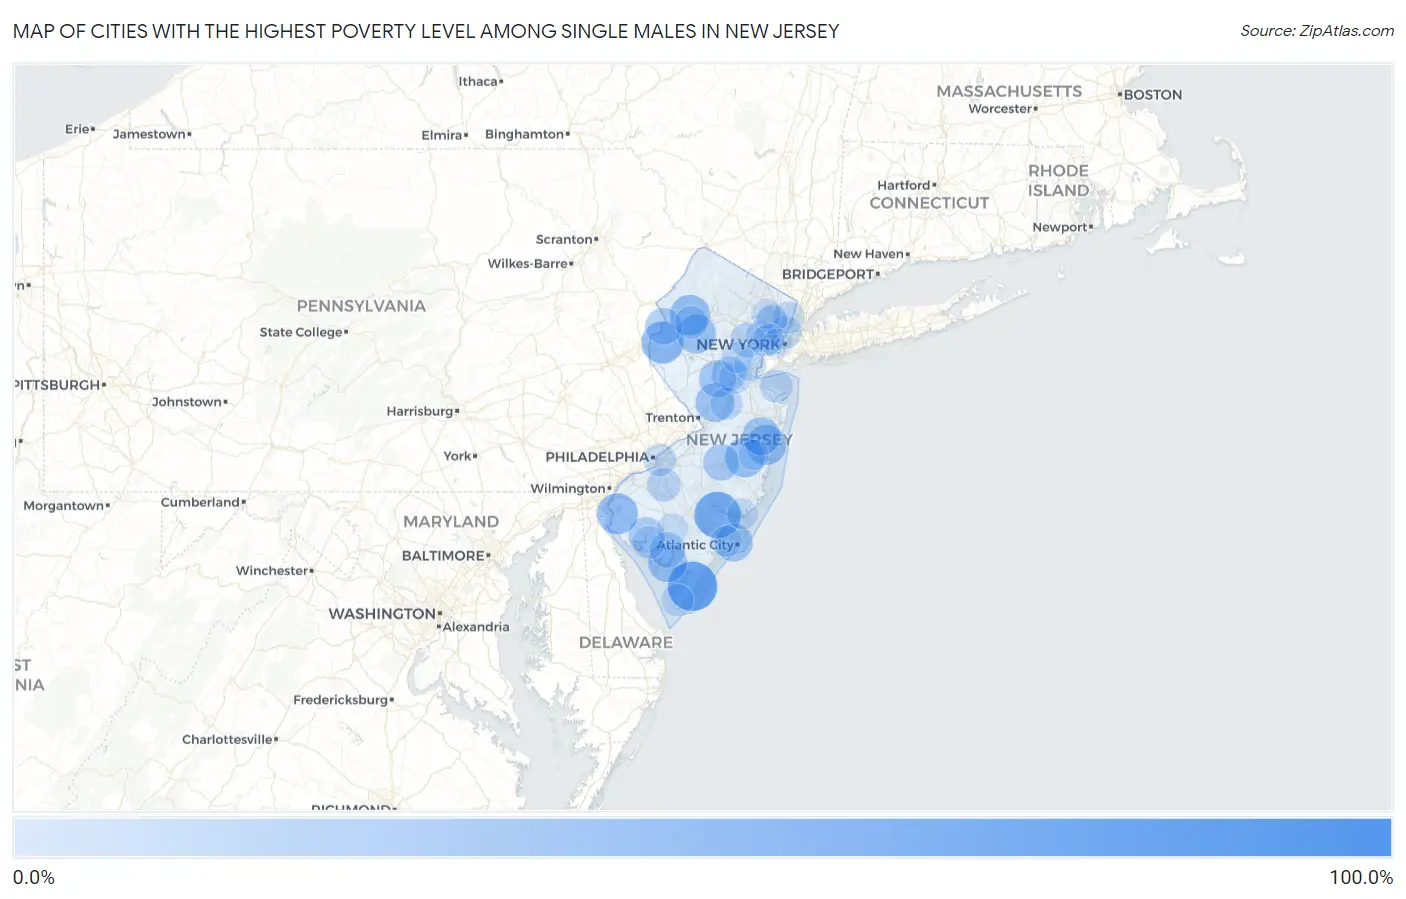
Map of Cities with the Highest Poverty Level Among Single Males in New Jersey
0.0%
100.0%
Cities with the Highest Poverty Level Among Single Males in New Jersey
| City | Single Male Poverty | vs State | vs National | |
| 1. | Keasbey | 100.0% | 10.1%(+89.9)#1 | 12.4%(+87.6)#59 |
| 2. | Dorchester | 100.0% | 10.1%(+89.9)#2 | 12.4%(+87.6)#711 |
| 3. | Teterboro Borough | 100.0% | 10.1%(+89.9)#3 | 12.4%(+87.6)#802 |
| 4. | Seaside Heights Borough | 93.9% | 10.1%(+83.9)#4 | 12.4%(+81.5)#920 |
| 5. | Cape May Court House | 82.0% | 10.1%(+71.9)#5 | 12.4%(+69.5)#1,057 |
| 6. | Avon By The Sea Borough | 73.3% | 10.1%(+63.3)#6 | 12.4%(+60.9)#1,244 |
| 7. | Atco | 72.4% | 10.1%(+62.3)#7 | 12.4%(+59.9)#1,266 |
| 8. | New Vernon | 71.4% | 10.1%(+61.4)#8 | 12.4%(+59.0)#1,284 |
| 9. | Egg Harbor City | 71.3% | 10.1%(+61.2)#9 | 12.4%(+58.8)#1,311 |
| 10. | Basking Ridge | 69.0% | 10.1%(+58.9)#10 | 12.4%(+56.5)#1,369 |
| 11. | Haworth Borough | 64.5% | 10.1%(+54.5)#11 | 12.4%(+52.1)#1,534 |
| 12. | New Village | 56.1% | 10.1%(+46.0)#12 | 12.4%(+43.7)#1,910 |
| 13. | Sussex Borough | 54.5% | 10.1%(+44.5)#13 | 12.4%(+42.1)#1,979 |
| 14. | Tenafly Borough | 52.6% | 10.1%(+42.5)#14 | 12.4%(+40.1)#2,105 |
| 15. | Salem | 52.3% | 10.1%(+42.2)#15 | 12.4%(+39.8)#2,122 |
| 16. | Panther Valley | 50.0% | 10.1%(+39.9)#16 | 12.4%(+37.6)#2,189 |
| 17. | Pine Beach Borough | 50.0% | 10.1%(+39.9)#17 | 12.4%(+37.6)#2,202 |
| 18. | Leisure Village East | 49.0% | 10.1%(+38.9)#18 | 12.4%(+36.6)#2,420 |
| 19. | Crestwood Village | 48.0% | 10.1%(+38.0)#19 | 12.4%(+35.6)#2,462 |
| 20. | Carlstadt Borough | 47.0% | 10.1%(+37.0)#20 | 12.4%(+34.6)#2,522 |
| 21. | Chatham Borough | 46.9% | 10.1%(+36.8)#21 | 12.4%(+34.4)#2,525 |
| 22. | Port Norris | 46.3% | 10.1%(+36.3)#22 | 12.4%(+33.9)#2,560 |
| 23. | Long Valley | 46.3% | 10.1%(+36.2)#23 | 12.4%(+33.9)#2,568 |
| 24. | Princeton Junction | 45.2% | 10.1%(+35.1)#24 | 12.4%(+32.7)#2,644 |
| 25. | Rockaway Borough | 43.7% | 10.1%(+33.6)#25 | 12.4%(+31.2)#2,749 |
| 26. | Hamburg Borough | 43.2% | 10.1%(+33.2)#26 | 12.4%(+30.8)#2,766 |
| 27. | South Toms River Borough | 42.9% | 10.1%(+32.8)#27 | 12.4%(+30.4)#2,787 |
| 28. | Netcong Borough | 42.9% | 10.1%(+32.8)#28 | 12.4%(+30.4)#2,788 |
| 29. | Atlantic City | 42.3% | 10.1%(+32.3)#29 | 12.4%(+29.9)#2,843 |
| 30. | Lakewood | 42.1% | 10.1%(+32.1)#30 | 12.4%(+29.7)#2,860 |
| 31. | Kenilworth Borough | 41.7% | 10.1%(+31.6)#31 | 12.4%(+29.2)#2,889 |
| 32. | Dunellen Borough | 41.2% | 10.1%(+31.2)#32 | 12.4%(+28.8)#2,934 |
| 33. | West Park | 40.0% | 10.1%(+29.9)#33 | 12.4%(+27.6)#3,028 |
| 34. | Blackwells Mills | 38.6% | 10.1%(+28.5)#34 | 12.4%(+26.2)#3,194 |
| 35. | Collingswood Borough | 37.9% | 10.1%(+27.8)#35 | 12.4%(+25.5)#3,245 |
| 36. | Belvidere | 37.5% | 10.1%(+27.4)#36 | 12.4%(+25.1)#3,266 |
| 37. | Presidential Lakes Estates | 36.1% | 10.1%(+26.0)#37 | 12.4%(+23.7)#3,422 |
| 38. | Bridgeton | 35.0% | 10.1%(+25.0)#38 | 12.4%(+22.6)#3,531 |
| 39. | Harrington Park Borough | 35.0% | 10.1%(+24.9)#39 | 12.4%(+22.6)#3,532 |
| 40. | Keansburg Borough | 34.8% | 10.1%(+24.8)#40 | 12.4%(+22.4)#3,560 |
| 41. | Wood Ridge Borough | 34.8% | 10.1%(+24.7)#41 | 12.4%(+22.4)#3,561 |
| 42. | Bound Brook Borough | 33.3% | 10.1%(+23.3)#42 | 12.4%(+20.9)#3,654 |
| 43. | Laurel Lake | 32.9% | 10.1%(+22.9)#43 | 12.4%(+20.5)#3,846 |
| 44. | Somerset | 31.1% | 10.1%(+21.0)#44 | 12.4%(+18.6)#4,047 |
| 45. | Millington | 31.0% | 10.1%(+21.0)#45 | 12.4%(+18.6)#4,049 |
| 46. | Woodcliff Lake Borough | 30.4% | 10.1%(+20.4)#46 | 12.4%(+18.0)#4,112 |
| 47. | Short Hills | 29.6% | 10.1%(+19.6)#47 | 12.4%(+17.2)#4,221 |
| 48. | Troy Hills | 29.6% | 10.1%(+19.6)#48 | 12.4%(+17.2)#4,222 |
| 49. | Bellmawr Borough | 28.6% | 10.1%(+18.5)#49 | 12.4%(+16.2)#4,319 |
| 50. | Northvale Borough | 27.4% | 10.1%(+17.3)#50 | 12.4%(+15.0)#4,523 |
| 51. | Turnersville | 27.3% | 10.1%(+17.2)#51 | 12.4%(+14.8)#4,532 |
| 52. | Hampton Borough | 27.3% | 10.1%(+17.2)#52 | 12.4%(+14.8)#4,543 |
| 53. | Totowa Borough | 27.0% | 10.1%(+17.0)#53 | 12.4%(+14.6)#4,579 |
| 54. | Brooklawn Borough | 25.7% | 10.1%(+15.7)#54 | 12.4%(+13.3)#4,759 |
| 55. | Laurel Springs Borough | 25.0% | 10.1%(+14.9)#55 | 12.4%(+12.6)#4,840 |
| 56. | Fairton | 25.0% | 10.1%(+14.9)#56 | 12.4%(+12.6)#4,876 |
| 57. | Guttenberg | 24.9% | 10.1%(+14.8)#57 | 12.4%(+12.4)#4,966 |
| 58. | Hackettstown | 24.3% | 10.1%(+14.2)#58 | 12.4%(+11.8)#5,056 |
| 59. | Belford | 24.1% | 10.1%(+14.0)#59 | 12.4%(+11.6)#5,078 |
| 60. | Hopewell Borough | 24.0% | 10.1%(+13.9)#60 | 12.4%(+11.6)#5,090 |
| 61. | Saddle River Borough | 23.8% | 10.1%(+13.8)#61 | 12.4%(+11.4)#5,119 |
| 62. | Passaic | 23.4% | 10.1%(+13.3)#62 | 12.4%(+10.9)#5,186 |
| 63. | Cranbury | 23.1% | 10.1%(+13.0)#63 | 12.4%(+10.6)#5,231 |
| 64. | Camden | 23.0% | 10.1%(+12.9)#64 | 12.4%(+10.5)#5,263 |
| 65. | Franklinville | 22.9% | 10.1%(+12.8)#65 | 12.4%(+10.4)#5,279 |
| 66. | Fieldsboro Borough | 22.9% | 10.1%(+12.8)#66 | 12.4%(+10.4)#5,282 |
| 67. | North Cape May | 22.4% | 10.1%(+12.4)#67 | 12.4%(+10.0)#5,352 |
| 68. | New Brunswick | 22.3% | 10.1%(+12.3)#68 | 12.4%(+9.89)#5,370 |
| 69. | Pines Lake | 22.0% | 10.1%(+11.9)#69 | 12.4%(+9.56)#5,445 |
| 70. | Englewood | 21.4% | 10.1%(+11.4)#70 | 12.4%(+9.01)#5,528 |
| 71. | Woodbine Borough | 21.4% | 10.1%(+11.4)#71 | 12.4%(+8.99)#5,534 |
| 72. | Eatontown Borough | 21.0% | 10.1%(+10.9)#72 | 12.4%(+8.53)#5,634 |
| 73. | Iselin | 20.6% | 10.1%(+10.5)#73 | 12.4%(+8.15)#5,704 |
| 74. | Plainfield | 20.0% | 10.1%(+9.91)#74 | 12.4%(+7.52)#5,907 |
| 75. | Bogota Borough | 19.8% | 10.1%(+9.75)#75 | 12.4%(+7.37)#5,918 |
| 76. | Red Bank Borough | 19.6% | 10.1%(+9.55)#76 | 12.4%(+7.17)#5,946 |
| 77. | East Orange | 19.4% | 10.1%(+9.38)#77 | 12.4%(+7.00)#5,975 |
| 78. | Vineland | 19.3% | 10.1%(+9.28)#78 | 12.4%(+6.90)#5,994 |
| 79. | Sicklerville | 19.3% | 10.1%(+9.25)#79 | 12.4%(+6.87)#5,999 |
| 80. | Pleasantville | 18.5% | 10.1%(+8.42)#80 | 12.4%(+6.04)#6,164 |
| 81. | East Rutherford Borough | 18.3% | 10.1%(+8.27)#81 | 12.4%(+5.89)#6,183 |
| 82. | Caldwell Borough | 18.3% | 10.1%(+8.22)#82 | 12.4%(+5.84)#6,190 |
| 83. | Woodbury Heights Borough | 18.1% | 10.1%(+8.03)#83 | 12.4%(+5.65)#6,257 |
| 84. | Prospect Park Borough | 18.0% | 10.1%(+7.95)#84 | 12.4%(+5.57)#6,269 |
| 85. | Vauxhall | 17.9% | 10.1%(+7.86)#85 | 12.4%(+5.48)#6,285 |
| 86. | Mystic Island | 17.6% | 10.1%(+7.55)#86 | 12.4%(+5.16)#6,350 |
| 87. | Newfield Borough | 17.5% | 10.1%(+7.45)#87 | 12.4%(+5.06)#6,376 |
| 88. | Penns Grove Borough | 17.3% | 10.1%(+7.25)#88 | 12.4%(+4.87)#6,409 |
| 89. | Florham Park Borough | 16.8% | 10.1%(+6.75)#89 | 12.4%(+4.37)#6,507 |
| 90. | Neptune City Borough | 16.7% | 10.1%(+6.61)#90 | 12.4%(+4.23)#6,527 |
| 91. | Newark | 16.5% | 10.1%(+6.48)#91 | 12.4%(+4.09)#6,627 |
| 92. | Holiday City Berkeley | 15.8% | 10.1%(+5.79)#92 | 12.4%(+3.41)#6,771 |
| 93. | Keyport Borough | 15.8% | 10.1%(+5.79)#93 | 12.4%(+3.41)#6,772 |
| 94. | Lake Como Borough | 15.8% | 10.1%(+5.73)#94 | 12.4%(+3.35)#6,788 |
| 95. | Garfield | 15.8% | 10.1%(+5.73)#95 | 12.4%(+3.35)#6,807 |
| 96. | Lake Hopatcong | 15.7% | 10.1%(+5.61)#96 | 12.4%(+3.23)#6,830 |
| 97. | Jersey City | 15.1% | 10.1%(+5.08)#97 | 12.4%(+2.70)#6,987 |
| 98. | Paterson | 15.1% | 10.1%(+5.08)#98 | 12.4%(+2.70)#6,989 |
| 99. | Harrison | 14.9% | 10.1%(+4.84)#99 | 12.4%(+2.46)#7,032 |
| 100. | Woodlynne Borough | 14.9% | 10.1%(+4.81)#100 | 12.4%(+2.43)#7,042 |
Common Questions
What are the Top 10 Cities with the Highest Poverty Level Among Single Males in New Jersey?
Top 10 Cities with the Highest Poverty Level Among Single Males in New Jersey are:
#1
82.0%
#2
71.3%
#3
56.1%
#4
52.3%
#5
50.0%
#6
49.0%
#7
48.0%
#8
46.3%
#9
46.3%
#10
45.2%
What city has the Highest Poverty Level Among Single Males in New Jersey?
Cape May Court House has the Highest Poverty Level Among Single Males in New Jersey with 82.0%.
What is the Poverty Level Among Single Males in the State of New Jersey?
Poverty Level Among Single Males in New Jersey is 10.1%.
What is the Poverty Level Among Single Males in the United States?
Poverty Level Among Single Males in the United States is 12.4%.