Cities with the Lowest Poverty Level in New Jersey
RELATED REPORTS & OPTIONS
Lowest Poverty
New Jersey
Compare Cities
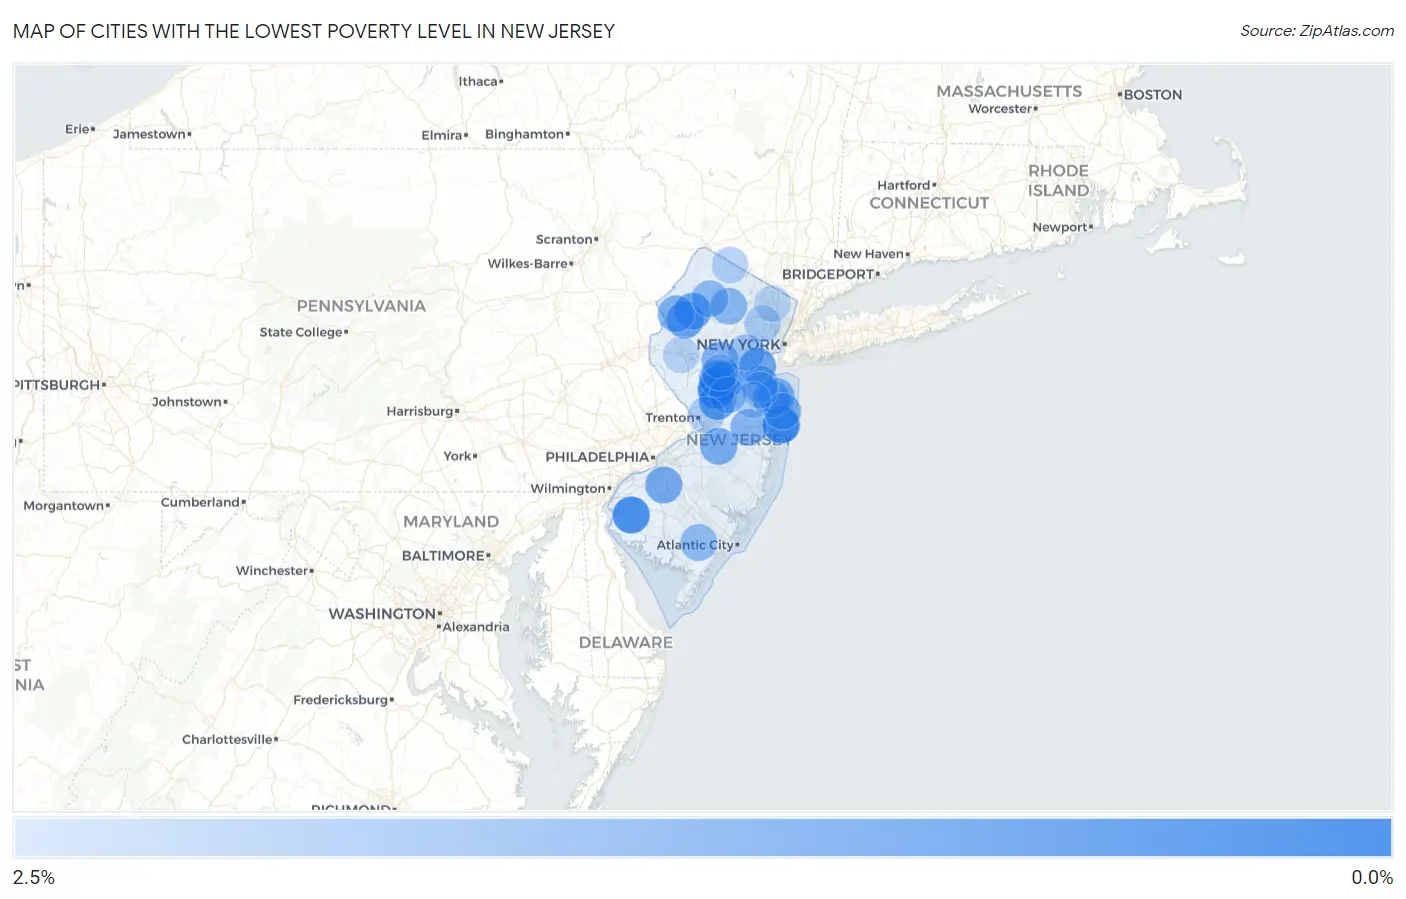
Map of Cities with the Lowest Poverty Level in New Jersey
2.5%
0.0%
Cities with the Lowest Poverty Level in New Jersey
| City | Poverty | vs State | vs National | |
| 1. | Ho Ho Kus Borough | 0.071% | 9.7%(-9.61)#1 | 12.5%(-12.5)#2 |
| 2. | Hopelawn | 0.14% | 9.7%(-9.54)#2 | 12.5%(-12.4)#13 |
| 3. | West Belmar | 0.18% | 9.7%(-9.51)#3 | 12.5%(-12.4)#16 |
| 4. | Griggstown | 0.18% | 9.7%(-9.50)#4 | 12.5%(-12.4)#17 |
| 5. | Beesleys Point | 0.21% | 9.7%(-9.47)#5 | 12.5%(-12.3)#25 |
| 6. | East Rocky Hill | 0.24% | 9.7%(-9.44)#6 | 12.5%(-12.3)#33 |
| 7. | Springfield | 0.27% | 9.7%(-9.41)#7 | 12.5%(-12.3)#40 |
| 8. | North Caldwell Borough | 0.29% | 9.7%(-9.39)#8 | 12.5%(-12.2)#45 |
| 9. | Hewitt | 0.31% | 9.7%(-9.37)#9 | 12.5%(-12.2)#55 |
| 10. | Neshanic Station | 0.32% | 9.7%(-9.36)#10 | 12.5%(-12.2)#57 |
| 11. | Medford Lakes Borough | 0.35% | 9.7%(-9.33)#11 | 12.5%(-12.2)#67 |
| 12. | Alloway | 0.43% | 9.7%(-9.26)#12 | 12.5%(-12.1)#96 |
| 13. | Demarest Borough | 0.47% | 9.7%(-9.21)#13 | 12.5%(-12.1)#109 |
| 14. | Layton | 0.50% | 9.7%(-9.18)#14 | 12.5%(-12.0)#124 |
| 15. | Island Heights Borough | 0.59% | 9.7%(-9.09)#15 | 12.5%(-11.9)#156 |
| 16. | Six Mile Run | 0.71% | 9.7%(-8.97)#16 | 12.5%(-11.8)#209 |
| 17. | Brielle Borough | 0.77% | 9.7%(-8.91)#17 | 12.5%(-11.8)#237 |
| 18. | Packanack Lake | 0.79% | 9.7%(-8.90)#18 | 12.5%(-11.7)#247 |
| 19. | Essex Fells Borough | 0.79% | 9.7%(-8.90)#19 | 12.5%(-11.7)#248 |
| 20. | Pines Lake | 0.79% | 9.7%(-8.89)#20 | 12.5%(-11.7)#250 |
| 21. | Seaville | 0.79% | 9.7%(-8.89)#21 | 12.5%(-11.7)#251 |
| 22. | Plainsboro Center | 0.80% | 9.7%(-8.89)#22 | 12.5%(-11.7)#256 |
| 23. | Port Reading | 0.89% | 9.7%(-8.79)#23 | 12.5%(-11.6)#307 |
| 24. | Vienna | 0.91% | 9.7%(-8.77)#24 | 12.5%(-11.6)#315 |
| 25. | Fair Haven Borough | 0.97% | 9.7%(-8.72)#25 | 12.5%(-11.6)#336 |
| 26. | Mickleton | 0.98% | 9.7%(-8.70)#26 | 12.5%(-11.6)#346 |
| 27. | Allamuchy | 0.98% | 9.7%(-8.70)#27 | 12.5%(-11.6)#348 |
| 28. | Sea Girt Borough | 0.99% | 9.7%(-8.70)#28 | 12.5%(-11.5)#350 |
| 29. | Milmay | 1.1% | 9.7%(-8.63)#29 | 12.5%(-11.5)#382 |
| 30. | Cedar Knolls | 1.1% | 9.7%(-8.58)#30 | 12.5%(-11.4)#410 |
| 31. | Milltown Borough | 1.1% | 9.7%(-8.56)#31 | 12.5%(-11.4)#428 |
| 32. | Mount Tabor | 1.2% | 9.7%(-8.52)#32 | 12.5%(-11.4)#463 |
| 33. | Little Silver Borough | 1.2% | 9.7%(-8.50)#33 | 12.5%(-11.4)#474 |
| 34. | Turnersville | 1.2% | 9.7%(-8.48)#34 | 12.5%(-11.3)#488 |
| 35. | Lincroft | 1.2% | 9.7%(-8.47)#35 | 12.5%(-11.3)#494 |
| 36. | Mcguire Afb | 1.2% | 9.7%(-8.47)#36 | 12.5%(-11.3)#497 |
| 37. | Glen Ridge Borough | 1.2% | 9.7%(-8.45)#37 | 12.5%(-11.3)#505 |
| 38. | Wenonah Borough | 1.3% | 9.7%(-8.42)#38 | 12.5%(-11.3)#526 |
| 39. | Sheppards Mill | 1.3% | 9.7%(-8.42)#39 | 12.5%(-11.3)#531 |
| 40. | Fairview | 1.3% | 9.7%(-8.38)#40 | 12.5%(-11.2)#556 |
| 41. | Mountain Lakes Borough | 1.3% | 9.7%(-8.37)#41 | 12.5%(-11.2)#565 |
| 42. | Fanwood Borough | 1.3% | 9.7%(-8.36)#42 | 12.5%(-11.2)#572 |
| 43. | Blackwells Mills | 1.3% | 9.7%(-8.34)#43 | 12.5%(-11.2)#584 |
| 44. | Great Notch | 1.3% | 9.7%(-8.34)#44 | 12.5%(-11.2)#585 |
| 45. | Oakhurst | 1.3% | 9.7%(-8.34)#45 | 12.5%(-11.2)#587 |
| 46. | Hope | 1.4% | 9.7%(-8.31)#46 | 12.5%(-11.2)#607 |
| 47. | Hightstown Borough | 1.4% | 9.7%(-8.30)#47 | 12.5%(-11.2)#614 |
| 48. | Midland Park Borough | 1.4% | 9.7%(-8.26)#48 | 12.5%(-11.1)#655 |
| 49. | Martinsville | 1.4% | 9.7%(-8.24)#49 | 12.5%(-11.1)#666 |
| 50. | Stanhope Borough | 1.5% | 9.7%(-8.18)#50 | 12.5%(-11.0)#711 |
| 51. | Vista Center | 1.5% | 9.7%(-8.16)#51 | 12.5%(-11.0)#722 |
| 52. | Ramsey Borough | 1.5% | 9.7%(-8.15)#52 | 12.5%(-11.0)#724 |
| 53. | Green | 1.5% | 9.7%(-8.15)#53 | 12.5%(-11.0)#728 |
| 54. | Old Tappan Borough | 1.6% | 9.7%(-8.11)#54 | 12.5%(-11.0)#769 |
| 55. | Auburn | 1.6% | 9.7%(-8.08)#55 | 12.5%(-10.9)#794 |
| 56. | Lake Telemark | 1.6% | 9.7%(-8.07)#56 | 12.5%(-10.9)#805 |
| 57. | Lake Mohawk | 1.6% | 9.7%(-8.05)#57 | 12.5%(-10.9)#819 |
| 58. | The Ponds | 1.6% | 9.7%(-8.05)#58 | 12.5%(-10.9)#821 |
| 59. | Stonebridge | 1.7% | 9.7%(-8.00)#59 | 12.5%(-10.9)#860 |
| 60. | Cliffwood Beach | 1.7% | 9.7%(-7.99)#60 | 12.5%(-10.8)#871 |
| 61. | Estell Manor | 1.7% | 9.7%(-7.95)#61 | 12.5%(-10.8)#905 |
| 62. | Vincentown | 1.8% | 9.7%(-7.88)#62 | 12.5%(-10.7)#954 |
| 63. | Watchung Borough | 1.8% | 9.7%(-7.87)#63 | 12.5%(-10.7)#965 |
| 64. | Dayton | 1.8% | 9.7%(-7.85)#64 | 12.5%(-10.7)#981 |
| 65. | Flagtown | 1.8% | 9.7%(-7.85)#65 | 12.5%(-10.7)#982 |
| 66. | Roseland Borough | 1.8% | 9.7%(-7.85)#66 | 12.5%(-10.7)#983 |
| 67. | Mount Hope | 1.9% | 9.7%(-7.81)#67 | 12.5%(-10.7)#1,026 |
| 68. | Spotswood Borough | 1.9% | 9.7%(-7.75)#68 | 12.5%(-10.6)#1,067 |
| 69. | Palermo | 1.9% | 9.7%(-7.75)#69 | 12.5%(-10.6)#1,071 |
| 70. | Westfield | 2.0% | 9.7%(-7.71)#70 | 12.5%(-10.6)#1,110 |
| 71. | Roosevelt Borough | 2.0% | 9.7%(-7.66)#71 | 12.5%(-10.5)#1,160 |
| 72. | Mendham Borough | 2.0% | 9.7%(-7.65)#72 | 12.5%(-10.5)#1,165 |
| 73. | New Providence Borough | 2.0% | 9.7%(-7.65)#73 | 12.5%(-10.5)#1,169 |
| 74. | Llewellyn Park | 2.1% | 9.7%(-7.63)#74 | 12.5%(-10.5)#1,197 |
| 75. | Union Beach Borough | 2.1% | 9.7%(-7.61)#75 | 12.5%(-10.5)#1,215 |
| 76. | Lincoln Park Borough | 2.1% | 9.7%(-7.61)#76 | 12.5%(-10.5)#1,218 |
| 77. | Ship Bottom Borough | 2.1% | 9.7%(-7.57)#77 | 12.5%(-10.4)#1,254 |
| 78. | Haddonfield Borough | 2.1% | 9.7%(-7.55)#78 | 12.5%(-10.4)#1,277 |
| 79. | Chatham Borough | 2.1% | 9.7%(-7.54)#79 | 12.5%(-10.4)#1,285 |
| 80. | Weston | 2.1% | 9.7%(-7.54)#80 | 12.5%(-10.4)#1,289 |
| 81. | Ocean Gate Borough | 2.2% | 9.7%(-7.50)#81 | 12.5%(-10.4)#1,329 |
| 82. | Upper Montclair | 2.2% | 9.7%(-7.49)#82 | 12.5%(-10.3)#1,345 |
| 83. | Manasquan Borough | 2.2% | 9.7%(-7.47)#83 | 12.5%(-10.3)#1,361 |
| 84. | Forsgate | 2.2% | 9.7%(-7.46)#84 | 12.5%(-10.3)#1,368 |
| 85. | Mercerville | 2.2% | 9.7%(-7.46)#85 | 12.5%(-10.3)#1,378 |
| 86. | Upper Greenwood Lake | 2.2% | 9.7%(-7.45)#86 | 12.5%(-10.3)#1,382 |
| 87. | Vernon Valley | 2.2% | 9.7%(-7.44)#87 | 12.5%(-10.3)#1,389 |
| 88. | Hopewell Borough | 2.2% | 9.7%(-7.43)#88 | 12.5%(-10.3)#1,393 |
| 89. | Englewood Cliffs Borough | 2.2% | 9.7%(-7.43)#89 | 12.5%(-10.3)#1,397 |
| 90. | Ringwood Borough | 2.2% | 9.7%(-7.43)#90 | 12.5%(-10.3)#1,398 |
| 91. | Strathmore | 2.3% | 9.7%(-7.40)#91 | 12.5%(-10.3)#1,418 |
| 92. | Glen Rock Borough | 2.3% | 9.7%(-7.40)#92 | 12.5%(-10.3)#1,426 |
| 93. | Audubon Borough | 2.3% | 9.7%(-7.35)#93 | 12.5%(-10.2)#1,478 |
| 94. | Farmingdale Borough | 2.3% | 9.7%(-7.34)#94 | 12.5%(-10.2)#1,483 |
| 95. | Robertsville | 2.3% | 9.7%(-7.34)#95 | 12.5%(-10.2)#1,489 |
| 96. | Barnegat Light Borough | 2.3% | 9.7%(-7.33)#96 | 12.5%(-10.2)#1,499 |
| 97. | Kinnelon Borough | 2.4% | 9.7%(-7.33)#97 | 12.5%(-10.2)#1,507 |
| 98. | Lyons | 2.4% | 9.7%(-7.33)#98 | 12.5%(-10.2)#1,509 |
| 99. | Clinton | 2.4% | 9.7%(-7.30)#99 | 12.5%(-10.2)#1,531 |
| 100. | Ridgewood | 2.4% | 9.7%(-7.29)#100 | 12.5%(-10.1)#1,542 |
Common Questions
What are the Top 10 Cities with the Lowest Poverty Level in New Jersey?
Top 10 Cities with the Lowest Poverty Level in New Jersey are:
#1
0.18%
#2
0.18%
#3
0.24%
#4
0.43%
#5
0.71%
#6
0.80%
#7
0.89%
#8
0.91%
#9
0.98%
#10
1.2%
What city has the Lowest Poverty Level in New Jersey?
West Belmar has the Lowest Poverty Level in New Jersey with 0.18%.
What is the Poverty Level in the State of New Jersey?
Poverty Level in New Jersey is 9.7%.
What is the Poverty Level in the United States?
Poverty Level in the United States is 12.5%.