Cities with the Largest Peruvian Community in New Jersey
RELATED REPORTS & OPTIONS
Peruvian
New Jersey
Compare Cities
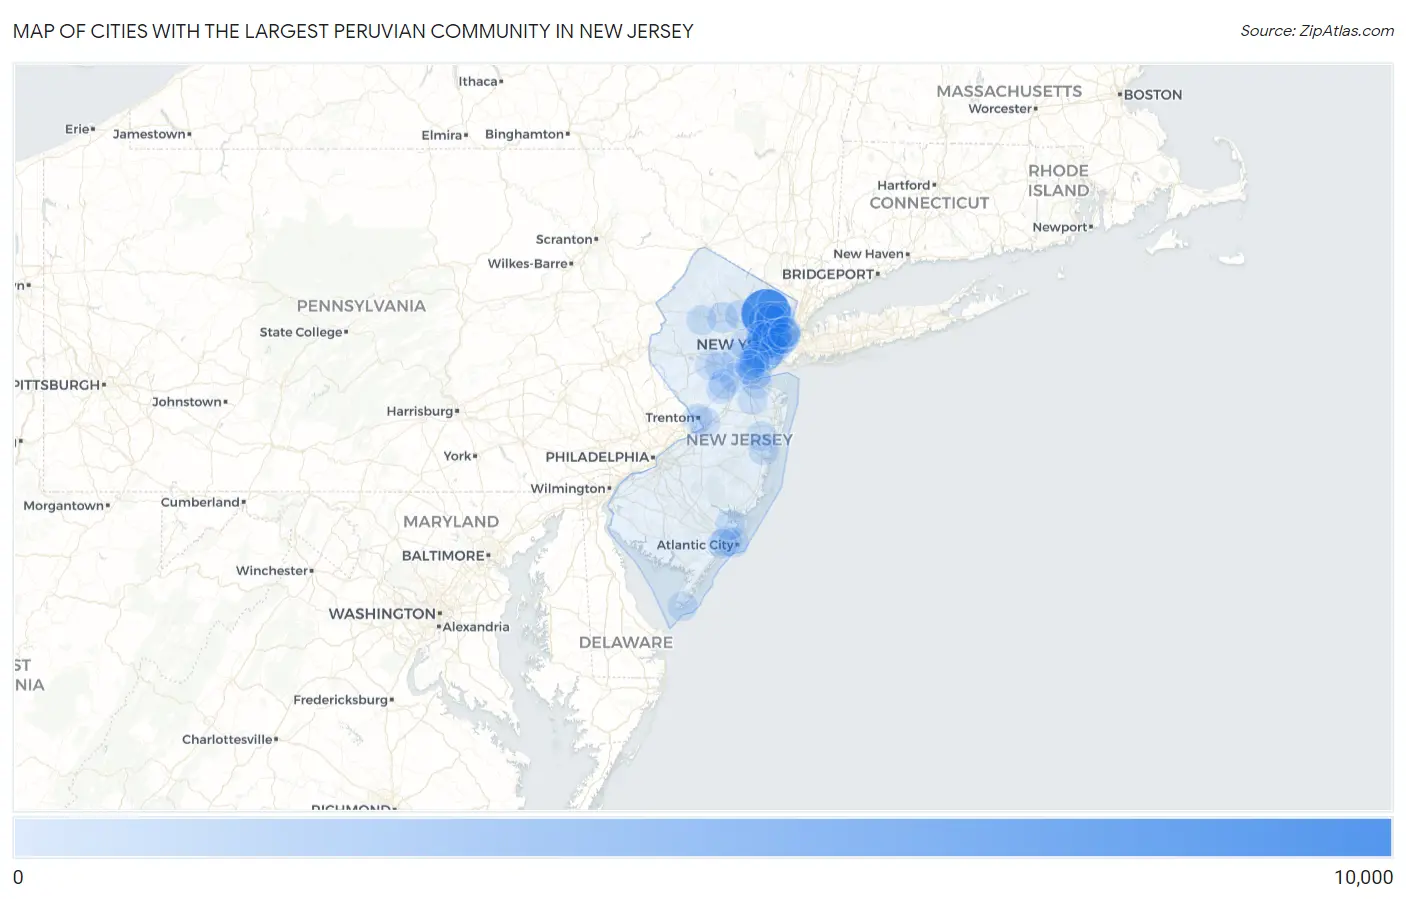
Map of Cities with the Largest Peruvian Community in New Jersey
0
10,000
Cities with the Largest Peruvian Community in New Jersey
| City | Peruvian | vs State | vs National | |
| 1. | Paterson | 9,772 | 86,844(11.25%)#1 | 712,740(1.37%)#3 |
| 2. | Elizabeth | 5,002 | 86,844(5.76%)#2 | 712,740(0.70%)#6 |
| 3. | Clifton | 4,122 | 86,844(4.75%)#3 | 712,740(0.58%)#8 |
| 4. | Kearny | 3,959 | 86,844(4.56%)#4 | 712,740(0.56%)#9 |
| 5. | Newark | 3,068 | 86,844(3.53%)#5 | 712,740(0.43%)#14 |
| 6. | Union City | 2,728 | 86,844(3.14%)#6 | 712,740(0.38%)#20 |
| 7. | Passaic | 2,096 | 86,844(2.41%)#7 | 712,740(0.29%)#26 |
| 8. | Garfield | 1,639 | 86,844(1.89%)#8 | 712,740(0.23%)#45 |
| 9. | Perth Amboy | 1,552 | 86,844(1.79%)#9 | 712,740(0.22%)#47 |
| 10. | Harrison | 1,522 | 86,844(1.75%)#10 | 712,740(0.21%)#51 |
| 11. | Jersey City | 1,145 | 86,844(1.32%)#11 | 712,740(0.16%)#83 |
| 12. | West New York | 1,037 | 86,844(1.19%)#12 | 712,740(0.15%)#92 |
| 13. | Prospect Park Borough | 887 | 86,844(1.02%)#13 | 712,740(0.12%)#111 |
| 14. | Lodi Borough | 801 | 86,844(0.92%)#14 | 712,740(0.11%)#130 |
| 15. | Linden | 720 | 86,844(0.83%)#15 | 712,740(0.10%)#147 |
| 16. | Roselle Park Borough | 701 | 86,844(0.81%)#16 | 712,740(0.10%)#154 |
| 17. | Elmwood Park Borough | 680 | 86,844(0.78%)#17 | 712,740(0.10%)#164 |
| 18. | Haledon Borough | 662 | 86,844(0.76%)#18 | 712,740(0.09%)#173 |
| 19. | Dunellen Borough | 609 | 86,844(0.70%)#19 | 712,740(0.09%)#189 |
| 20. | Hawthorne Borough | 570 | 86,844(0.66%)#20 | 712,740(0.08%)#207 |
| 21. | Rahway | 568 | 86,844(0.65%)#21 | 712,740(0.08%)#208 |
| 22. | North Plainfield Borough | 512 | 86,844(0.59%)#22 | 712,740(0.07%)#237 |
| 23. | Dover | 500 | 86,844(0.58%)#23 | 712,740(0.07%)#242 |
| 24. | Plainfield | 476 | 86,844(0.55%)#24 | 712,740(0.07%)#253 |
| 25. | Carteret Borough | 463 | 86,844(0.53%)#25 | 712,740(0.06%)#265 |
| 26. | Avenel | 457 | 86,844(0.53%)#26 | 712,740(0.06%)#269 |
| 27. | Hackensack | 452 | 86,844(0.52%)#27 | 712,740(0.06%)#274 |
| 28. | Pleasantville | 447 | 86,844(0.51%)#28 | 712,740(0.06%)#278 |
| 29. | Fair Lawn Borough | 415 | 86,844(0.48%)#29 | 712,740(0.06%)#295 |
| 30. | Toms River | 409 | 86,844(0.47%)#30 | 712,740(0.06%)#297 |
| 31. | Highland Park Borough | 409 | 86,844(0.47%)#31 | 712,740(0.06%)#299 |
| 32. | Washington Borough | 391 | 86,844(0.45%)#32 | 712,740(0.05%)#311 |
| 33. | Hopelawn | 357 | 86,844(0.41%)#33 | 712,740(0.05%)#347 |
| 34. | Wallington Borough | 355 | 86,844(0.41%)#34 | 712,740(0.05%)#349 |
| 35. | North Arlington Borough | 354 | 86,844(0.41%)#35 | 712,740(0.05%)#351 |
| 36. | Westwood Borough | 346 | 86,844(0.40%)#36 | 712,740(0.05%)#365 |
| 37. | Bound Brook Borough | 316 | 86,844(0.36%)#37 | 712,740(0.04%)#403 |
| 38. | Woodland Park Borough | 310 | 86,844(0.36%)#38 | 712,740(0.04%)#409 |
| 39. | Watsessing | 305 | 86,844(0.35%)#39 | 712,740(0.04%)#420 |
| 40. | Paramus Borough | 297 | 86,844(0.34%)#40 | 712,740(0.04%)#429 |
| 41. | White Horse | 291 | 86,844(0.34%)#41 | 712,740(0.04%)#438 |
| 42. | Dumont Borough | 274 | 86,844(0.32%)#42 | 712,740(0.04%)#463 |
| 43. | Finderne | 272 | 86,844(0.31%)#43 | 712,740(0.04%)#468 |
| 44. | Lindenwold Borough | 269 | 86,844(0.31%)#44 | 712,740(0.04%)#473 |
| 45. | Somerville Borough | 268 | 86,844(0.31%)#45 | 712,740(0.04%)#475 |
| 46. | Rutherford Borough | 263 | 86,844(0.30%)#46 | 712,740(0.04%)#484 |
| 47. | Bayonne | 258 | 86,844(0.30%)#47 | 712,740(0.04%)#494 |
| 48. | New Brunswick | 255 | 86,844(0.29%)#48 | 712,740(0.04%)#501 |
| 49. | Sayreville Borough | 253 | 86,844(0.29%)#49 | 712,740(0.04%)#502 |
| 50. | Boonton | 249 | 86,844(0.29%)#50 | 712,740(0.03%)#513 |
| 51. | East Newark Borough | 249 | 86,844(0.29%)#51 | 712,740(0.03%)#514 |
| 52. | Budd Lake | 242 | 86,844(0.28%)#52 | 712,740(0.03%)#533 |
| 53. | Leonia Borough | 238 | 86,844(0.27%)#53 | 712,740(0.03%)#540 |
| 54. | Trenton | 229 | 86,844(0.26%)#54 | 712,740(0.03%)#560 |
| 55. | Fairview Borough | 229 | 86,844(0.26%)#55 | 712,740(0.03%)#562 |
| 56. | Roselle Borough | 227 | 86,844(0.26%)#56 | 712,740(0.03%)#571 |
| 57. | Menlo Park Terrace | 227 | 86,844(0.26%)#57 | 712,740(0.03%)#573 |
| 58. | Fords | 225 | 86,844(0.26%)#58 | 712,740(0.03%)#575 |
| 59. | Iselin | 221 | 86,844(0.25%)#59 | 712,740(0.03%)#587 |
| 60. | New Milford Borough | 218 | 86,844(0.25%)#60 | 712,740(0.03%)#594 |
| 61. | Summit | 214 | 86,844(0.25%)#61 | 712,740(0.03%)#601 |
| 62. | East Rutherford Borough | 212 | 86,844(0.24%)#62 | 712,740(0.03%)#606 |
| 63. | Atlantic City | 208 | 86,844(0.24%)#63 | 712,740(0.03%)#618 |
| 64. | Wharton Borough | 207 | 86,844(0.24%)#64 | 712,740(0.03%)#626 |
| 65. | South Plainfield Borough | 203 | 86,844(0.23%)#65 | 712,740(0.03%)#636 |
| 66. | Freehold Borough | 197 | 86,844(0.23%)#66 | 712,740(0.03%)#652 |
| 67. | Bloomingdale Borough | 196 | 86,844(0.23%)#67 | 712,740(0.03%)#656 |
| 68. | Hightstown Borough | 196 | 86,844(0.23%)#68 | 712,740(0.03%)#657 |
| 69. | Franklin Park | 193 | 86,844(0.22%)#69 | 712,740(0.03%)#665 |
| 70. | East Orange | 192 | 86,844(0.22%)#70 | 712,740(0.03%)#667 |
| 71. | Lakewood | 188 | 86,844(0.22%)#71 | 712,740(0.03%)#686 |
| 72. | Laurence Harbor | 186 | 86,844(0.21%)#72 | 712,740(0.03%)#698 |
| 73. | Cape May | 186 | 86,844(0.21%)#73 | 712,740(0.03%)#699 |
| 74. | Lincoln Park Borough | 182 | 86,844(0.21%)#74 | 712,740(0.03%)#710 |
| 75. | Smithville | 179 | 86,844(0.21%)#75 | 712,740(0.03%)#718 |
| 76. | Cliffside Park Borough | 174 | 86,844(0.20%)#76 | 712,740(0.02%)#739 |
| 77. | Secaucus | 173 | 86,844(0.20%)#77 | 712,740(0.02%)#746 |
| 78. | Mountainside Borough | 170 | 86,844(0.20%)#78 | 712,740(0.02%)#758 |
| 79. | Hoboken | 166 | 86,844(0.19%)#79 | 712,740(0.02%)#765 |
| 80. | Hasbrouck Heights Borough | 166 | 86,844(0.19%)#80 | 712,740(0.02%)#770 |
| 81. | Northfield | 165 | 86,844(0.19%)#81 | 712,740(0.02%)#779 |
| 82. | Hillsdale Borough | 164 | 86,844(0.19%)#82 | 712,740(0.02%)#782 |
| 83. | Matawan Borough | 164 | 86,844(0.19%)#83 | 712,740(0.02%)#783 |
| 84. | Guttenberg | 160 | 86,844(0.18%)#84 | 712,740(0.02%)#790 |
| 85. | Seaside Heights Borough | 160 | 86,844(0.18%)#85 | 712,740(0.02%)#791 |
| 86. | Middlesex Borough | 156 | 86,844(0.18%)#86 | 712,740(0.02%)#803 |
| 87. | Hopatcong Borough | 153 | 86,844(0.18%)#87 | 712,740(0.02%)#816 |
| 88. | Park Ridge Borough | 153 | 86,844(0.18%)#88 | 712,740(0.02%)#818 |
| 89. | Wanaque Borough | 150 | 86,844(0.17%)#89 | 712,740(0.02%)#834 |
| 90. | Kendall Park | 146 | 86,844(0.17%)#90 | 712,740(0.02%)#854 |
| 91. | Robertsville | 144 | 86,844(0.17%)#91 | 712,740(0.02%)#863 |
| 92. | Metuchen Borough | 142 | 86,844(0.16%)#92 | 712,740(0.02%)#881 |
| 93. | Parsippany | 137 | 86,844(0.16%)#93 | 712,740(0.02%)#911 |
| 94. | Bergenfield Borough | 136 | 86,844(0.16%)#94 | 712,740(0.02%)#916 |
| 95. | Preakness | 135 | 86,844(0.16%)#95 | 712,740(0.02%)#928 |
| 96. | Ridgewood | 133 | 86,844(0.15%)#96 | 712,740(0.02%)#935 |
| 97. | Bradley Gardens | 131 | 86,844(0.15%)#97 | 712,740(0.02%)#946 |
| 98. | Waldwick Borough | 131 | 86,844(0.15%)#98 | 712,740(0.02%)#947 |
| 99. | Silver Lake Cdp Essex County | 126 | 86,844(0.15%)#99 | 712,740(0.02%)#980 |
| 100. | Glen Ridge Borough | 110 | 86,844(0.13%)#100 | 712,740(0.02%)#1,076 |
Common Questions
What are the Top 10 Cities with the Largest Peruvian Community in New Jersey?
Top 10 Cities with the Largest Peruvian Community in New Jersey are:
#1
9,772
#2
5,002
#3
4,122
#4
3,959
#5
3,068
#6
2,728
#7
2,096
#8
1,639
#9
1,552
#10
1,522
What city has the Largest Peruvian Community in New Jersey?
Paterson has the Largest Peruvian Community in New Jersey with 9,772.
What is the Total Peruvian Population in the State of New Jersey?
Total Peruvian Population in New Jersey is 86,844.
What is the Total Peruvian Population in the United States?
Total Peruvian Population in the United States is 712,740.