Cities with the Most Immigrants from Canada in New Jersey
RELATED REPORTS & OPTIONS
Canada
New Jersey
Compare Cities
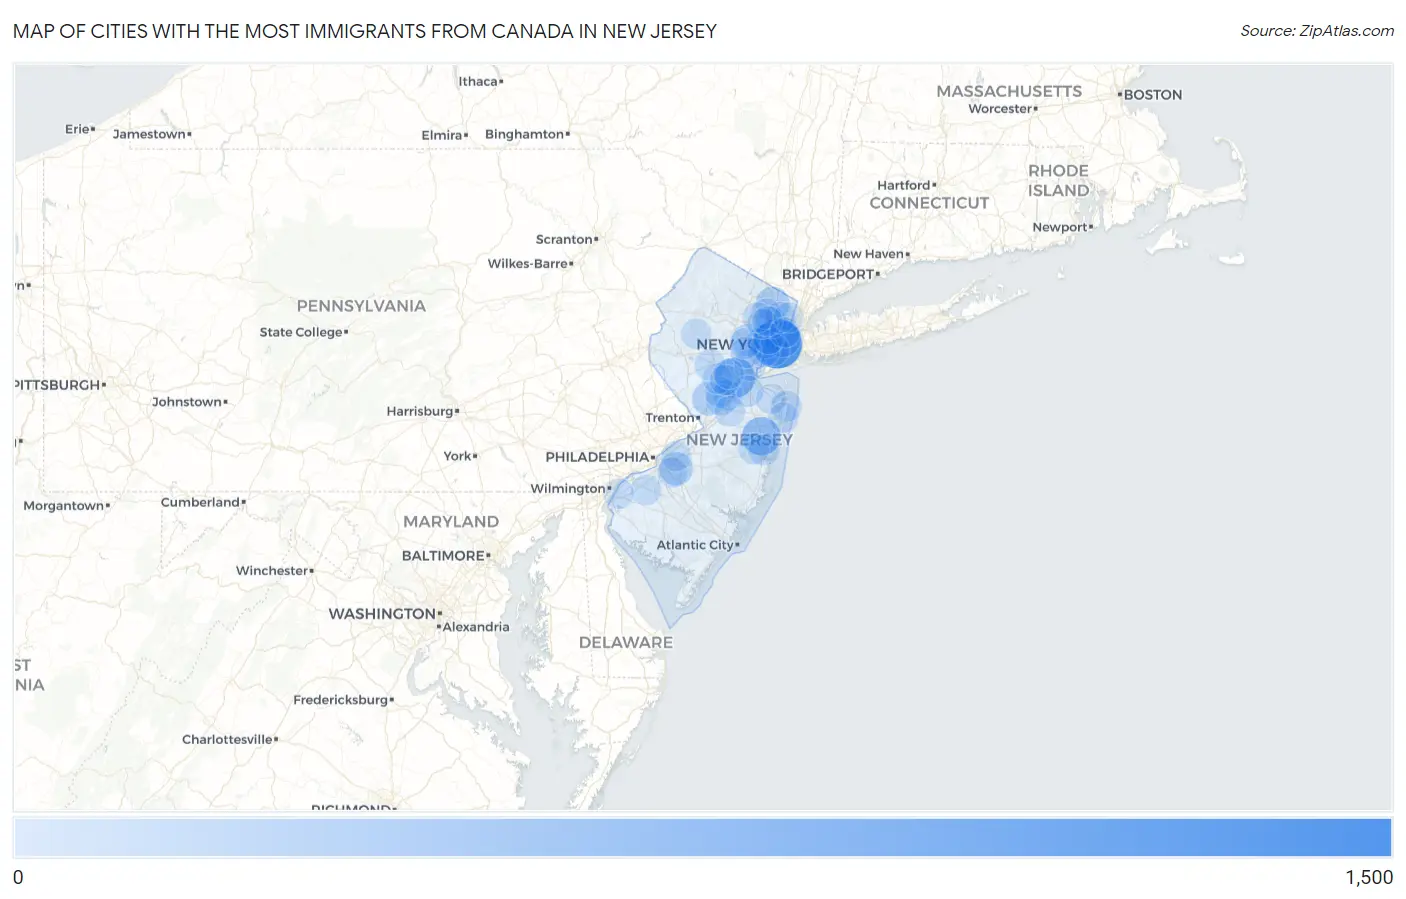
Map of Cities with the Most Immigrants from Canada in New Jersey
0
1,500
Cities with the Most Immigrants from Canada in New Jersey
| City | Canada | vs State | vs National | |
| 1. | Jersey City | 1,141 | 18,317(6.23%)#1 | 821,792(0.14%)#56 |
| 2. | Rutgers University-Busch Campus | 629 | 18,317(3.43%)#2 | 821,792(0.08%)#153 |
| 3. | New Brunswick | 583 | 18,317(3.18%)#3 | 821,792(0.07%)#169 |
| 4. | Lakewood | 498 | 18,317(2.72%)#4 | 821,792(0.06%)#212 |
| 5. | Hoboken | 397 | 18,317(2.17%)#5 | 821,792(0.05%)#291 |
| 6. | Rutgers University-Livingston Campus | 391 | 18,317(2.13%)#6 | 821,792(0.05%)#297 |
| 7. | Newark | 246 | 18,317(1.34%)#7 | 821,792(0.03%)#517 |
| 8. | Ridgewood | 244 | 18,317(1.33%)#8 | 821,792(0.03%)#522 |
| 9. | Princeton | 211 | 18,317(1.15%)#9 | 821,792(0.03%)#619 |
| 10. | Springdale | 208 | 18,317(1.14%)#10 | 821,792(0.03%)#630 |
| 11. | Pitman Borough | 182 | 18,317(0.99%)#11 | 821,792(0.02%)#717 |
| 12. | Highland Park Borough | 154 | 18,317(0.84%)#12 | 821,792(0.02%)#842 |
| 13. | Passaic | 119 | 18,317(0.65%)#13 | 821,792(0.01%)#1,073 |
| 14. | Short Hills | 113 | 18,317(0.62%)#14 | 821,792(0.01%)#1,138 |
| 15. | Iselin | 109 | 18,317(0.60%)#15 | 821,792(0.01%)#1,167 |
| 16. | Bayonne | 106 | 18,317(0.58%)#16 | 821,792(0.01%)#1,204 |
| 17. | Elizabeth | 104 | 18,317(0.57%)#17 | 821,792(0.01%)#1,222 |
| 18. | Old Bridge | 104 | 18,317(0.57%)#18 | 821,792(0.01%)#1,224 |
| 19. | Fort Lee Borough | 102 | 18,317(0.56%)#19 | 821,792(0.01%)#1,243 |
| 20. | Parsippany | 89 | 18,317(0.49%)#20 | 821,792(0.01%)#1,393 |
| 21. | Westfield | 87 | 18,317(0.47%)#21 | 821,792(0.01%)#1,422 |
| 22. | Hackensack | 84 | 18,317(0.46%)#22 | 821,792(0.01%)#1,461 |
| 23. | Bloomingdale Borough | 79 | 18,317(0.43%)#23 | 821,792(0.01%)#1,553 |
| 24. | Leisure Village West | 79 | 18,317(0.43%)#24 | 821,792(0.01%)#1,555 |
| 25. | Toms River | 76 | 18,317(0.41%)#25 | 821,792(0.01%)#1,590 |
| 26. | Pompton Plains | 76 | 18,317(0.41%)#26 | 821,792(0.01%)#1,603 |
| 27. | Summit | 75 | 18,317(0.41%)#27 | 821,792(0.01%)#1,613 |
| 28. | Long Branch | 74 | 18,317(0.40%)#28 | 821,792(0.01%)#1,621 |
| 29. | Watchung Borough | 74 | 18,317(0.40%)#29 | 821,792(0.01%)#1,633 |
| 30. | Ledgewood | 73 | 18,317(0.40%)#30 | 821,792(0.01%)#1,654 |
| 31. | Red Bank Borough | 72 | 18,317(0.39%)#31 | 821,792(0.01%)#1,666 |
| 32. | Haddonfield Borough | 71 | 18,317(0.39%)#32 | 821,792(0.01%)#1,684 |
| 33. | Bergenfield Borough | 70 | 18,317(0.38%)#33 | 821,792(0.01%)#1,696 |
| 34. | Bradley Gardens | 70 | 18,317(0.38%)#34 | 821,792(0.01%)#1,703 |
| 35. | Cliffside Park Borough | 69 | 18,317(0.38%)#35 | 821,792(0.01%)#1,712 |
| 36. | Chatham Borough | 69 | 18,317(0.38%)#36 | 821,792(0.01%)#1,722 |
| 37. | Fair Haven Borough | 68 | 18,317(0.37%)#37 | 821,792(0.01%)#1,747 |
| 38. | Harrison | 65 | 18,317(0.35%)#38 | 821,792(0.01%)#1,800 |
| 39. | Eatontown Borough | 63 | 18,317(0.34%)#39 | 821,792(0.01%)#1,837 |
| 40. | Dayton | 63 | 18,317(0.34%)#40 | 821,792(0.01%)#1,839 |
| 41. | Sicklerville | 60 | 18,317(0.33%)#41 | 821,792(0.01%)#1,902 |
| 42. | Raritan Borough | 60 | 18,317(0.33%)#42 | 821,792(0.01%)#1,910 |
| 43. | Princeton Meadows | 58 | 18,317(0.32%)#43 | 821,792(0.01%)#1,943 |
| 44. | The Hills | 58 | 18,317(0.32%)#44 | 821,792(0.01%)#1,945 |
| 45. | Bogota Borough | 57 | 18,317(0.31%)#45 | 821,792(0.01%)#1,970 |
| 46. | Mullica Hill | 57 | 18,317(0.31%)#46 | 821,792(0.01%)#1,978 |
| 47. | Glen Ridge Borough | 56 | 18,317(0.31%)#47 | 821,792(0.01%)#2,002 |
| 48. | Oakland Borough | 54 | 18,317(0.29%)#48 | 821,792(0.01%)#2,041 |
| 49. | Mendham Borough | 54 | 18,317(0.29%)#49 | 821,792(0.01%)#2,052 |
| 50. | Waldwick Borough | 53 | 18,317(0.29%)#50 | 821,792(0.01%)#2,079 |
| 51. | Heathcote | 52 | 18,317(0.28%)#51 | 821,792(0.01%)#2,118 |
| 52. | Rockaway Borough | 52 | 18,317(0.28%)#52 | 821,792(0.01%)#2,120 |
| 53. | Florham Park Borough | 51 | 18,317(0.28%)#53 | 821,792(0.01%)#2,134 |
| 54. | Blackwells Mills | 51 | 18,317(0.28%)#54 | 821,792(0.01%)#2,136 |
| 55. | Twin Rivers | 50 | 18,317(0.27%)#55 | 821,792(0.01%)#2,172 |
| 56. | Caldwell Borough | 47 | 18,317(0.26%)#56 | 821,792(0.01%)#2,253 |
| 57. | Fair Lawn Borough | 46 | 18,317(0.25%)#57 | 821,792(0.01%)#2,271 |
| 58. | Paterson | 45 | 18,317(0.25%)#58 | 821,792(0.01%)#2,313 |
| 59. | Somerville Borough | 45 | 18,317(0.25%)#59 | 821,792(0.01%)#2,333 |
| 60. | Six Mile Run | 44 | 18,317(0.24%)#60 | 821,792(0.01%)#2,392 |
| 61. | Tenafly Borough | 43 | 18,317(0.23%)#61 | 821,792(0.01%)#2,413 |
| 62. | Collingswood Borough | 43 | 18,317(0.23%)#62 | 821,792(0.01%)#2,414 |
| 63. | Glen Rock Borough | 43 | 18,317(0.23%)#63 | 821,792(0.01%)#2,415 |
| 64. | Ringwood Borough | 43 | 18,317(0.23%)#64 | 821,792(0.01%)#2,416 |
| 65. | Clearbrook | 43 | 18,317(0.23%)#65 | 821,792(0.01%)#2,434 |
| 66. | Hillsborough | 42 | 18,317(0.23%)#66 | 821,792(0.01%)#2,444 |
| 67. | Elmwood Park Borough | 42 | 18,317(0.23%)#67 | 821,792(0.01%)#2,446 |
| 68. | Madison Borough | 42 | 18,317(0.23%)#68 | 821,792(0.01%)#2,451 |
| 69. | New Providence Borough | 40 | 18,317(0.22%)#69 | 821,792(0.00%)#2,535 |
| 70. | Long Valley | 39 | 18,317(0.21%)#70 | 821,792(0.00%)#2,599 |
| 71. | Paramus Borough | 38 | 18,317(0.21%)#71 | 821,792(0.00%)#2,607 |
| 72. | Upper Montclair | 38 | 18,317(0.21%)#72 | 821,792(0.00%)#2,618 |
| 73. | Highlands Borough | 38 | 18,317(0.21%)#73 | 821,792(0.00%)#2,633 |
| 74. | Englewood | 37 | 18,317(0.20%)#74 | 821,792(0.00%)#2,653 |
| 75. | Somerset | 37 | 18,317(0.20%)#75 | 821,792(0.00%)#2,657 |
| 76. | Milltown Borough | 37 | 18,317(0.20%)#76 | 821,792(0.00%)#2,677 |
| 77. | Stratford Borough | 37 | 18,317(0.20%)#77 | 821,792(0.00%)#2,678 |
| 78. | Lincroft | 37 | 18,317(0.20%)#78 | 821,792(0.00%)#2,680 |
| 79. | Peapack And Gladstone Borough | 36 | 18,317(0.20%)#79 | 821,792(0.00%)#2,741 |
| 80. | Echelon | 35 | 18,317(0.19%)#80 | 821,792(0.00%)#2,764 |
| 81. | Franklin Lakes Borough | 35 | 18,317(0.19%)#81 | 821,792(0.00%)#2,769 |
| 82. | Carneys Point | 35 | 18,317(0.19%)#82 | 821,792(0.00%)#2,775 |
| 83. | Penns Grove Borough | 35 | 18,317(0.19%)#83 | 821,792(0.00%)#2,781 |
| 84. | Asbury Park | 33 | 18,317(0.18%)#84 | 821,792(0.00%)#2,872 |
| 85. | Fairview Borough | 33 | 18,317(0.18%)#85 | 821,792(0.00%)#2,874 |
| 86. | Singac | 33 | 18,317(0.18%)#86 | 821,792(0.00%)#2,899 |
| 87. | Allentown Borough | 33 | 18,317(0.18%)#87 | 821,792(0.00%)#2,907 |
| 88. | Clifton | 32 | 18,317(0.17%)#88 | 821,792(0.00%)#2,914 |
| 89. | Moorestown Lenola | 32 | 18,317(0.17%)#89 | 821,792(0.00%)#2,937 |
| 90. | Cream Ridge | 32 | 18,317(0.17%)#90 | 821,792(0.00%)#2,973 |
| 91. | Robbinsville Center | 31 | 18,317(0.17%)#91 | 821,792(0.00%)#3,022 |
| 92. | Lindenwold Borough | 30 | 18,317(0.16%)#92 | 821,792(0.00%)#3,052 |
| 93. | Leonia Borough | 30 | 18,317(0.16%)#93 | 821,792(0.00%)#3,070 |
| 94. | Washington Borough | 30 | 18,317(0.16%)#94 | 821,792(0.00%)#3,072 |
| 95. | Sayreville Borough | 29 | 18,317(0.16%)#95 | 821,792(0.00%)#3,089 |
| 96. | Upper Saddle River Borough | 29 | 18,317(0.16%)#96 | 821,792(0.00%)#3,120 |
| 97. | Cresskill Borough | 28 | 18,317(0.15%)#97 | 821,792(0.00%)#3,174 |
| 98. | Stockton University | 28 | 18,317(0.15%)#98 | 821,792(0.00%)#3,199 |
| 99. | West New York | 27 | 18,317(0.15%)#99 | 821,792(0.00%)#3,211 |
| 100. | North Plainfield Borough | 27 | 18,317(0.15%)#100 | 821,792(0.00%)#3,222 |
Common Questions
What are the Top 10 Cities with the Most Immigrants from Canada in New Jersey?
Top 10 Cities with the Most Immigrants from Canada in New Jersey are:
#1
1,141
#2
583
#3
498
#4
397
#5
246
#6
244
#7
211
#8
208
#9
119
#10
113
What city has the Most Immigrants from Canada in New Jersey?
Jersey City has the Most Immigrants from Canada in New Jersey with 1,141.
What is the Total Immigrants from Canada in the State of New Jersey?
Total Immigrants from Canada in New Jersey is 18,317.
What is the Total Immigrants from Canada in the United States?
Total Immigrants from Canada in the United States is 821,792.