Cities with the Highest Percentage of Immigrants from Western Asia in New Jersey
RELATED REPORTS & OPTIONS
Western Asia
New Jersey
Compare Cities
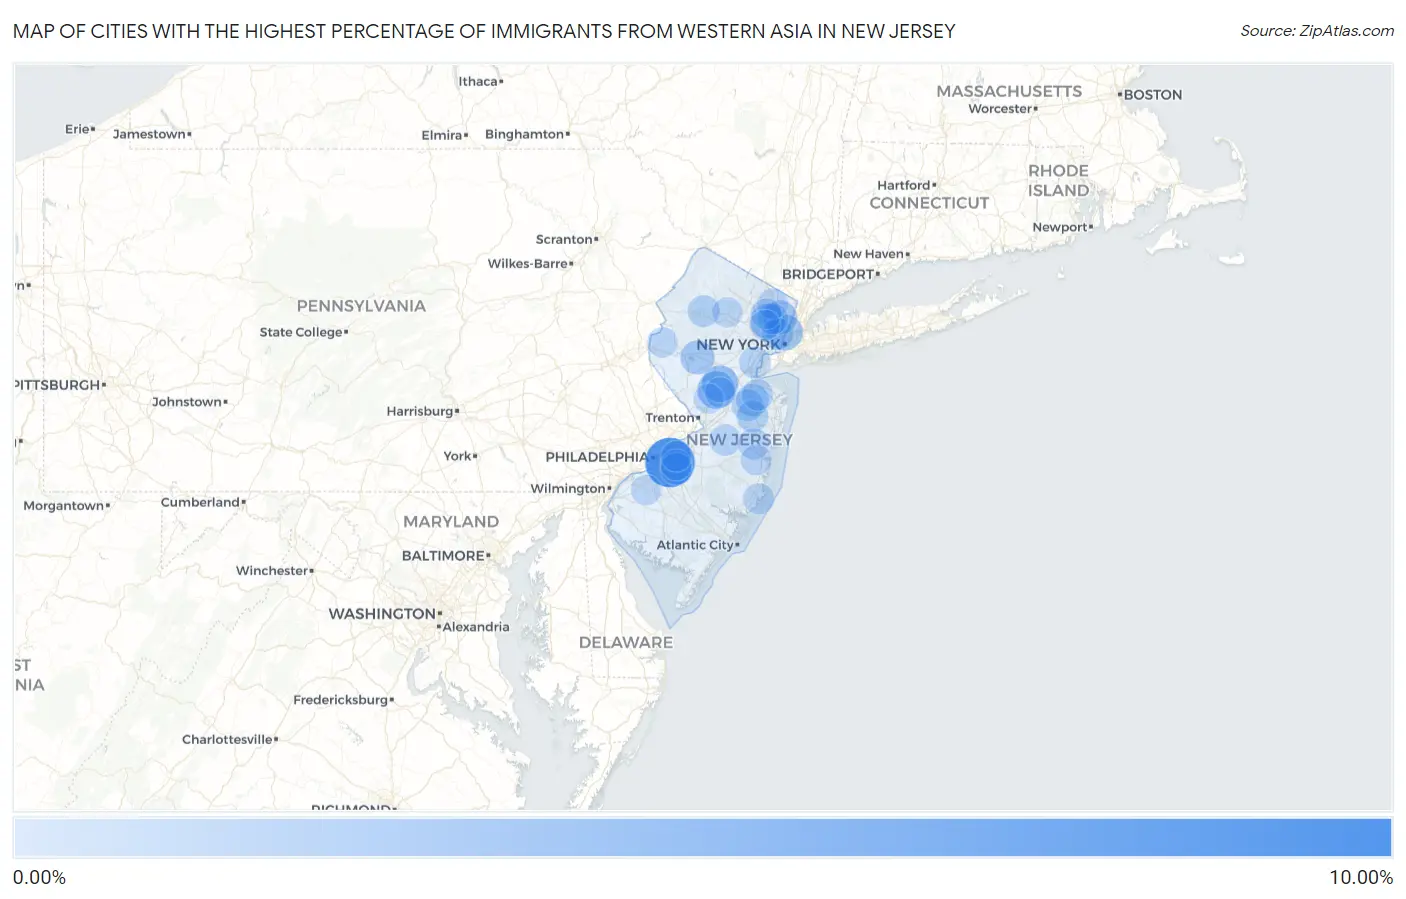
Map of Cities with the Highest Percentage of Immigrants from Western Asia in New Jersey
0.00%
10.00%
Cities with the Highest Percentage of Immigrants from Western Asia in New Jersey
| City | Western Asia | vs State | vs National | |
| 1. | Ellisburg | 9.11% | 0.60%(+8.52)#-1 | 0.36%(+8.75)#0 |
| 2. | Cresskill Borough | 8.34% | 0.60%(+7.74)#0 | 0.36%(+7.97)#1 |
| 3. | Tavistock Borough | 8.33% | 0.60%(+7.74)#1 | 0.36%(+7.97)#2 |
| 4. | Demarest Borough | 7.91% | 0.60%(+7.31)#2 | 0.36%(+7.55)#3 |
| 5. | Teterboro Borough | 7.69% | 0.60%(+7.10)#3 | 0.36%(+7.33)#4 |
| 6. | Woodland Park Borough | 7.06% | 0.60%(+6.47)#4 | 0.36%(+6.70)#5 |
| 7. | Deal Borough | 4.50% | 0.60%(+3.90)#5 | 0.36%(+4.13)#6 |
| 8. | Preakness | 4.34% | 0.60%(+3.74)#6 | 0.36%(+3.97)#7 |
| 9. | East Rocky Hill | 3.89% | 0.60%(+3.30)#7 | 0.36%(+3.53)#8 |
| 10. | Tenafly Borough | 3.65% | 0.60%(+3.05)#8 | 0.36%(+3.28)#9 |
| 11. | Pleasant Plains | 3.62% | 0.60%(+3.02)#9 | 0.36%(+3.26)#10 |
| 12. | Pines Lake | 3.59% | 0.60%(+3.00)#10 | 0.36%(+3.23)#11 |
| 13. | Washington Borough | 3.58% | 0.60%(+2.98)#11 | 0.36%(+3.21)#12 |
| 14. | Guttenberg | 3.29% | 0.60%(+2.69)#12 | 0.36%(+2.93)#13 |
| 15. | Riverdale Borough | 3.19% | 0.60%(+2.59)#13 | 0.36%(+2.82)#14 |
| 16. | Saddle River Borough | 3.18% | 0.60%(+2.59)#14 | 0.36%(+2.82)#15 |
| 17. | East Rutherford Borough | 3.12% | 0.60%(+2.53)#15 | 0.36%(+2.76)#16 |
| 18. | Closter Borough | 3.00% | 0.60%(+2.41)#16 | 0.36%(+2.64)#17 |
| 19. | Cliffside Park Borough | 3.00% | 0.60%(+2.41)#17 | 0.36%(+2.64)#18 |
| 20. | Paramus Borough | 2.94% | 0.60%(+2.35)#18 | 0.36%(+2.58)#19 |
| 21. | Englewood Cliffs Borough | 2.90% | 0.60%(+2.30)#19 | 0.36%(+2.54)#20 |
| 22. | Fort Lee Borough | 2.87% | 0.60%(+2.28)#20 | 0.36%(+2.51)#21 |
| 23. | Clifton | 2.87% | 0.60%(+2.27)#21 | 0.36%(+2.51)#22 |
| 24. | Franklin Lakes Borough | 2.83% | 0.60%(+2.23)#22 | 0.36%(+2.46)#23 |
| 25. | Clearbrook | 2.76% | 0.60%(+2.17)#23 | 0.36%(+2.40)#24 |
| 26. | Bloomingdale Borough | 2.76% | 0.60%(+2.16)#24 | 0.36%(+2.39)#25 |
| 27. | Jamesburg Borough | 2.70% | 0.60%(+2.10)#25 | 0.36%(+2.33)#26 |
| 28. | Totowa Borough | 2.60% | 0.60%(+2.00)#26 | 0.36%(+2.23)#27 |
| 29. | Hackensack | 2.60% | 0.60%(+2.00)#27 | 0.36%(+2.23)#28 |
| 30. | White House Station | 2.53% | 0.60%(+1.94)#28 | 0.36%(+2.17)#29 |
| 31. | Fair Lawn Borough | 2.49% | 0.60%(+1.90)#29 | 0.36%(+2.13)#30 |
| 32. | New Milford Borough | 2.41% | 0.60%(+1.81)#30 | 0.36%(+2.05)#31 |
| 33. | Milltown Borough | 2.37% | 0.60%(+1.77)#31 | 0.36%(+2.00)#32 |
| 34. | Paulsboro Borough | 2.36% | 0.60%(+1.76)#32 | 0.36%(+1.99)#33 |
| 35. | North Caldwell Borough | 2.34% | 0.60%(+1.74)#33 | 0.36%(+1.98)#34 |
| 36. | Glen Rock Borough | 2.33% | 0.60%(+1.73)#34 | 0.36%(+1.96)#35 |
| 37. | Leonia Borough | 2.22% | 0.60%(+1.63)#35 | 0.36%(+1.86)#36 |
| 38. | Prospect Park Borough | 2.21% | 0.60%(+1.61)#36 | 0.36%(+1.84)#37 |
| 39. | Rockleigh Borough | 2.12% | 0.60%(+1.52)#37 | 0.36%(+1.75)#38 |
| 40. | Edgewater Borough | 2.11% | 0.60%(+1.51)#38 | 0.36%(+1.74)#39 |
| 41. | Keansburg Borough | 2.05% | 0.60%(+1.45)#39 | 0.36%(+1.69)#40 |
| 42. | Pleasantdale | 2.03% | 0.60%(+1.44)#40 | 0.36%(+1.67)#41 |
| 43. | Hillsborough | 1.97% | 0.60%(+1.38)#41 | 0.36%(+1.61)#42 |
| 44. | Robertsville | 1.94% | 0.60%(+1.34)#42 | 0.36%(+1.57)#43 |
| 45. | North Arlington Borough | 1.91% | 0.60%(+1.32)#43 | 0.36%(+1.55)#44 |
| 46. | Renaissance At Monroe | 1.88% | 0.60%(+1.29)#44 | 0.36%(+1.52)#45 |
| 47. | Alpine Borough | 1.79% | 0.60%(+1.20)#45 | 0.36%(+1.43)#46 |
| 48. | Byram Center | 1.73% | 0.60%(+1.13)#46 | 0.36%(+1.36)#47 |
| 49. | Elmwood Park Borough | 1.72% | 0.60%(+1.13)#47 | 0.36%(+1.36)#48 |
| 50. | Ridgefield Borough | 1.71% | 0.60%(+1.11)#48 | 0.36%(+1.35)#49 |
| 51. | Yorketown | 1.68% | 0.60%(+1.08)#49 | 0.36%(+1.32)#50 |
| 52. | Carlls Corner | 1.68% | 0.60%(+1.08)#50 | 0.36%(+1.31)#51 |
| 53. | Springdale | 1.67% | 0.60%(+1.08)#51 | 0.36%(+1.31)#52 |
| 54. | The Ponds | 1.64% | 0.60%(+1.04)#52 | 0.36%(+1.27)#53 |
| 55. | West Freehold | 1.63% | 0.60%(+1.04)#53 | 0.36%(+1.27)#54 |
| 56. | Secaucus | 1.56% | 0.60%(+0.965)#54 | 0.36%(+1.20)#55 |
| 57. | Avenel | 1.54% | 0.60%(+0.944)#55 | 0.36%(+1.18)#56 |
| 58. | Stirling | 1.50% | 0.60%(+0.902)#56 | 0.36%(+1.13)#57 |
| 59. | Morganville | 1.49% | 0.60%(+0.899)#57 | 0.36%(+1.13)#58 |
| 60. | Lebanon Borough | 1.45% | 0.60%(+0.853)#58 | 0.36%(+1.08)#59 |
| 61. | West Berlin | 1.44% | 0.60%(+0.845)#59 | 0.36%(+1.08)#60 |
| 62. | Carlstadt Borough | 1.44% | 0.60%(+0.839)#60 | 0.36%(+1.07)#61 |
| 63. | New Egypt | 1.42% | 0.60%(+0.822)#61 | 0.36%(+1.05)#62 |
| 64. | Maywood Borough | 1.41% | 0.60%(+0.819)#62 | 0.36%(+1.05)#63 |
| 65. | Garfield | 1.37% | 0.60%(+0.778)#63 | 0.36%(+1.01)#64 |
| 66. | Fieldsboro Borough | 1.37% | 0.60%(+0.770)#64 | 0.36%(+1.00)#65 |
| 67. | Cedar Glen West | 1.36% | 0.60%(+0.761)#65 | 0.36%(+0.993)#66 |
| 68. | Hawthorne Borough | 1.34% | 0.60%(+0.746)#66 | 0.36%(+0.978)#67 |
| 69. | Far Hills Borough | 1.34% | 0.60%(+0.741)#67 | 0.36%(+0.973)#68 |
| 70. | Dumont Borough | 1.33% | 0.60%(+0.731)#68 | 0.36%(+0.963)#69 |
| 71. | Gibbsboro Borough | 1.32% | 0.60%(+0.721)#69 | 0.36%(+0.953)#70 |
| 72. | Beach Haven West | 1.28% | 0.60%(+0.685)#70 | 0.36%(+0.917)#71 |
| 73. | Mount Hope | 1.26% | 0.60%(+0.666)#71 | 0.36%(+0.898)#72 |
| 74. | Greentree | 1.23% | 0.60%(+0.639)#72 | 0.36%(+0.871)#73 |
| 75. | Hasbrouck Heights Borough | 1.23% | 0.60%(+0.638)#73 | 0.36%(+0.870)#74 |
| 76. | Park Ridge Borough | 1.21% | 0.60%(+0.613)#74 | 0.36%(+0.845)#75 |
| 77. | Oradell Borough | 1.21% | 0.60%(+0.610)#75 | 0.36%(+0.842)#76 |
| 78. | Ridgewood | 1.18% | 0.60%(+0.583)#76 | 0.36%(+0.815)#77 |
| 79. | Holiday Heights | 1.17% | 0.60%(+0.576)#77 | 0.36%(+0.808)#78 |
| 80. | Great Notch | 1.14% | 0.60%(+0.549)#78 | 0.36%(+0.781)#79 |
| 81. | Paterson | 1.14% | 0.60%(+0.549)#79 | 0.36%(+0.781)#80 |
| 82. | Seaside Heights Borough | 1.13% | 0.60%(+0.539)#80 | 0.36%(+0.771)#81 |
| 83. | Moorestown Lenola | 1.13% | 0.60%(+0.538)#81 | 0.36%(+0.770)#82 |
| 84. | Bradley Beach Borough | 1.10% | 0.60%(+0.505)#82 | 0.36%(+0.738)#83 |
| 85. | Mullica Hill | 1.10% | 0.60%(+0.504)#83 | 0.36%(+0.736)#84 |
| 86. | Troy Hills | 1.09% | 0.60%(+0.499)#84 | 0.36%(+0.731)#85 |
| 87. | Fairview Borough | 1.09% | 0.60%(+0.496)#85 | 0.36%(+0.728)#86 |
| 88. | Rutherford Borough | 1.09% | 0.60%(+0.492)#86 | 0.36%(+0.724)#87 |
| 89. | Cedar Knolls | 1.08% | 0.60%(+0.481)#87 | 0.36%(+0.713)#88 |
| 90. | Heathcote | 1.06% | 0.60%(+0.467)#88 | 0.36%(+0.699)#89 |
| 91. | North Haledon Borough | 1.06% | 0.60%(+0.461)#89 | 0.36%(+0.693)#90 |
| 92. | New Village | 1.05% | 0.60%(+0.459)#90 | 0.36%(+0.691)#91 |
| 93. | Brookdale | 1.05% | 0.60%(+0.452)#91 | 0.36%(+0.684)#92 |
| 94. | Upper Saddle River Borough | 1.03% | 0.60%(+0.439)#92 | 0.36%(+0.671)#93 |
| 95. | Stonebridge | 1.03% | 0.60%(+0.433)#93 | 0.36%(+0.665)#94 |
| 96. | Victory Gardens Borough | 1.02% | 0.60%(+0.426)#94 | 0.36%(+0.658)#95 |
| 97. | Macopin | 1.02% | 0.60%(+0.420)#95 | 0.36%(+0.652)#96 |
| 98. | White Meadow Lake | 1.00% | 0.60%(+0.402)#96 | 0.36%(+0.634)#97 |
| 99. | Westwood Borough | 1.00% | 0.60%(+0.401)#97 | 0.36%(+0.633)#98 |
| 100. | Princeton | 0.98% | 0.60%(+0.383)#98 | 0.36%(+0.615)#99 |
Common Questions
What are the Top 10 Cities with the Highest Percentage of Immigrants from Western Asia in New Jersey?
Top 10 Cities with the Highest Percentage of Immigrants from Western Asia in New Jersey are:
#1
9.11%
#2
3.89%
#3
3.62%
#4
3.29%
#5
2.87%
#6
2.60%
#7
2.53%
#8
1.94%
#9
1.73%
#10
1.68%
What city has the Highest Percentage of Immigrants from Western Asia in New Jersey?
Ellisburg has the Highest Percentage of Immigrants from Western Asia in New Jersey with 9.11%.
What is the Percentage of Immigrants from Western Asia in the State of New Jersey?
Percentage of Immigrants from Western Asia in New Jersey is 0.60%.
What is the Percentage of Immigrants from Western Asia in the United States?
Percentage of Immigrants from Western Asia in the United States is 0.36%.