Cities with the Highest Percentage of Households With Three or more Vehicles in New Jersey
RELATED REPORTS & OPTIONS
Households with 3 or more Cars
New Jersey
Compare Cities
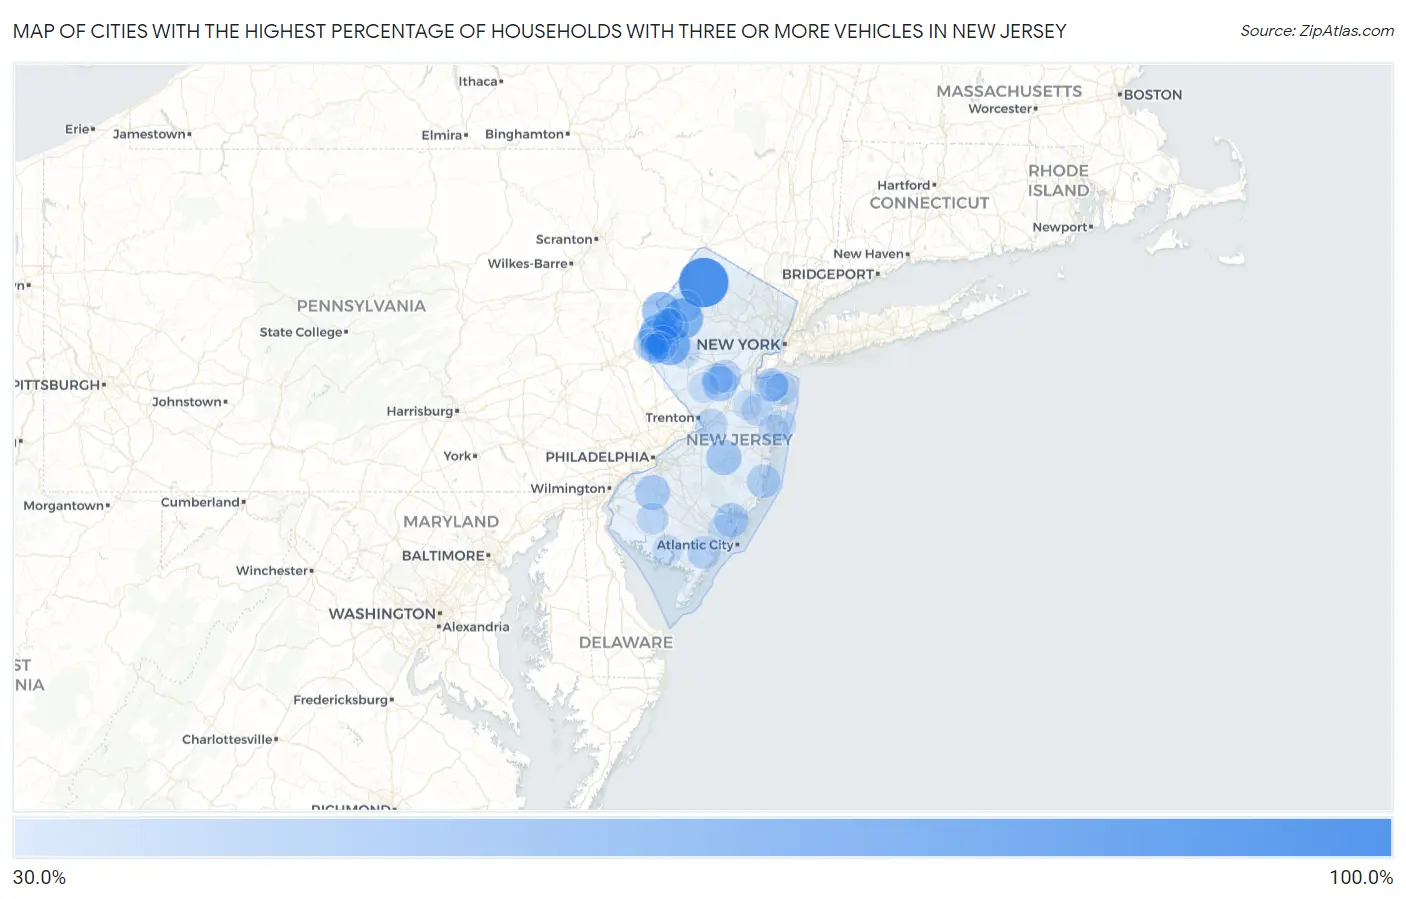
Map of Cities with the Highest Percentage of Households With Three or more Vehicles in New Jersey
0.0%
100.0%
Cities with the Highest Percentage of Households With Three or more Vehicles in New Jersey
| City | Housholds With 3+ Cars | vs State | vs National | |
| 1. | Lamington | 100.0% | 25.8%(+74.2)#1 | 29.0%(+71.0)#74 |
| 2. | Ross Corner | 100.0% | 25.8%(+74.2)#2 | 29.0%(+71.0)#203 |
| 3. | Great Meadows | 72.4% | 25.8%(+46.6)#3 | 29.0%(+43.4)#821 |
| 4. | Germania | 71.0% | 25.8%(+45.2)#4 | 29.0%(+42.0)#859 |
| 5. | Asbury | 70.7% | 25.8%(+44.9)#5 | 29.0%(+41.7)#867 |
| 6. | Connecticut Farms | 70.6% | 25.8%(+44.8)#6 | 29.0%(+41.6)#868 |
| 7. | Bridgeport | 68.9% | 25.8%(+43.1)#7 | 29.0%(+39.9)#937 |
| 8. | Delmont | 67.2% | 25.8%(+41.4)#8 | 29.0%(+38.2)#1,032 |
| 9. | Hutchinson | 64.7% | 25.8%(+38.9)#9 | 29.0%(+35.7)#1,202 |
| 10. | Columbia | 63.9% | 25.8%(+38.1)#10 | 29.0%(+34.9)#1,259 |
| 11. | Grenloch | 61.9% | 25.8%(+36.1)#11 | 29.0%(+32.9)#1,420 |
| 12. | Roadstown | 57.8% | 25.8%(+32.0)#12 | 29.0%(+28.8)#1,901 |
| 13. | Dennisville | 57.4% | 25.8%(+31.6)#13 | 29.0%(+28.4)#1,942 |
| 14. | Harmony | 57.1% | 25.8%(+31.3)#14 | 29.0%(+28.1)#1,966 |
| 15. | Buttzville | 56.3% | 25.8%(+30.5)#15 | 29.0%(+27.3)#2,096 |
| 16. | Centre Grove | 56.1% | 25.8%(+30.3)#16 | 29.0%(+27.1)#2,123 |
| 17. | Washington Crossing | 56.1% | 25.8%(+30.3)#17 | 29.0%(+27.1)#2,130 |
| 18. | Country Lake Estates | 54.6% | 25.8%(+28.8)#18 | 29.0%(+25.6)#2,360 |
| 19. | Cumberland-Hesstown | 54.3% | 25.8%(+28.5)#19 | 29.0%(+25.3)#2,415 |
| 20. | Pleasant Plains | 53.7% | 25.8%(+27.9)#20 | 29.0%(+24.7)#2,517 |
| 21. | Oceanville | 53.0% | 25.8%(+27.2)#21 | 29.0%(+24.0)#2,669 |
| 22. | Richwood | 52.9% | 25.8%(+27.1)#22 | 29.0%(+23.9)#2,679 |
| 23. | Silver Lake | 52.4% | 25.8%(+26.6)#23 | 29.0%(+23.4)#2,797 |
| 24. | Springfield | 52.2% | 25.8%(+26.4)#24 | 29.0%(+23.2)#2,843 |
| 25. | Millstone Borough | 51.2% | 25.8%(+25.4)#25 | 29.0%(+22.2)#3,039 |
| 26. | Port Republic | 50.8% | 25.8%(+25.0)#26 | 29.0%(+21.8)#3,107 |
| 27. | Waretown | 49.0% | 25.8%(+23.2)#27 | 29.0%(+20.0)#3,613 |
| 28. | North Middletown | 48.8% | 25.8%(+23.0)#28 | 29.0%(+19.8)#3,660 |
| 29. | New Village | 48.8% | 25.8%(+23.0)#29 | 29.0%(+19.8)#3,671 |
| 30. | Marlboro | 48.0% | 25.8%(+22.2)#30 | 29.0%(+19.0)#3,901 |
| 31. | Brookside | 47.8% | 25.8%(+22.0)#31 | 29.0%(+18.8)#3,937 |
| 32. | New Gretna | 47.7% | 25.8%(+21.9)#32 | 29.0%(+18.7)#3,993 |
| 33. | Buena Borough | 47.6% | 25.8%(+21.8)#33 | 29.0%(+18.6)#3,999 |
| 34. | Corbin City | 47.0% | 25.8%(+21.2)#34 | 29.0%(+18.0)#4,184 |
| 35. | Richland | 46.8% | 25.8%(+21.0)#35 | 29.0%(+17.8)#4,243 |
| 36. | Crosswicks | 46.6% | 25.8%(+20.8)#36 | 29.0%(+17.6)#4,304 |
| 37. | Mizpah | 46.2% | 25.8%(+20.4)#37 | 29.0%(+17.2)#4,438 |
| 38. | Middlebush | 46.0% | 25.8%(+20.2)#38 | 29.0%(+17.0)#4,495 |
| 39. | Hi Nella Borough | 45.5% | 25.8%(+19.7)#39 | 29.0%(+16.5)#4,684 |
| 40. | Delaware Park | 45.4% | 25.8%(+19.6)#40 | 29.0%(+16.4)#4,736 |
| 41. | Groveville | 45.2% | 25.8%(+19.4)#41 | 29.0%(+16.2)#4,773 |
| 42. | Navesink | 45.2% | 25.8%(+19.4)#42 | 29.0%(+16.2)#4,780 |
| 43. | South Seaville | 45.2% | 25.8%(+19.4)#43 | 29.0%(+16.2)#4,787 |
| 44. | Pluckemin | 45.0% | 25.8%(+19.2)#44 | 29.0%(+16.0)#4,864 |
| 45. | Newfield Borough | 44.6% | 25.8%(+18.8)#45 | 29.0%(+15.6)#4,980 |
| 46. | Greenwich | 44.3% | 25.8%(+18.5)#46 | 29.0%(+15.3)#5,102 |
| 47. | Andover Borough | 44.2% | 25.8%(+18.4)#47 | 29.0%(+15.2)#5,151 |
| 48. | Cream Ridge | 44.2% | 25.8%(+18.4)#48 | 29.0%(+15.2)#5,153 |
| 49. | East Freehold | 44.0% | 25.8%(+18.2)#49 | 29.0%(+15.0)#5,207 |
| 50. | Gouldtown | 43.9% | 25.8%(+18.1)#50 | 29.0%(+14.9)#5,266 |
| 51. | Olivet | 43.8% | 25.8%(+18.0)#51 | 29.0%(+14.8)#5,308 |
| 52. | Malaga | 43.5% | 25.8%(+17.7)#52 | 29.0%(+14.5)#5,430 |
| 53. | Sheppards Mill | 43.5% | 25.8%(+17.7)#53 | 29.0%(+14.5)#5,464 |
| 54. | Neshanic Station | 43.4% | 25.8%(+17.6)#54 | 29.0%(+14.4)#5,473 |
| 55. | Jobstown | 43.4% | 25.8%(+17.6)#55 | 29.0%(+14.4)#5,497 |
| 56. | Port Elizabeth | 43.2% | 25.8%(+17.4)#56 | 29.0%(+14.2)#5,573 |
| 57. | Deans | 43.0% | 25.8%(+17.2)#57 | 29.0%(+14.0)#5,641 |
| 58. | Far Hills Borough | 42.8% | 25.8%(+17.0)#58 | 29.0%(+13.8)#5,744 |
| 59. | Blackwells Mills | 42.6% | 25.8%(+16.8)#59 | 29.0%(+13.6)#5,789 |
| 60. | Union Beach Borough | 42.3% | 25.8%(+16.5)#60 | 29.0%(+13.3)#5,923 |
| 61. | Keasbey | 42.2% | 25.8%(+16.4)#61 | 29.0%(+13.2)#5,979 |
| 62. | Johnsonburg | 42.2% | 25.8%(+16.4)#62 | 29.0%(+13.2)#5,994 |
| 63. | Shiloh Borough | 42.2% | 25.8%(+16.4)#63 | 29.0%(+13.2)#6,001 |
| 64. | Bridgeville | 42.2% | 25.8%(+16.4)#64 | 29.0%(+13.2)#6,004 |
| 65. | Bridgewater Center | 41.8% | 25.8%(+16.0)#65 | 29.0%(+12.8)#6,161 |
| 66. | Ledgewood | 41.8% | 25.8%(+16.0)#66 | 29.0%(+12.8)#6,163 |
| 67. | Stewartsville | 41.8% | 25.8%(+16.0)#67 | 29.0%(+12.8)#6,191 |
| 68. | Upper Saddle River Borough | 41.5% | 25.8%(+15.7)#68 | 29.0%(+12.5)#6,323 |
| 69. | Rumson Borough | 41.1% | 25.8%(+15.3)#69 | 29.0%(+12.1)#6,534 |
| 70. | South Toms River Borough | 40.4% | 25.8%(+14.6)#70 | 29.0%(+11.4)#6,869 |
| 71. | Skillman | 40.4% | 25.8%(+14.6)#71 | 29.0%(+11.4)#6,895 |
| 72. | Landing | 40.1% | 25.8%(+14.3)#72 | 29.0%(+11.1)#7,023 |
| 73. | Laurel Lake | 40.1% | 25.8%(+14.3)#73 | 29.0%(+11.1)#7,030 |
| 74. | Laurel Springs Borough | 40.0% | 25.8%(+14.2)#74 | 29.0%(+11.0)#7,068 |
| 75. | Allenwood | 40.0% | 25.8%(+14.2)#75 | 29.0%(+11.0)#7,084 |
| 76. | Saddle River Borough | 39.8% | 25.8%(+14.0)#76 | 29.0%(+10.8)#7,217 |
| 77. | Farmingdale Borough | 39.7% | 25.8%(+13.9)#77 | 29.0%(+10.7)#7,281 |
| 78. | Dorothy | 39.7% | 25.8%(+13.9)#78 | 29.0%(+10.7)#7,286 |
| 79. | Ridgefield Borough | 39.6% | 25.8%(+13.8)#79 | 29.0%(+10.6)#7,318 |
| 80. | Kinnelon Borough | 39.5% | 25.8%(+13.7)#80 | 29.0%(+10.5)#7,385 |
| 81. | Wrightstown Borough | 39.3% | 25.8%(+13.5)#81 | 29.0%(+10.3)#7,528 |
| 82. | West Belmar | 39.2% | 25.8%(+13.4)#82 | 29.0%(+10.2)#7,569 |
| 83. | Bloomsbury Borough | 39.2% | 25.8%(+13.4)#83 | 29.0%(+10.2)#7,578 |
| 84. | Rockleigh Borough | 39.1% | 25.8%(+13.3)#84 | 29.0%(+10.1)#7,625 |
| 85. | Woodbury Heights Borough | 39.0% | 25.8%(+13.2)#85 | 29.0%(+10.0)#7,667 |
| 86. | Rockaway Borough | 38.9% | 25.8%(+13.1)#86 | 29.0%(+9.90)#7,718 |
| 87. | Port Monmouth | 38.8% | 25.8%(+13.0)#87 | 29.0%(+9.80)#7,786 |
| 88. | Pomona | 38.7% | 25.8%(+12.9)#88 | 29.0%(+9.70)#7,854 |
| 89. | Oldwick | 38.7% | 25.8%(+12.9)#89 | 29.0%(+9.70)#7,895 |
| 90. | Annandale | 38.5% | 25.8%(+12.7)#90 | 29.0%(+9.50)#7,985 |
| 91. | Basking Ridge | 38.4% | 25.8%(+12.6)#91 | 29.0%(+9.40)#8,044 |
| 92. | Wharton Borough | 38.3% | 25.8%(+12.5)#92 | 29.0%(+9.30)#8,095 |
| 93. | Ogdensburg Borough | 38.3% | 25.8%(+12.5)#93 | 29.0%(+9.30)#8,113 |
| 94. | Bedminster | 38.3% | 25.8%(+12.5)#94 | 29.0%(+9.30)#8,119 |
| 95. | Cookstown | 38.3% | 25.8%(+12.5)#95 | 29.0%(+9.30)#8,132 |
| 96. | Upper Pohatcong | 38.1% | 25.8%(+12.3)#96 | 29.0%(+9.10)#8,228 |
| 97. | Flagtown | 38.0% | 25.8%(+12.2)#97 | 29.0%(+9.00)#8,296 |
| 98. | Newtonville | 38.0% | 25.8%(+12.2)#98 | 29.0%(+9.00)#8,306 |
| 99. | West Long Branch Borough | 37.9% | 25.8%(+12.1)#99 | 29.0%(+8.90)#8,325 |
| 100. | Yorketown | 37.9% | 25.8%(+12.1)#100 | 29.0%(+8.90)#8,329 |
Common Questions
What are the Top 10 Cities with the Highest Percentage of Households With Three or more Vehicles in New Jersey?
Top 10 Cities with the Highest Percentage of Households With Three or more Vehicles in New Jersey are:
#1
100.0%
#2
72.4%
#3
70.7%
#4
64.7%
#5
63.9%
#6
57.1%
#7
56.3%
#8
54.6%
#9
53.7%
#10
52.9%
What city has the Highest Percentage of Households With Three or more Vehicles in New Jersey?
Ross Corner has the Highest Percentage of Households With Three or more Vehicles in New Jersey with 100.0%.
What is the Percentage of Households With Three or more Vehicles in the State of New Jersey?
Percentage of Households With Three or more Vehicles in New Jersey is 25.8%.
What is the Percentage of Households With Three or more Vehicles in the United States?
Percentage of Households With Three or more Vehicles in the United States is 29.0%.