Cities with the Highest Percentage of Salvadoran Population in New Jersey
RELATED REPORTS & OPTIONS
Salvadoran
New Jersey
Compare Cities
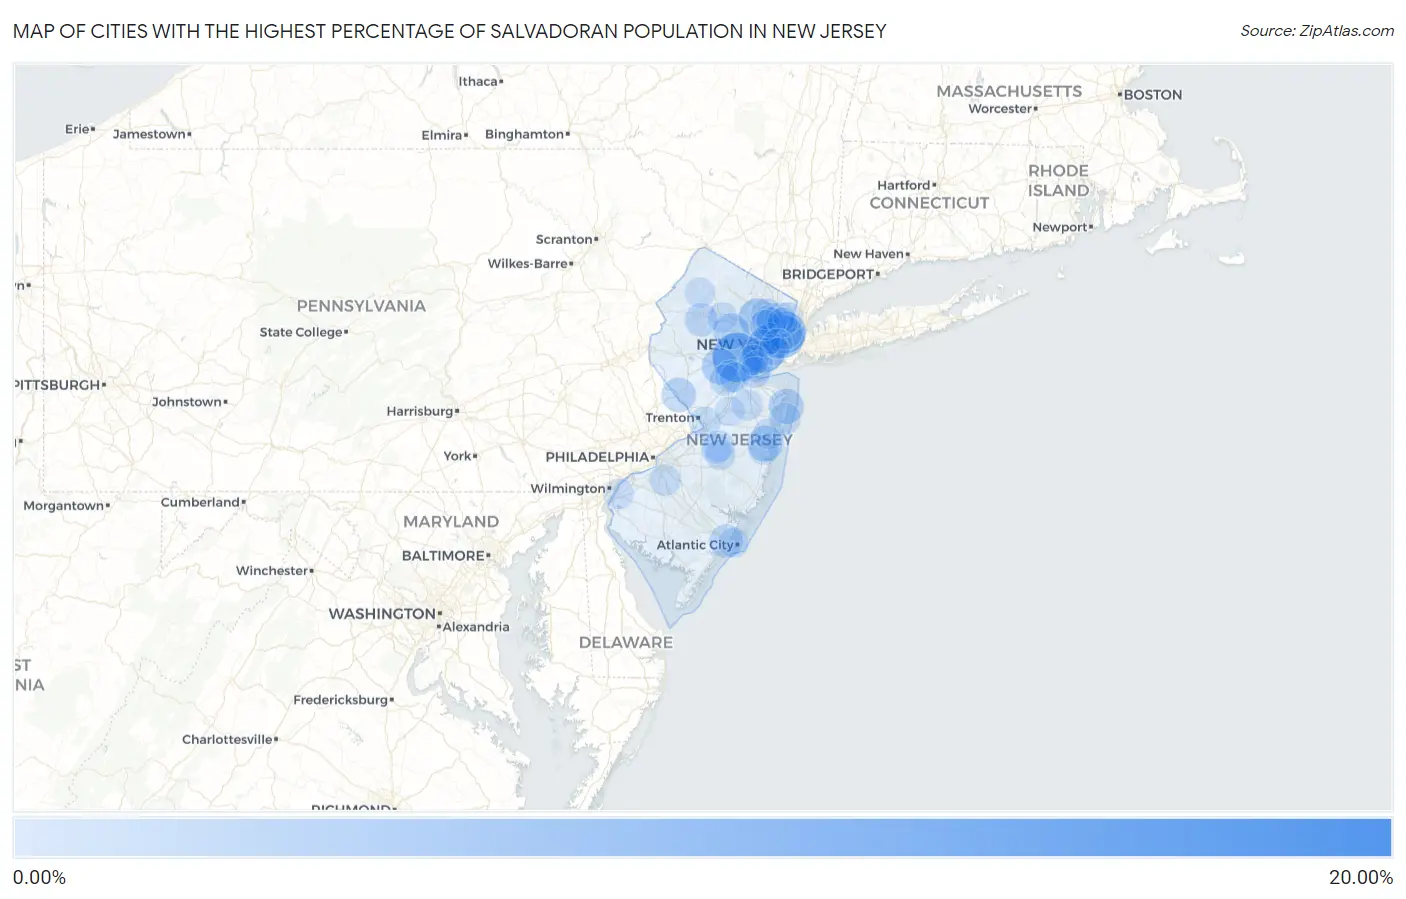
Map of Cities with the Highest Percentage of Salvadoran Population in New Jersey
0.00%
20.00%
Cities with the Highest Percentage of Salvadoran Population in New Jersey
| City | Salvadoran | vs State | vs National | |
| 1. | West Berlin | 19.70% | 0.88%(+18.8)#1 | 0.72%(+19.0)#44 |
| 2. | Plainfield | 12.51% | 0.88%(+11.6)#2 | 0.72%(+11.8)#106 |
| 3. | Fairview Borough | 11.49% | 0.88%(+10.6)#3 | 0.72%(+10.8)#119 |
| 4. | Absecon Highlands | 10.43% | 0.88%(+9.55)#4 | 0.72%(+9.71)#133 |
| 5. | Dunellen Borough | 9.13% | 0.88%(+8.26)#5 | 0.72%(+8.41)#160 |
| 6. | Union City | 8.81% | 0.88%(+7.93)#6 | 0.72%(+8.09)#166 |
| 7. | Elizabeth | 8.39% | 0.88%(+7.51)#7 | 0.72%(+7.67)#173 |
| 8. | West New York | 8.01% | 0.88%(+7.13)#8 | 0.72%(+7.29)#188 |
| 9. | Lindenwold Borough | 6.93% | 0.88%(+6.05)#9 | 0.72%(+6.21)#230 |
| 10. | North Plainfield Borough | 6.11% | 0.88%(+5.23)#10 | 0.72%(+5.39)#274 |
| 11. | Singac | 5.48% | 0.88%(+4.60)#11 | 0.72%(+4.76)#305 |
| 12. | Middlesex Borough | 4.61% | 0.88%(+3.74)#12 | 0.72%(+3.89)#377 |
| 13. | Flemington Borough | 4.50% | 0.88%(+3.63)#13 | 0.72%(+3.78)#383 |
| 14. | Finderne | 4.35% | 0.88%(+3.48)#14 | 0.72%(+3.63)#401 |
| 15. | Morristown | 4.17% | 0.88%(+3.30)#15 | 0.72%(+3.45)#424 |
| 16. | Leisure Village | 4.07% | 0.88%(+3.20)#16 | 0.72%(+3.35)#436 |
| 17. | Northvale Borough | 3.90% | 0.88%(+3.02)#17 | 0.72%(+3.18)#457 |
| 18. | Pleasantdale | 3.90% | 0.88%(+3.02)#18 | 0.72%(+3.18)#458 |
| 19. | Long Branch | 3.77% | 0.88%(+2.89)#19 | 0.72%(+3.05)#475 |
| 20. | Lambertville | 3.37% | 0.88%(+2.49)#20 | 0.72%(+2.65)#552 |
| 21. | Franklinville | 3.08% | 0.88%(+2.21)#21 | 0.72%(+2.36)#596 |
| 22. | Guttenberg | 3.07% | 0.88%(+2.19)#22 | 0.72%(+2.35)#600 |
| 23. | Red Bank Borough | 2.92% | 0.88%(+2.04)#23 | 0.72%(+2.20)#635 |
| 24. | Hightstown Borough | 2.86% | 0.88%(+1.99)#24 | 0.72%(+2.14)#653 |
| 25. | Pleasantville | 2.84% | 0.88%(+1.96)#25 | 0.72%(+2.11)#662 |
| 26. | Totowa Borough | 2.62% | 0.88%(+1.74)#26 | 0.72%(+1.89)#721 |
| 27. | Cliffside Park Borough | 2.56% | 0.88%(+1.68)#27 | 0.72%(+1.84)#733 |
| 28. | Budd Lake | 2.50% | 0.88%(+1.63)#28 | 0.72%(+1.78)#752 |
| 29. | Franklin Borough | 2.49% | 0.88%(+1.62)#29 | 0.72%(+1.77)#761 |
| 30. | Linden | 2.20% | 0.88%(+1.32)#30 | 0.72%(+1.47)#850 |
| 31. | Bogota Borough | 2.05% | 0.88%(+1.17)#31 | 0.72%(+1.33)#892 |
| 32. | High Bridge Borough | 2.02% | 0.88%(+1.14)#32 | 0.72%(+1.30)#908 |
| 33. | East Franklin | 1.94% | 0.88%(+1.07)#33 | 0.72%(+1.22)#936 |
| 34. | East Newark Borough | 1.84% | 0.88%(+0.962)#34 | 0.72%(+1.12)#983 |
| 35. | Eatontown Borough | 1.72% | 0.88%(+0.846)#35 | 0.72%(+1.00)#1,036 |
| 36. | Ocean Grove | 1.69% | 0.88%(+0.817)#36 | 0.72%(+0.972)#1,054 |
| 37. | White Horse | 1.64% | 0.88%(+0.763)#37 | 0.72%(+0.919)#1,090 |
| 38. | Roselle Borough | 1.59% | 0.88%(+0.714)#38 | 0.72%(+0.869)#1,122 |
| 39. | South Plainfield Borough | 1.49% | 0.88%(+0.614)#39 | 0.72%(+0.770)#1,188 |
| 40. | Kearny | 1.47% | 0.88%(+0.588)#40 | 0.72%(+0.743)#1,209 |
| 41. | Port Reading | 1.46% | 0.88%(+0.583)#41 | 0.72%(+0.739)#1,210 |
| 42. | Blackwood | 1.46% | 0.88%(+0.583)#42 | 0.72%(+0.739)#1,211 |
| 43. | Mcguire Afb | 1.45% | 0.88%(+0.576)#43 | 0.72%(+0.731)#1,217 |
| 44. | Garfield | 1.45% | 0.88%(+0.573)#44 | 0.72%(+0.729)#1,219 |
| 45. | Lodi Borough | 1.41% | 0.88%(+0.528)#45 | 0.72%(+0.684)#1,249 |
| 46. | Macopin | 1.40% | 0.88%(+0.519)#46 | 0.72%(+0.675)#1,262 |
| 47. | Highlands Borough | 1.33% | 0.88%(+0.457)#47 | 0.72%(+0.613)#1,301 |
| 48. | Roselle Park Borough | 1.32% | 0.88%(+0.440)#48 | 0.72%(+0.596)#1,313 |
| 49. | South River Borough | 1.31% | 0.88%(+0.435)#49 | 0.72%(+0.590)#1,320 |
| 50. | Hopelawn | 1.31% | 0.88%(+0.429)#50 | 0.72%(+0.584)#1,328 |
| 51. | Six Mile Run | 1.30% | 0.88%(+0.424)#51 | 0.72%(+0.580)#1,332 |
| 52. | Clifton | 1.30% | 0.88%(+0.423)#52 | 0.72%(+0.578)#1,334 |
| 53. | Harrison | 1.30% | 0.88%(+0.418)#53 | 0.72%(+0.574)#1,340 |
| 54. | Bayonne | 1.29% | 0.88%(+0.411)#54 | 0.72%(+0.566)#1,344 |
| 55. | Newark | 1.25% | 0.88%(+0.372)#55 | 0.72%(+0.527)#1,372 |
| 56. | Yorketown | 1.24% | 0.88%(+0.358)#56 | 0.72%(+0.513)#1,386 |
| 57. | Ramtown | 1.23% | 0.88%(+0.352)#57 | 0.72%(+0.508)#1,392 |
| 58. | Freehold Borough | 1.22% | 0.88%(+0.339)#58 | 0.72%(+0.495)#1,397 |
| 59. | Keasbey | 1.20% | 0.88%(+0.325)#59 | 0.72%(+0.481)#1,405 |
| 60. | Manville Borough | 1.18% | 0.88%(+0.307)#60 | 0.72%(+0.463)#1,418 |
| 61. | Perth Amboy | 1.18% | 0.88%(+0.298)#61 | 0.72%(+0.453)#1,427 |
| 62. | Bound Brook Borough | 1.17% | 0.88%(+0.290)#62 | 0.72%(+0.446)#1,435 |
| 63. | Berlin Borough | 1.16% | 0.88%(+0.284)#63 | 0.72%(+0.440)#1,438 |
| 64. | Paterson | 1.13% | 0.88%(+0.248)#64 | 0.72%(+0.404)#1,465 |
| 65. | Westwood Borough | 1.09% | 0.88%(+0.217)#65 | 0.72%(+0.373)#1,501 |
| 66. | Highland Park Borough | 1.06% | 0.88%(+0.183)#66 | 0.72%(+0.339)#1,539 |
| 67. | Montclair State University | 1.05% | 0.88%(+0.173)#67 | 0.72%(+0.328)#1,547 |
| 68. | Bloomingdale Borough | 1.02% | 0.88%(+0.145)#68 | 0.72%(+0.301)#1,583 |
| 69. | Stratford Borough | 1.01% | 0.88%(+0.128)#69 | 0.72%(+0.284)#1,606 |
| 70. | Elmwood Park Borough | 0.99% | 0.88%(+0.115)#70 | 0.72%(+0.271)#1,624 |
| 71. | Bergenfield Borough | 0.96% | 0.88%(+0.086)#71 | 0.72%(+0.242)#1,661 |
| 72. | Browns Mills | 0.90% | 0.88%(+0.027)#72 | 0.72%(+0.183)#1,730 |
| 73. | Newton | 0.88% | 0.88%(+0.007)#73 | 0.72%(+0.162)#1,755 |
| 74. | Spring Lake Heights Borough | 0.88% | 0.88%(+0.007)#74 | 0.72%(+0.162)#1,756 |
| 75. | Leonia Borough | 0.87% | 0.88%(-0.004)#75 | 0.72%(+0.152)#1,767 |
| 76. | Carneys Point | 0.84% | 0.88%(-0.042)#76 | 0.72%(+0.114)#1,812 |
| 77. | Fort Dix | 0.82% | 0.88%(-0.055)#77 | 0.72%(+0.101)#1,829 |
| 78. | Ramsey Borough | 0.82% | 0.88%(-0.056)#78 | 0.72%(+0.099)#1,833 |
| 79. | Dover | 0.81% | 0.88%(-0.063)#79 | 0.72%(+0.092)#1,850 |
| 80. | Hackensack | 0.81% | 0.88%(-0.064)#80 | 0.72%(+0.091)#1,852 |
| 81. | South Bound Brook Borough | 0.81% | 0.88%(-0.071)#81 | 0.72%(+0.084)#1,863 |
| 82. | Rahway | 0.81% | 0.88%(-0.072)#82 | 0.72%(+0.084)#1,864 |
| 83. | Passaic | 0.78% | 0.88%(-0.095)#83 | 0.72%(+0.061)#1,905 |
| 84. | Audubon Borough | 0.78% | 0.88%(-0.095)#84 | 0.72%(+0.060)#1,906 |
| 85. | Atlantic City | 0.78% | 0.88%(-0.100)#85 | 0.72%(+0.055)#1,919 |
| 86. | Waldwick Borough | 0.76% | 0.88%(-0.112)#86 | 0.72%(+0.043)#1,944 |
| 87. | Brookdale | 0.75% | 0.88%(-0.131)#87 | 0.72%(+0.025)#1,971 |
| 88. | Englewood | 0.74% | 0.88%(-0.142)#88 | 0.72%(+0.013)#1,990 |
| 89. | Toms River | 0.72% | 0.88%(-0.157)#89 | 0.72%(-0.001)#2,018 |
| 90. | Union | 0.71% | 0.88%(-0.171)#90 | 0.72%(-0.016)#2,046 |
| 91. | Madison Borough | 0.69% | 0.88%(-0.187)#91 | 0.72%(-0.032)#2,067 |
| 92. | Twin Rivers | 0.69% | 0.88%(-0.190)#92 | 0.72%(-0.034)#2,070 |
| 93. | Kean University | 0.69% | 0.88%(-0.191)#93 | 0.72%(-0.036)#2,073 |
| 94. | Ridgefield Borough | 0.68% | 0.88%(-0.197)#94 | 0.72%(-0.041)#2,082 |
| 95. | Shrewsbury Borough | 0.68% | 0.88%(-0.201)#95 | 0.72%(-0.045)#2,090 |
| 96. | New Brunswick | 0.68% | 0.88%(-0.201)#96 | 0.72%(-0.045)#2,091 |
| 97. | Ridgefield Park | 0.67% | 0.88%(-0.209)#97 | 0.72%(-0.053)#2,106 |
| 98. | Haworth Borough | 0.66% | 0.88%(-0.219)#98 | 0.72%(-0.063)#2,131 |
| 99. | Jersey City | 0.65% | 0.88%(-0.226)#99 | 0.72%(-0.070)#2,144 |
| 100. | Haledon Borough | 0.64% | 0.88%(-0.240)#100 | 0.72%(-0.084)#2,171 |
Common Questions
What are the Top 10 Cities with the Highest Percentage of Salvadoran Population in New Jersey?
Top 10 Cities with the Highest Percentage of Salvadoran Population in New Jersey are:
#1
12.51%
#2
8.81%
#3
8.39%
#4
8.01%
#5
5.48%
#6
4.35%
#7
4.17%
#8
4.07%
#9
3.77%
#10
3.37%
What city has the Highest Percentage of Salvadoran Population in New Jersey?
Plainfield has the Highest Percentage of Salvadoran Population in New Jersey with 12.51%.
What is the Percentage of Salvadoran Population in the State of New Jersey?
Percentage of Salvadoran Population in New Jersey is 0.88%.
What is the Percentage of Salvadoran Population in the United States?
Percentage of Salvadoran Population in the United States is 0.72%.