Cities with the Largest Belgian Community in New Jersey
RELATED REPORTS & OPTIONS
Belgian
New Jersey
Compare Cities
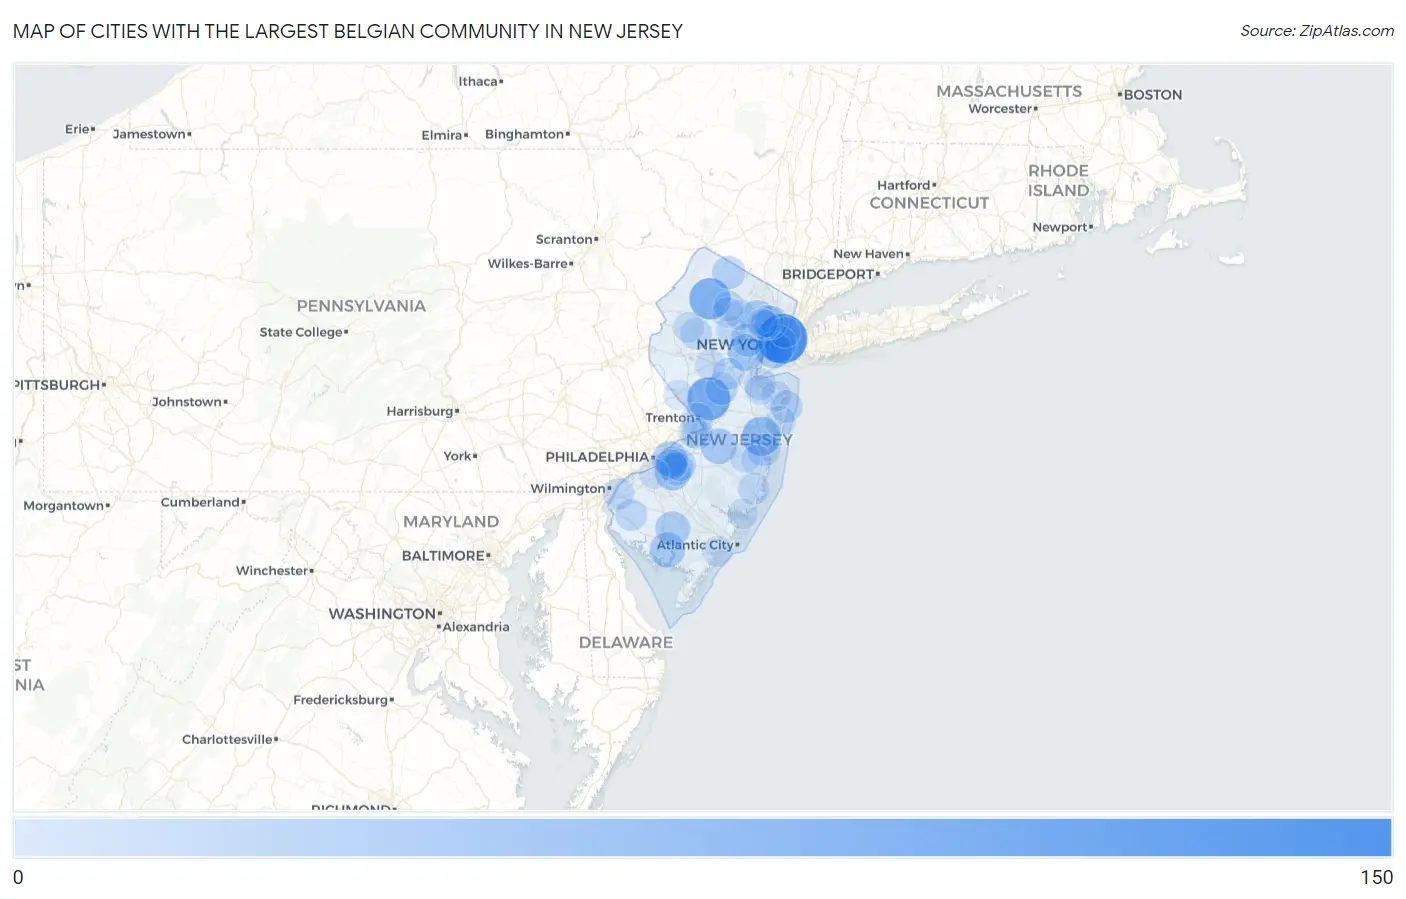
Map of Cities with the Largest Belgian Community in New Jersey
0
150
Cities with the Largest Belgian Community in New Jersey
| City | Belgian | vs State | vs National | |
| 1. | Hoboken | 141 | 5,712(2.47%)#1 | 327,258(0.04%)#286 |
| 2. | Lake Hopatcong | 133 | 5,712(2.33%)#2 | 327,258(0.04%)#308 |
| 3. | Princeton | 96 | 5,712(1.68%)#3 | 327,258(0.03%)#461 |
| 4. | Lake Mohawk | 85 | 5,712(1.49%)#4 | 327,258(0.03%)#550 |
| 5. | Lakewood | 68 | 5,712(1.19%)#5 | 327,258(0.02%)#723 |
| 6. | Jersey City | 60 | 5,712(1.05%)#6 | 327,258(0.02%)#838 |
| 7. | Mount Royal | 58 | 5,712(1.02%)#7 | 327,258(0.02%)#880 |
| 8. | Hamburg Borough | 55 | 5,712(0.96%)#8 | 327,258(0.02%)#937 |
| 9. | Bayonne | 54 | 5,712(0.95%)#9 | 327,258(0.02%)#944 |
| 10. | Westfield | 54 | 5,712(0.95%)#10 | 327,258(0.02%)#953 |
| 11. | Totowa Borough | 53 | 5,712(0.93%)#11 | 327,258(0.02%)#975 |
| 12. | Belmar Borough | 51 | 5,712(0.89%)#12 | 327,258(0.02%)#1,009 |
| 13. | Highland Park Borough | 50 | 5,712(0.88%)#13 | 327,258(0.02%)#1,025 |
| 14. | Echelon | 47 | 5,712(0.82%)#14 | 327,258(0.01%)#1,086 |
| 15. | Mcguire Afb | 46 | 5,712(0.81%)#15 | 327,258(0.01%)#1,115 |
| 16. | Bloomingdale Borough | 45 | 5,712(0.79%)#16 | 327,258(0.01%)#1,141 |
| 17. | Midland Park Borough | 45 | 5,712(0.79%)#17 | 327,258(0.01%)#1,143 |
| 18. | Highlands Borough | 45 | 5,712(0.79%)#18 | 327,258(0.01%)#1,144 |
| 19. | Cherry Hill Mall | 44 | 5,712(0.77%)#19 | 327,258(0.01%)#1,162 |
| 20. | Basking Ridge | 43 | 5,712(0.75%)#20 | 327,258(0.01%)#1,185 |
| 21. | Riverdale Borough | 43 | 5,712(0.75%)#21 | 327,258(0.01%)#1,190 |
| 22. | Laurel Lake | 43 | 5,712(0.75%)#22 | 327,258(0.01%)#1,194 |
| 23. | Vineland | 40 | 5,712(0.70%)#23 | 327,258(0.01%)#1,254 |
| 24. | Wanaque Borough | 40 | 5,712(0.70%)#24 | 327,258(0.01%)#1,269 |
| 25. | Ramsey Borough | 39 | 5,712(0.68%)#25 | 327,258(0.01%)#1,297 |
| 26. | Singac | 39 | 5,712(0.68%)#26 | 327,258(0.01%)#1,306 |
| 27. | Ringwood Borough | 37 | 5,712(0.65%)#27 | 327,258(0.01%)#1,358 |
| 28. | Ho Ho Kus Borough | 34 | 5,712(0.60%)#28 | 327,258(0.01%)#1,475 |
| 29. | Passaic | 31 | 5,712(0.54%)#29 | 327,258(0.01%)#1,565 |
| 30. | Springdale | 31 | 5,712(0.54%)#30 | 327,258(0.01%)#1,582 |
| 31. | Short Hills | 31 | 5,712(0.54%)#31 | 327,258(0.01%)#1,583 |
| 32. | Milltown Borough | 30 | 5,712(0.53%)#32 | 327,258(0.01%)#1,633 |
| 33. | Vernon Center | 30 | 5,712(0.53%)#33 | 327,258(0.01%)#1,642 |
| 34. | Leonia Borough | 29 | 5,712(0.51%)#34 | 327,258(0.01%)#1,671 |
| 35. | Butler Borough | 27 | 5,712(0.47%)#35 | 327,258(0.01%)#1,747 |
| 36. | Toms River | 25 | 5,712(0.44%)#36 | 327,258(0.01%)#1,826 |
| 37. | River Edge Borough | 25 | 5,712(0.44%)#37 | 327,258(0.01%)#1,844 |
| 38. | Kendall Park | 25 | 5,712(0.44%)#38 | 327,258(0.01%)#1,847 |
| 39. | Long Branch | 24 | 5,712(0.42%)#39 | 327,258(0.01%)#1,882 |
| 40. | New Providence Borough | 24 | 5,712(0.42%)#40 | 327,258(0.01%)#1,894 |
| 41. | Woodland Park Borough | 24 | 5,712(0.42%)#41 | 327,258(0.01%)#1,896 |
| 42. | The College Of New Jersey | 24 | 5,712(0.42%)#42 | 327,258(0.01%)#1,918 |
| 43. | Trenton | 23 | 5,712(0.40%)#43 | 327,258(0.01%)#1,933 |
| 44. | Clifton | 23 | 5,712(0.40%)#44 | 327,258(0.01%)#1,934 |
| 45. | Marlton | 23 | 5,712(0.40%)#45 | 327,258(0.01%)#1,961 |
| 46. | Kingston Estates | 23 | 5,712(0.40%)#46 | 327,258(0.01%)#1,968 |
| 47. | Cliffwood Beach | 23 | 5,712(0.40%)#47 | 327,258(0.01%)#1,981 |
| 48. | Somerset | 22 | 5,712(0.39%)#48 | 327,258(0.01%)#2,010 |
| 49. | Ocean Acres | 22 | 5,712(0.39%)#49 | 327,258(0.01%)#2,016 |
| 50. | Kinnelon Borough | 22 | 5,712(0.39%)#50 | 327,258(0.01%)#2,031 |
| 51. | Spring Lake Heights Borough | 22 | 5,712(0.39%)#51 | 327,258(0.01%)#2,040 |
| 52. | Alloway | 22 | 5,712(0.39%)#52 | 327,258(0.01%)#2,058 |
| 53. | Palmyra Borough | 21 | 5,712(0.37%)#53 | 327,258(0.01%)#2,100 |
| 54. | Carneys Point | 20 | 5,712(0.35%)#54 | 327,258(0.01%)#2,156 |
| 55. | Swedesboro Borough | 20 | 5,712(0.35%)#55 | 327,258(0.01%)#2,176 |
| 56. | Long Valley | 20 | 5,712(0.35%)#56 | 327,258(0.01%)#2,179 |
| 57. | Bridgewater Center | 19 | 5,712(0.33%)#57 | 327,258(0.01%)#2,244 |
| 58. | Morris Plains Borough | 18 | 5,712(0.32%)#58 | 327,258(0.01%)#2,335 |
| 59. | Barclay | 18 | 5,712(0.32%)#59 | 327,258(0.01%)#2,339 |
| 60. | Pompton Plains | 17 | 5,712(0.30%)#60 | 327,258(0.01%)#2,407 |
| 61. | Hawthorne Borough | 16 | 5,712(0.28%)#61 | 327,258(0.00%)#2,476 |
| 62. | Matawan Borough | 16 | 5,712(0.28%)#62 | 327,258(0.00%)#2,498 |
| 63. | Old Tappan Borough | 16 | 5,712(0.28%)#63 | 327,258(0.00%)#2,513 |
| 64. | Beattystown | 16 | 5,712(0.28%)#64 | 327,258(0.00%)#2,516 |
| 65. | Roebling | 16 | 5,712(0.28%)#65 | 327,258(0.00%)#2,523 |
| 66. | West New York | 15 | 5,712(0.26%)#66 | 327,258(0.00%)#2,553 |
| 67. | Sayreville Borough | 15 | 5,712(0.26%)#67 | 327,258(0.00%)#2,554 |
| 68. | Elmwood Park Borough | 15 | 5,712(0.26%)#68 | 327,258(0.00%)#2,570 |
| 69. | Somers Point | 15 | 5,712(0.26%)#69 | 327,258(0.00%)#2,591 |
| 70. | Haddon Heights Borough | 15 | 5,712(0.26%)#70 | 327,258(0.00%)#2,604 |
| 71. | Carlstadt Borough | 15 | 5,712(0.26%)#71 | 327,258(0.00%)#2,610 |
| 72. | Florence | 15 | 5,712(0.26%)#72 | 327,258(0.00%)#2,619 |
| 73. | Shark River Hills | 15 | 5,712(0.26%)#73 | 327,258(0.00%)#2,627 |
| 74. | Morristown | 14 | 5,712(0.25%)#74 | 327,258(0.00%)#2,691 |
| 75. | Bradley Gardens | 14 | 5,712(0.25%)#75 | 327,258(0.00%)#2,706 |
| 76. | Eatontown Borough | 14 | 5,712(0.25%)#76 | 327,258(0.00%)#2,708 |
| 77. | Preakness | 13 | 5,712(0.23%)#77 | 327,258(0.00%)#2,811 |
| 78. | Somerville Borough | 13 | 5,712(0.23%)#78 | 327,258(0.00%)#2,831 |
| 79. | Bound Brook Borough | 13 | 5,712(0.23%)#79 | 327,258(0.00%)#2,833 |
| 80. | Lake Hiawatha | 13 | 5,712(0.23%)#80 | 327,258(0.00%)#2,839 |
| 81. | Woodbury | 13 | 5,712(0.23%)#81 | 327,258(0.00%)#2,840 |
| 82. | White Meadow Lake | 13 | 5,712(0.23%)#82 | 327,258(0.00%)#2,842 |
| 83. | Boonton | 13 | 5,712(0.23%)#83 | 327,258(0.00%)#2,843 |
| 84. | Fairview | 13 | 5,712(0.23%)#84 | 327,258(0.00%)#2,872 |
| 85. | Lake Como Borough | 13 | 5,712(0.23%)#85 | 327,258(0.00%)#2,892 |
| 86. | Rutherford Borough | 12 | 5,712(0.21%)#86 | 327,258(0.00%)#2,940 |
| 87. | Haddonfield Borough | 12 | 5,712(0.21%)#87 | 327,258(0.00%)#2,955 |
| 88. | Park Ridge Borough | 12 | 5,712(0.21%)#88 | 327,258(0.00%)#2,965 |
| 89. | Crestwood Village | 12 | 5,712(0.21%)#89 | 327,258(0.00%)#2,969 |
| 90. | Mystic Island | 12 | 5,712(0.21%)#90 | 327,258(0.00%)#2,978 |
| 91. | Lambertville | 12 | 5,712(0.21%)#91 | 327,258(0.00%)#2,996 |
| 92. | Holiday Heights | 12 | 5,712(0.21%)#92 | 327,258(0.00%)#3,018 |
| 93. | Lake Telemark | 12 | 5,712(0.21%)#93 | 327,258(0.00%)#3,030 |
| 94. | Oak Ridge | 11 | 5,712(0.19%)#94 | 327,258(0.00%)#3,101 |
| 95. | Brookdale | 11 | 5,712(0.19%)#95 | 327,258(0.00%)#3,108 |
| 96. | Mountain Lakes Borough | 11 | 5,712(0.19%)#96 | 327,258(0.00%)#3,148 |
| 97. | Upper Montclair | 10 | 5,712(0.18%)#97 | 327,258(0.00%)#3,268 |
| 98. | Strathmore | 10 | 5,712(0.18%)#98 | 327,258(0.00%)#3,297 |
| 99. | Towaco | 10 | 5,712(0.18%)#99 | 327,258(0.00%)#3,307 |
| 100. | High Bridge Borough | 10 | 5,712(0.18%)#100 | 327,258(0.00%)#3,325 |
Common Questions
What are the Top 10 Cities with the Largest Belgian Community in New Jersey?
Top 10 Cities with the Largest Belgian Community in New Jersey are:
#1
141
#2
96
#3
85
#4
68
#5
60
#6
54
#7
54
#8
47
#9
46
#10
44
What city has the Largest Belgian Community in New Jersey?
Hoboken has the Largest Belgian Community in New Jersey with 141.
What is the Total Belgian Population in the State of New Jersey?
Total Belgian Population in New Jersey is 5,712.
What is the Total Belgian Population in the United States?
Total Belgian Population in the United States is 327,258.