Woodland Park borough, NJ Map & Demographics
Woodland Park borough Overview
$46,030
PER CAPITA INCOME
$106,780
AVG FAMILY INCOME
$90,323
AVG HOUSEHOLD INCOME
25.0%
WAGE / INCOME GAP [ % ]
75.0¢/ $1
WAGE / INCOME GAP [ $ ]
0.41
INEQUALITY / GINI INDEX
13,291
TOTAL POPULATION
6,576
MALE POPULATION
6,715
FEMALE POPULATION
97.93
MALES / 100 FEMALES
102.11
FEMALES / 100 MALES
43.2
MEDIAN AGE
3.2
AVG FAMILY SIZE
2.5
AVG HOUSEHOLD SIZE
6,963
LABOR FORCE [ PEOPLE ]
63.5%
PERCENT IN LABOR FORCE
6.1%
UNEMPLOYMENT RATE
Income in Woodland Park borough
Income Overview in Woodland Park borough
Per Capita Income in Woodland Park borough is $46,030, while median incomes of families and households are $106,780 and $90,323 respectively.
| Characteristic | Number | Measure |
| Per Capita Income | 13,291 | $46,030 |
| Median Family Income | 3,379 | $106,780 |
| Mean Family Income | 3,379 | $129,049 |
| Median Household Income | 5,294 | $90,323 |
| Mean Household Income | 5,294 | $115,252 |
| Income Deficit | 3,379 | $0 |
| Wage / Income Gap (%) | 13,291 | 24.96% |
| Wage / Income Gap ($) | 13,291 | 75.04¢ per $1 |
| Gini / Inequality Index | 13,291 | 0.41 |
Earnings by Sex in Woodland Park borough
Average Earnings in Woodland Park borough are $43,888, $49,658 for men and $37,263 for women, a difference of 25.0%.
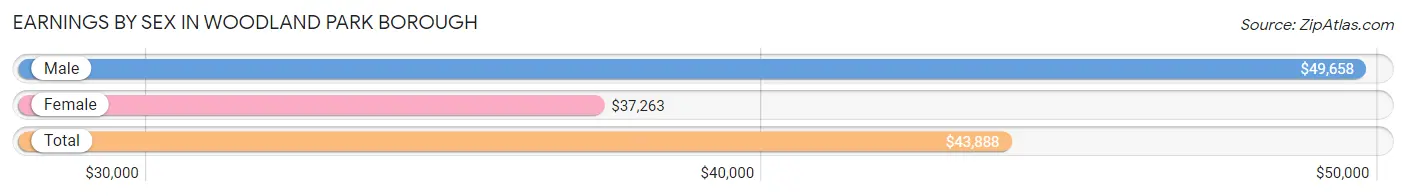
| Sex | Number | Average Earnings |
| Male | 3,870 (52.1%) | $49,658 |
| Female | 3,556 (47.9%) | $37,263 |
| Total | 7,426 (100.0%) | $43,888 |
Earnings by Sex by Income Bracket in Woodland Park borough
The most common earnings brackets in Woodland Park borough are $100,000+ for men (637 | 16.5%) and $75,000 to $99,999 for women (587 | 16.5%).
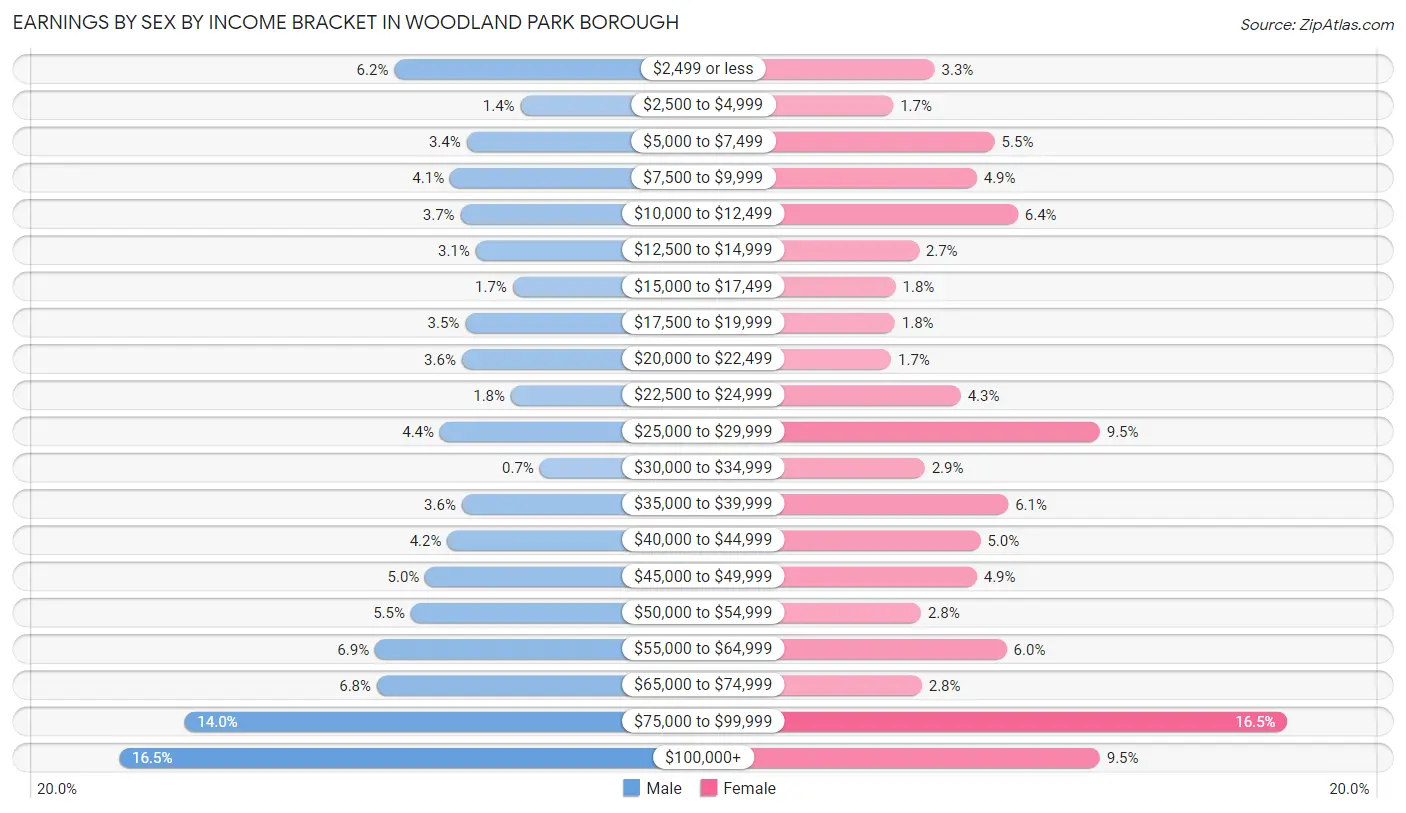
| Income | Male | Female |
| $2,499 or less | 238 (6.1%) | 117 (3.3%) |
| $2,500 to $4,999 | 55 (1.4%) | 62 (1.7%) |
| $5,000 to $7,499 | 133 (3.4%) | 197 (5.5%) |
| $7,500 to $9,999 | 157 (4.1%) | 173 (4.9%) |
| $10,000 to $12,499 | 142 (3.7%) | 228 (6.4%) |
| $12,500 to $14,999 | 120 (3.1%) | 96 (2.7%) |
| $15,000 to $17,499 | 66 (1.7%) | 65 (1.8%) |
| $17,500 to $19,999 | 135 (3.5%) | 64 (1.8%) |
| $20,000 to $22,499 | 140 (3.6%) | 59 (1.7%) |
| $22,500 to $24,999 | 69 (1.8%) | 152 (4.3%) |
| $25,000 to $29,999 | 172 (4.4%) | 337 (9.5%) |
| $30,000 to $34,999 | 27 (0.7%) | 104 (2.9%) |
| $35,000 to $39,999 | 140 (3.6%) | 215 (6.0%) |
| $40,000 to $44,999 | 161 (4.2%) | 178 (5.0%) |
| $45,000 to $49,999 | 193 (5.0%) | 173 (4.9%) |
| $50,000 to $54,999 | 214 (5.5%) | 99 (2.8%) |
| $55,000 to $64,999 | 266 (6.9%) | 213 (6.0%) |
| $65,000 to $74,999 | 263 (6.8%) | 100 (2.8%) |
| $75,000 to $99,999 | 542 (14.0%) | 587 (16.5%) |
| $100,000+ | 637 (16.5%) | 337 (9.5%) |
| Total | 3,870 (100.0%) | 3,556 (100.0%) |
Earnings by Sex by Educational Attainment in Woodland Park borough
Average earnings in Woodland Park borough are $52,608 for men and $44,883 for women, a difference of 14.7%. Men with an educational attainment of college or associate's degree enjoy the highest average annual earnings of $67,852, while those with bachelor's degree education earn the least with $42,007. Women with an educational attainment of bachelor's degree earn the most with the average annual earnings of $65,000, while those with college or associate's degree education have the smallest earnings of $36,103.
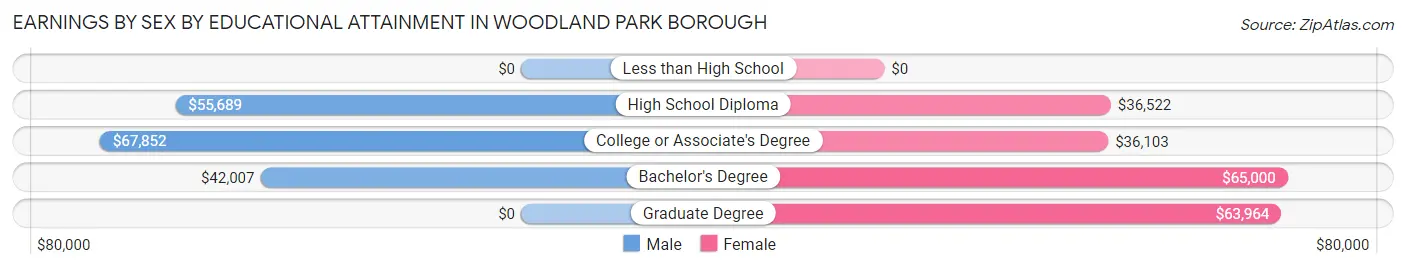
| Educational Attainment | Male Income | Female Income |
| Less than High School | - | - |
| High School Diploma | $55,689 | $36,522 |
| College or Associate's Degree | $67,852 | $36,103 |
| Bachelor's Degree | $42,007 | $65,000 |
| Graduate Degree | - | - |
| Total | $52,608 | $44,883 |
Family Income in Woodland Park borough
Family Income Brackets in Woodland Park borough
According to the Woodland Park borough family income data, there are 852 families falling into the $100,000 to $149,999 income range, which is the most common income bracket and makes up 25.2% of all families. Conversely, the $10,000 to $14,999 income bracket is the least frequent group with only 17 families (0.5%) belonging to this category.
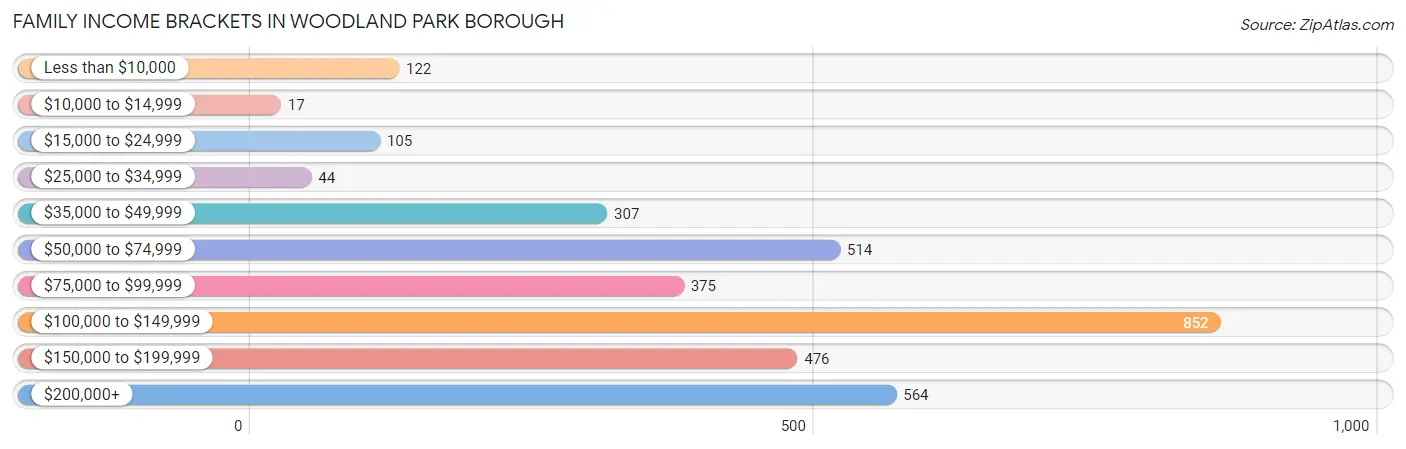
| Income Bracket | # Families | % Families |
| Less than $10,000 | 122 | 3.6% |
| $10,000 to $14,999 | 17 | 0.5% |
| $15,000 to $24,999 | 105 | 3.1% |
| $25,000 to $34,999 | 44 | 1.3% |
| $35,000 to $49,999 | 307 | 9.1% |
| $50,000 to $74,999 | 514 | 15.2% |
| $75,000 to $99,999 | 375 | 11.1% |
| $100,000 to $149,999 | 852 | 25.2% |
| $150,000 to $199,999 | 476 | 14.1% |
| $200,000+ | 564 | 16.7% |
Family Income by Famaliy Size in Woodland Park borough
6-person families (128 | 3.8%) account for the highest median family income in Woodland Park borough with $161,528 per family, while 2-person families (1,580 | 46.8%) have the highest median income of $53,112 per family member.
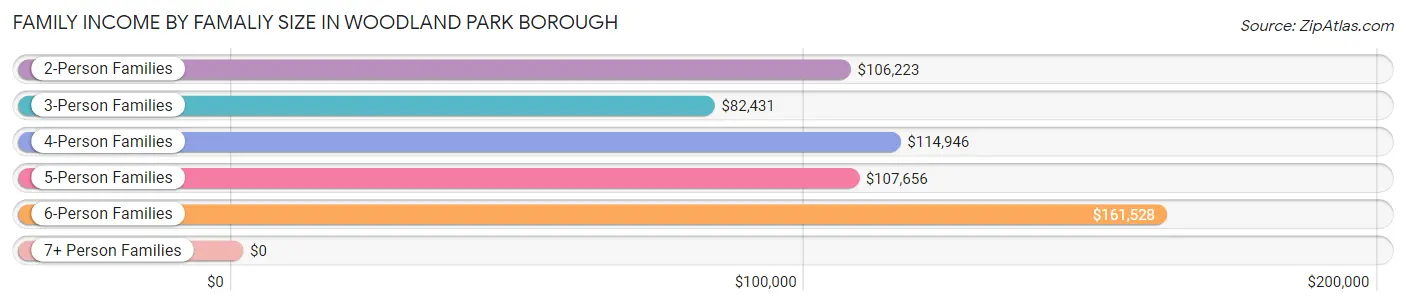
| Income Bracket | # Families | Median Income |
| 2-Person Families | 1,580 (46.8%) | $106,223 |
| 3-Person Families | 589 (17.4%) | $82,431 |
| 4-Person Families | 739 (21.9%) | $114,946 |
| 5-Person Families | 300 (8.9%) | $107,656 |
| 6-Person Families | 128 (3.8%) | $161,528 |
| 7+ Person Families | 43 (1.3%) | $0 |
| Total | 3,379 (100.0%) | $106,780 |
Family Income by Number of Earners in Woodland Park borough
The median family income in Woodland Park borough is $106,780, with families comprising 3+ earners (717) having the highest median family income of $159,398, while families with no earners (487) have the lowest median family income of $84,792, accounting for 21.2% and 14.4% of families, respectively.
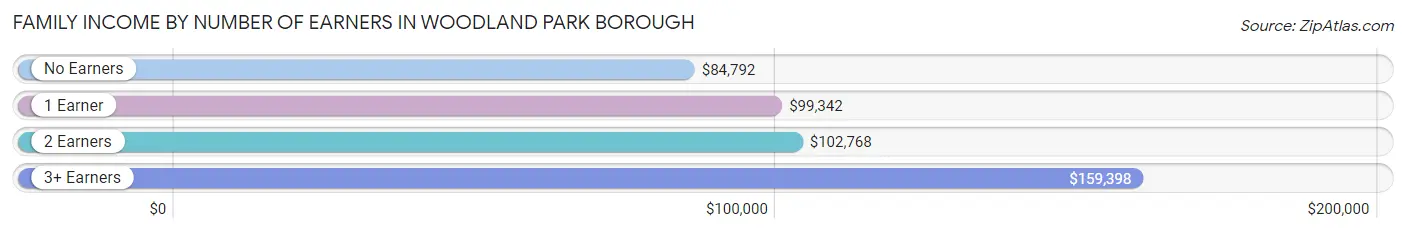
| Number of Earners | # Families | Median Income |
| No Earners | 487 (14.4%) | $84,792 |
| 1 Earner | 986 (29.2%) | $99,342 |
| 2 Earners | 1,189 (35.2%) | $102,768 |
| 3+ Earners | 717 (21.2%) | $159,398 |
| Total | 3,379 (100.0%) | $106,780 |
Household Income in Woodland Park borough
Household Income Brackets in Woodland Park borough
With 1,027 households falling in the category, the $100,000 to $149,999 income range is the most frequent in Woodland Park borough, accounting for 19.4% of all households. In contrast, only 42 households (0.8%) fall into the $10,000 to $14,999 income bracket, making it the least populous group.
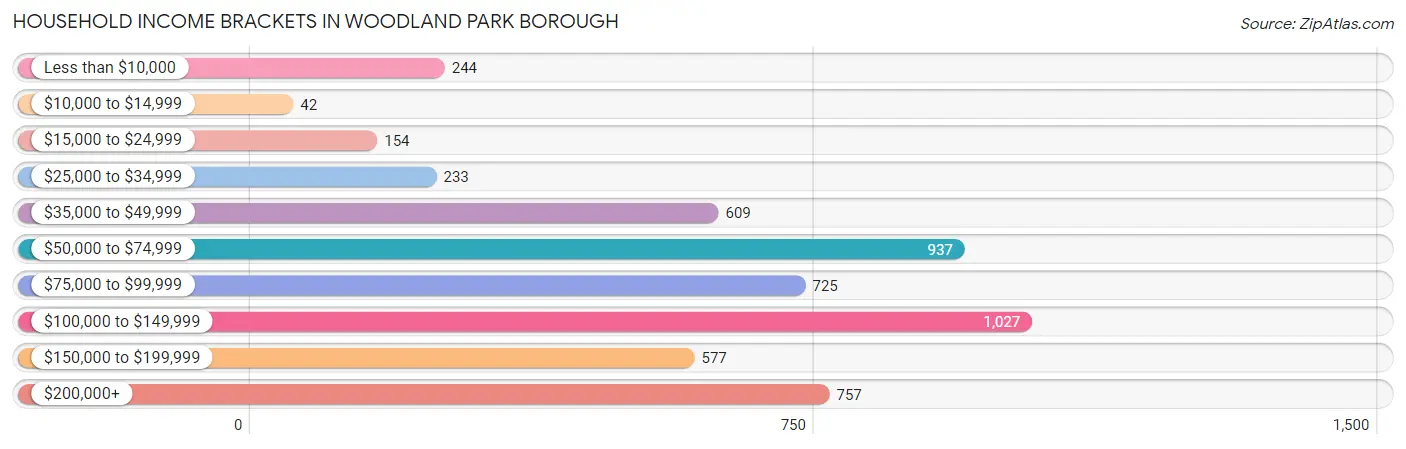
| Income Bracket | # Households | % Households |
| Less than $10,000 | 244 | 4.6% |
| $10,000 to $14,999 | 42 | 0.8% |
| $15,000 to $24,999 | 154 | 2.9% |
| $25,000 to $34,999 | 233 | 4.4% |
| $35,000 to $49,999 | 609 | 11.5% |
| $50,000 to $74,999 | 937 | 17.7% |
| $75,000 to $99,999 | 725 | 13.7% |
| $100,000 to $149,999 | 1,027 | 19.4% |
| $150,000 to $199,999 | 577 | 10.9% |
| $200,000+ | 757 | 14.3% |
Household Income by Householder Age in Woodland Park borough
The median household income in Woodland Park borough is $90,323, with the highest median household income of $96,121 found in the 25 to 44 years age bracket for the primary householder. A total of 1,086 households (20.5%) fall into this category. Meanwhile, the 15 to 24 years age bracket for the primary householder has the lowest median household income of $0, with 149 households (2.8%) in this group.
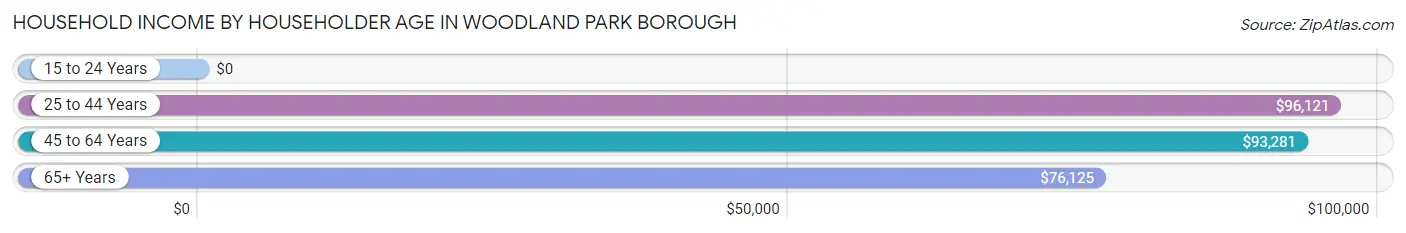
| Income Bracket | # Households | Median Income |
| 15 to 24 Years | 149 (2.8%) | $0 |
| 25 to 44 Years | 1,086 (20.5%) | $96,121 |
| 45 to 64 Years | 2,186 (41.3%) | $93,281 |
| 65+ Years | 1,873 (35.4%) | $76,125 |
| Total | 5,294 (100.0%) | $90,323 |
Poverty in Woodland Park borough
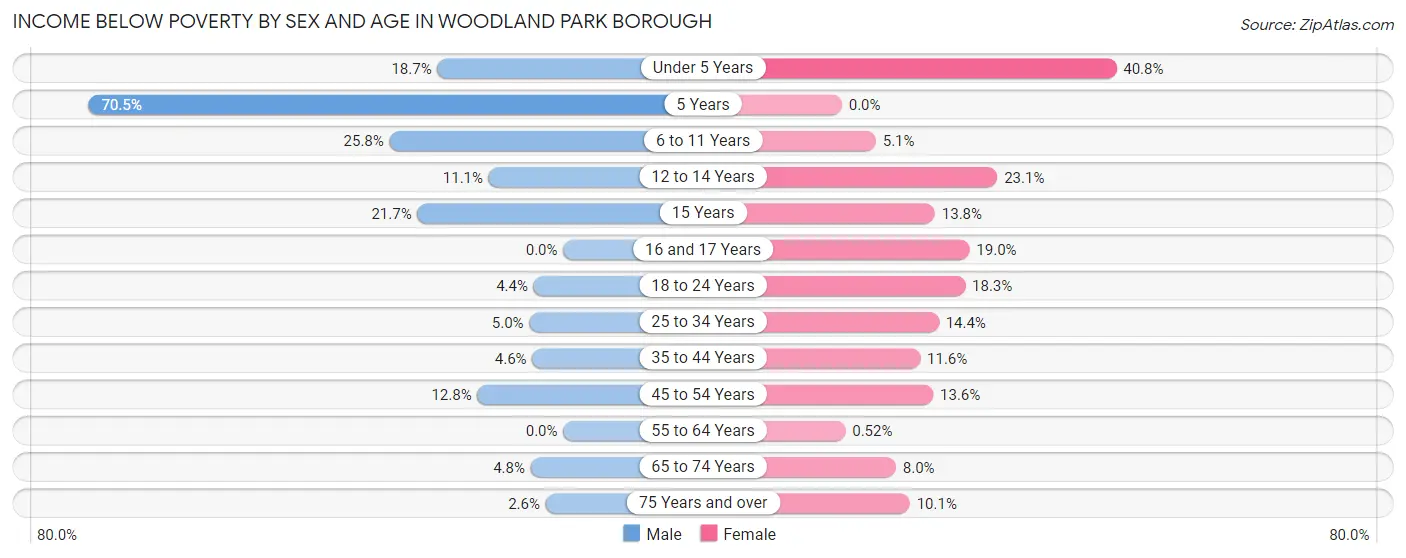
Income Below Poverty by Sex and Age in Woodland Park borough
With 8.4% poverty level for males and 12.1% for females among the residents of Woodland Park borough, 5 year old males and under 5 year old females are the most vulnerable to poverty, with 55 males (70.5%) and 183 females (40.8%) in their respective age groups living below the poverty level.
| Age Bracket | Male | Female |
| Under 5 Years | 91 (18.7%) | 183 (40.8%) |
| 5 Years | 55 (70.5%) | 0 (0.0%) |
| 6 to 11 Years | 105 (25.8%) | 15 (5.1%) |
| 12 to 14 Years | 23 (11.1%) | 12 (23.1%) |
| 15 Years | 34 (21.7%) | 17 (13.8%) |
| 16 and 17 Years | 0 (0.0%) | 36 (19.0%) |
| 18 to 24 Years | 32 (4.4%) | 106 (18.3%) |
| 25 to 34 Years | 41 (5.0%) | 102 (14.4%) |
| 35 to 44 Years | 31 (4.6%) | 75 (11.6%) |
| 45 to 54 Years | 95 (12.8%) | 123 (13.6%) |
| 55 to 64 Years | 0 (0.0%) | 6 (0.5%) |
| 65 to 74 Years | 32 (4.8%) | 61 (8.0%) |
| 75 Years and over | 15 (2.6%) | 80 (10.1%) |
| Total | 554 (8.4%) | 816 (12.1%) |
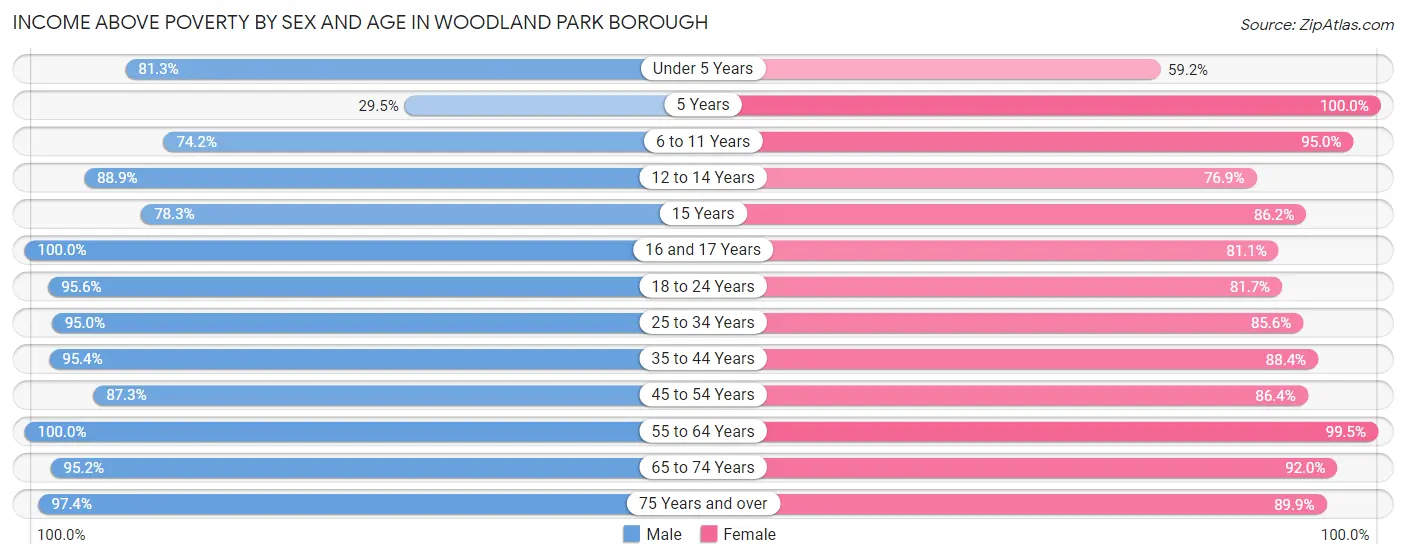
Income Above Poverty by Sex and Age in Woodland Park borough
According to the poverty statistics in Woodland Park borough, males aged 16 and 17 years and females aged 5 years are the age groups that are most secure financially, with 100.0% of males and 100.0% of females in these age groups living above the poverty line.
| Age Bracket | Male | Female |
| Under 5 Years | 396 (81.3%) | 266 (59.2%) |
| 5 Years | 23 (29.5%) | 66 (100.0%) |
| 6 to 11 Years | 302 (74.2%) | 282 (95.0%) |
| 12 to 14 Years | 185 (88.9%) | 40 (76.9%) |
| 15 Years | 123 (78.3%) | 106 (86.2%) |
| 16 and 17 Years | 150 (100.0%) | 154 (81.0%) |
| 18 to 24 Years | 697 (95.6%) | 473 (81.7%) |
| 25 to 34 Years | 772 (95.0%) | 607 (85.6%) |
| 35 to 44 Years | 644 (95.4%) | 570 (88.4%) |
| 45 to 54 Years | 650 (87.3%) | 784 (86.4%) |
| 55 to 64 Years | 888 (100.0%) | 1,138 (99.5%) |
| 65 to 74 Years | 629 (95.2%) | 699 (92.0%) |
| 75 Years and over | 559 (97.4%) | 713 (89.9%) |
| Total | 6,018 (91.6%) | 5,898 (87.8%) |
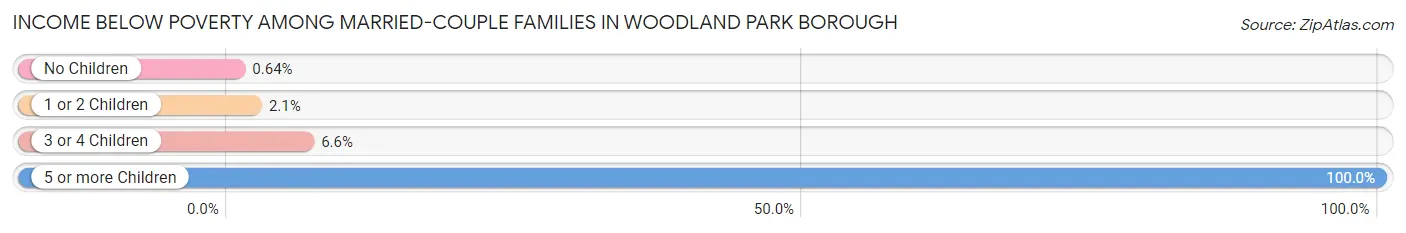
Income Below Poverty Among Married-Couple Families in Woodland Park borough
The poverty statistics for married-couple families in Woodland Park borough show that 2.4% or 57 of the total 2,430 families live below the poverty line. Families with 5 or more children have the highest poverty rate of 100.0%, comprising of 21 families. On the other hand, families with no children have the lowest poverty rate of 0.6%, which includes 10 families.
| Children | Above Poverty | Below Poverty |
| No Children | 1,546 (99.4%) | 10 (0.6%) |
| 1 or 2 Children | 658 (97.9%) | 14 (2.1%) |
| 3 or 4 Children | 169 (93.4%) | 12 (6.6%) |
| 5 or more Children | 0 (0.0%) | 21 (100.0%) |
| Total | 2,373 (97.7%) | 57 (2.4%) |
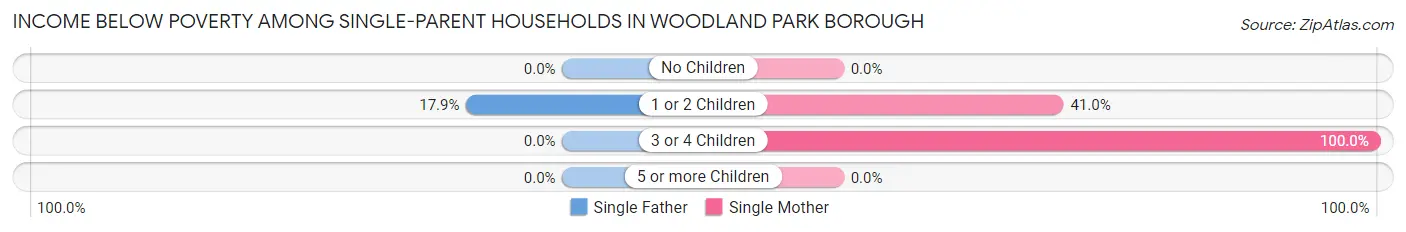
Income Below Poverty Among Single-Parent Households in Woodland Park borough
According to the poverty data in Woodland Park borough, 6.0% or 19 single-father households and 24.0% or 152 single-mother households are living below the poverty line. Among single-father households, those with 1 or 2 children have the highest poverty rate, with 19 households (17.9%) experiencing poverty. Likewise, among single-mother households, those with 3 or 4 children have the highest poverty rate, with 14 households (100.0%) falling below the poverty line.
| Children | Single Father | Single Mother |
| No Children | 0 (0.0%) | 0 (0.0%) |
| 1 or 2 Children | 19 (17.9%) | 138 (40.9%) |
| 3 or 4 Children | 0 (0.0%) | 14 (100.0%) |
| 5 or more Children | 0 (0.0%) | 0 (0.0%) |
| Total | 19 (6.0%) | 152 (24.0%) |
Income Below Poverty Among Married-Couple vs Single-Parent Households in Woodland Park borough
The poverty data for Woodland Park borough shows that 57 of the married-couple family households (2.4%) and 171 of the single-parent households (18.0%) are living below the poverty level. Within the married-couple family households, those with 5 or more children have the highest poverty rate, with 21 households (100.0%) falling below the poverty line. Among the single-parent households, those with 1 or 2 children have the highest poverty rate, with 157 household (35.4%) living below poverty.
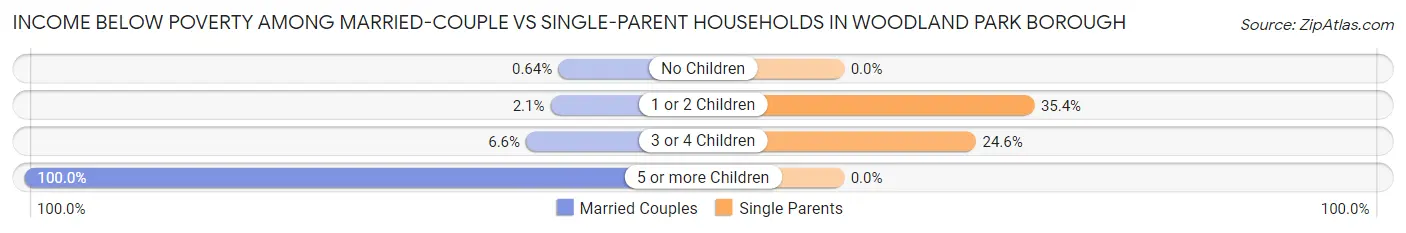
| Children | Married-Couple Families | Single-Parent Households |
| No Children | 10 (0.6%) | 0 (0.0%) |
| 1 or 2 Children | 14 (2.1%) | 157 (35.4%) |
| 3 or 4 Children | 12 (6.6%) | 14 (24.6%) |
| 5 or more Children | 21 (100.0%) | 0 (0.0%) |
| Total | 57 (2.4%) | 171 (18.0%) |
Race in Woodland Park borough
The most populous races in Woodland Park borough are White / Caucasian (9,543 | 71.8%), Hispanic or Latino (3,704 | 27.9%), and Some other Race (1,156 | 8.7%).
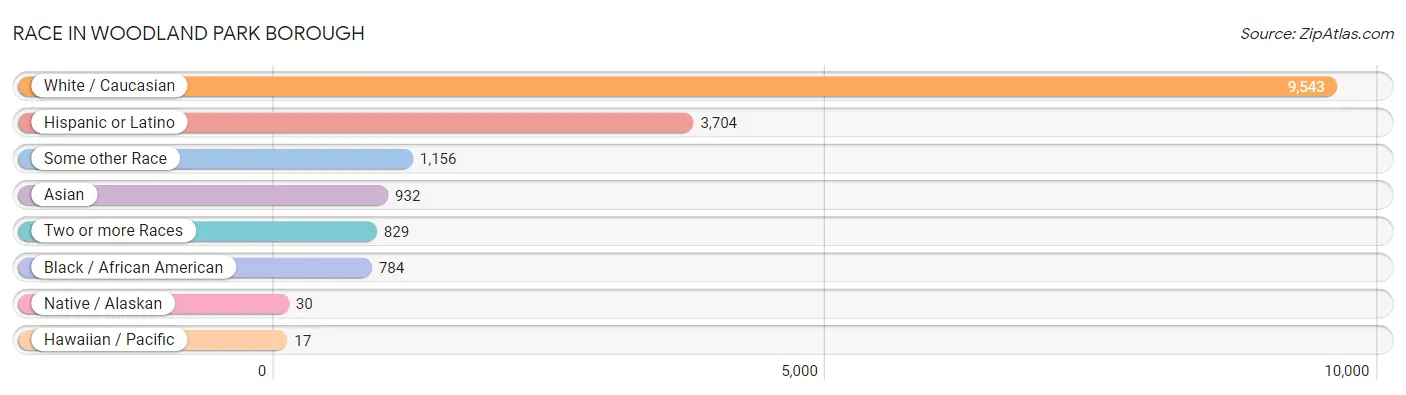
| Race | # Population | % Population |
| Asian | 932 | 7.0% |
| Black / African American | 784 | 5.9% |
| Hawaiian / Pacific | 17 | 0.1% |
| Hispanic or Latino | 3,704 | 27.9% |
| Native / Alaskan | 30 | 0.2% |
| White / Caucasian | 9,543 | 71.8% |
| Two or more Races | 829 | 6.2% |
| Some other Race | 1,156 | 8.7% |
| Total | 13,291 | 100.0% |
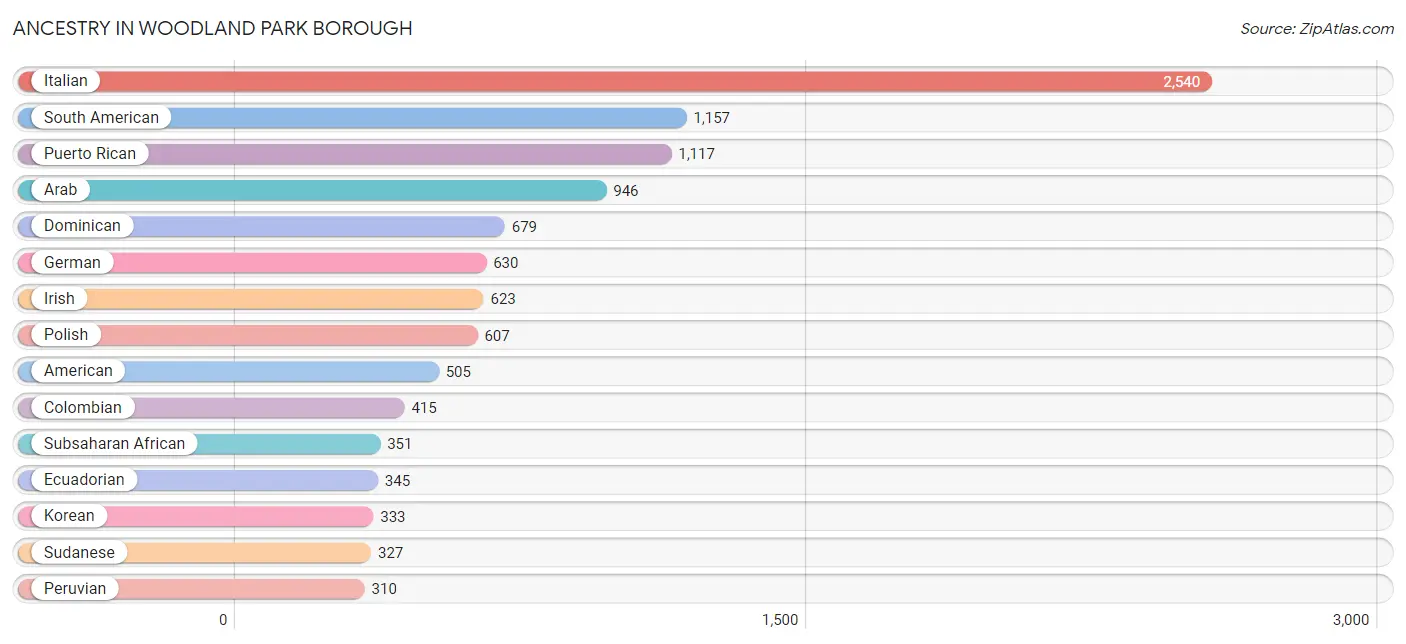
Ancestry in Woodland Park borough
The most populous ancestries reported in Woodland Park borough are Italian (2,540 | 19.1%), South American (1,157 | 8.7%), Puerto Rican (1,117 | 8.4%), Arab (946 | 7.1%), and Dominican (679 | 5.1%), together accounting for 48.4% of all Woodland Park borough residents.
| Ancestry | # Population | % Population |
| Afghan | 140 | 1.1% |
| African | 44 | 0.3% |
| American | 505 | 3.8% |
| Arab | 946 | 7.1% |
| Argentinean | 9 | 0.1% |
| Armenian | 15 | 0.1% |
| Austrian | 18 | 0.1% |
| Belgian | 24 | 0.2% |
| Brazilian | 17 | 0.1% |
| British | 47 | 0.4% |
| Burmese | 107 | 0.8% |
| Central American | 152 | 1.1% |
| Central American Indian | 27 | 0.2% |
| Colombian | 415 | 3.1% |
| Costa Rican | 92 | 0.7% |
| Cuban | 129 | 1.0% |
| Czech | 41 | 0.3% |
| Czechoslovakian | 15 | 0.1% |
| Dominican | 679 | 5.1% |
| Dutch | 248 | 1.9% |
| Eastern European | 150 | 1.1% |
| Ecuadorian | 345 | 2.6% |
| Egyptian | 33 | 0.3% |
| English | 205 | 1.5% |
| European | 13 | 0.1% |
| Filipino | 95 | 0.7% |
| French Canadian | 11 | 0.1% |
| German | 630 | 4.7% |
| Greek | 59 | 0.4% |
| Guatemalan | 21 | 0.2% |
| Hungarian | 106 | 0.8% |
| Indian (Asian) | 116 | 0.9% |
| Iranian | 50 | 0.4% |
| Iraqi | 41 | 0.3% |
| Irish | 623 | 4.7% |
| Italian | 2,540 | 19.1% |
| Jamaican | 58 | 0.4% |
| Jordanian | 210 | 1.6% |
| Korean | 333 | 2.5% |
| Laotian | 33 | 0.3% |
| Lebanese | 271 | 2.0% |
| Lithuanian | 1 | 0.0% |
| Macedonian | 188 | 1.4% |
| Mexican | 289 | 2.2% |
| Native Hawaiian | 78 | 0.6% |
| Nicaraguan | 39 | 0.3% |
| Norwegian | 14 | 0.1% |
| Palestinian | 207 | 1.6% |
| Peruvian | 310 | 2.3% |
| Polish | 607 | 4.6% |
| Portuguese | 78 | 0.6% |
| Puerto Rican | 1,117 | 8.4% |
| Romanian | 17 | 0.1% |
| Russian | 120 | 0.9% |
| Scotch-Irish | 192 | 1.4% |
| Scottish | 93 | 0.7% |
| Slavic | 16 | 0.1% |
| Slovak | 78 | 0.6% |
| South American | 1,157 | 8.7% |
| Spaniard | 20 | 0.2% |
| Subsaharan African | 351 | 2.6% |
| Sudanese | 327 | 2.5% |
| Swedish | 25 | 0.2% |
| Swiss | 15 | 0.1% |
| Syrian | 140 | 1.1% |
| Thai | 247 | 1.9% |
| Trinidadian and Tobagonian | 18 | 0.1% |
| Turkish | 264 | 2.0% |
| Ukrainian | 166 | 1.3% |
| Uruguayan | 78 | 0.6% |
| Welsh | 158 | 1.2% | View All 71 Rows |
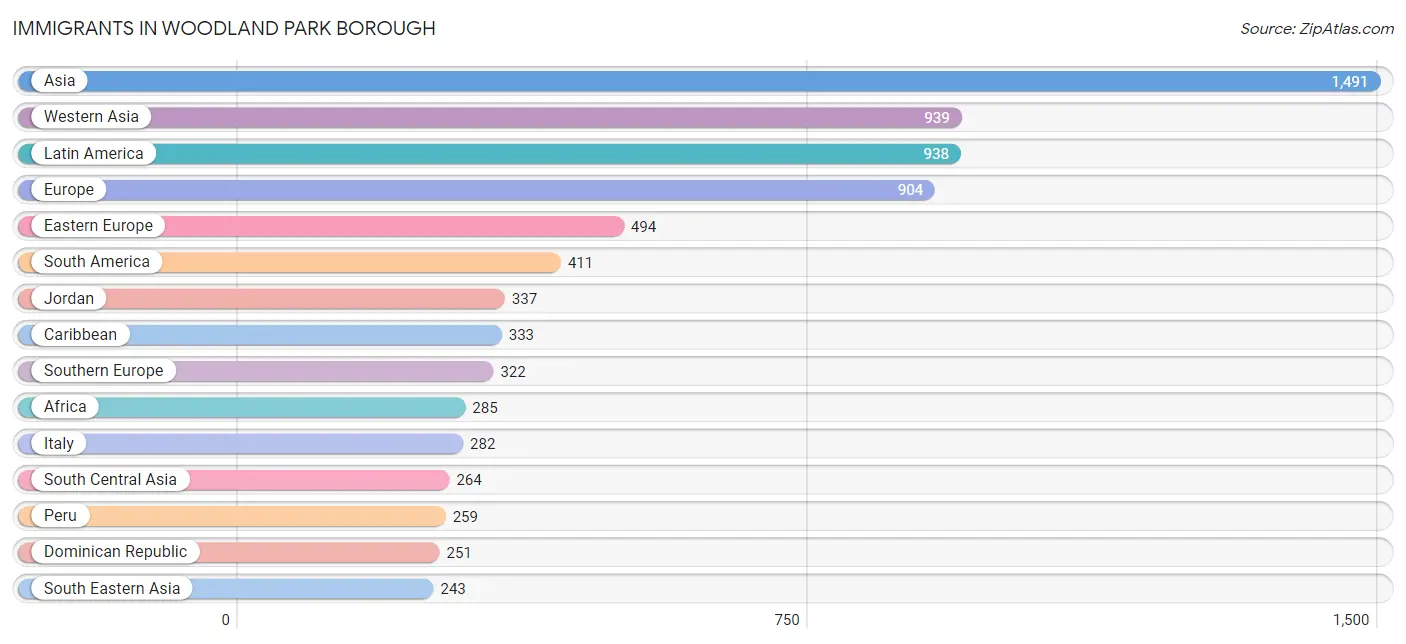
Immigrants in Woodland Park borough
The most numerous immigrant groups reported in Woodland Park borough came from Asia (1,491 | 11.2%), Western Asia (939 | 7.1%), Latin America (938 | 7.1%), Europe (904 | 6.8%), and Eastern Europe (494 | 3.7%), together accounting for 35.9% of all Woodland Park borough residents.
| Immigration Origin | # Population | % Population |
| Afghanistan | 65 | 0.5% |
| Africa | 285 | 2.1% |
| Asia | 1,491 | 11.2% |
| Caribbean | 333 | 2.5% |
| Central America | 194 | 1.5% |
| Colombia | 68 | 0.5% |
| Cuba | 64 | 0.5% |
| Czechoslovakia | 31 | 0.2% |
| Dominican Republic | 251 | 1.9% |
| Eastern Africa | 57 | 0.4% |
| Eastern Europe | 494 | 3.7% |
| Ecuador | 54 | 0.4% |
| Egypt | 33 | 0.3% |
| England | 19 | 0.1% |
| Europe | 904 | 6.8% |
| Germany | 9 | 0.1% |
| Hungary | 17 | 0.1% |
| India | 128 | 1.0% |
| Indonesia | 12 | 0.1% |
| Iran | 31 | 0.2% |
| Iraq | 90 | 0.7% |
| Ireland | 11 | 0.1% |
| Italy | 282 | 2.1% |
| Jordan | 337 | 2.5% |
| Latin America | 938 | 7.1% |
| Lebanon | 176 | 1.3% |
| Mexico | 194 | 1.5% |
| Netherlands | 49 | 0.4% |
| North Macedonia | 172 | 1.3% |
| Northern Africa | 228 | 1.7% |
| Northern Europe | 30 | 0.2% |
| Pakistan | 39 | 0.3% |
| Peru | 259 | 1.9% |
| Philippines | 211 | 1.6% |
| Poland | 174 | 1.3% |
| Romania | 17 | 0.1% |
| South America | 411 | 3.1% |
| South Central Asia | 264 | 2.0% |
| South Eastern Asia | 243 | 1.8% |
| Southern Europe | 322 | 2.4% |
| Spain | 40 | 0.3% |
| Sri Lanka | 1 | 0.0% |
| Sudan | 184 | 1.4% |
| Syria | 107 | 0.8% |
| Thailand | 20 | 0.2% |
| Trinidad and Tobago | 18 | 0.1% |
| Turkey | 139 | 1.1% |
| Uganda | 36 | 0.3% |
| Ukraine | 83 | 0.6% |
| Uruguay | 30 | 0.2% |
| Western Asia | 939 | 7.1% |
| Western Europe | 58 | 0.4% |
| Yemen | 11 | 0.1% | View All 53 Rows |
Sex and Age in Woodland Park borough
Sex and Age in Woodland Park borough
The most populous age groups in Woodland Park borough are 20 to 24 Years (527 | 8.0%) for men and 55 to 59 Years (696 | 10.4%) for women.
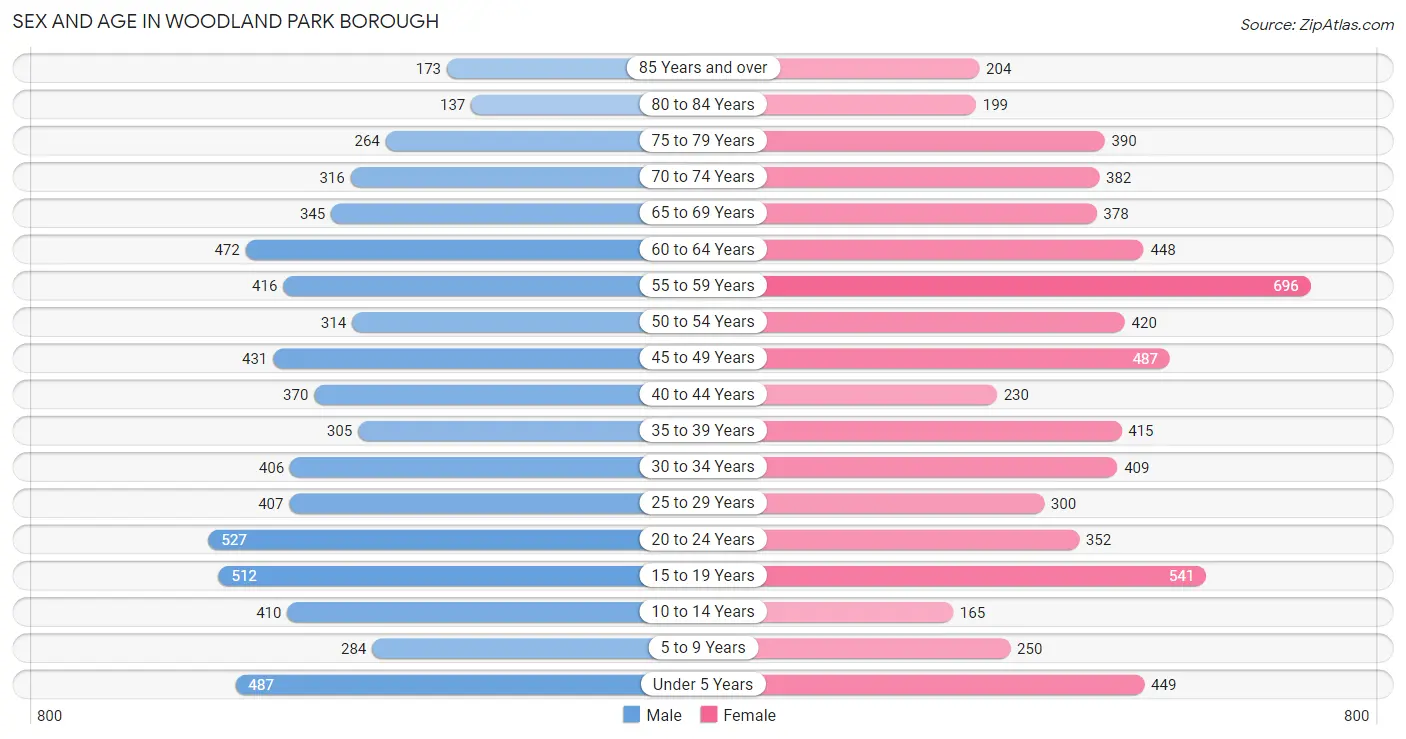
| Age Bracket | Male | Female |
| Under 5 Years | 487 (7.4%) | 449 (6.7%) |
| 5 to 9 Years | 284 (4.3%) | 250 (3.7%) |
| 10 to 14 Years | 410 (6.2%) | 165 (2.5%) |
| 15 to 19 Years | 512 (7.8%) | 541 (8.1%) |
| 20 to 24 Years | 527 (8.0%) | 352 (5.2%) |
| 25 to 29 Years | 407 (6.2%) | 300 (4.5%) |
| 30 to 34 Years | 406 (6.2%) | 409 (6.1%) |
| 35 to 39 Years | 305 (4.6%) | 415 (6.2%) |
| 40 to 44 Years | 370 (5.6%) | 230 (3.4%) |
| 45 to 49 Years | 431 (6.6%) | 487 (7.2%) |
| 50 to 54 Years | 314 (4.8%) | 420 (6.2%) |
| 55 to 59 Years | 416 (6.3%) | 696 (10.4%) |
| 60 to 64 Years | 472 (7.2%) | 448 (6.7%) |
| 65 to 69 Years | 345 (5.2%) | 378 (5.6%) |
| 70 to 74 Years | 316 (4.8%) | 382 (5.7%) |
| 75 to 79 Years | 264 (4.0%) | 390 (5.8%) |
| 80 to 84 Years | 137 (2.1%) | 199 (3.0%) |
| 85 Years and over | 173 (2.6%) | 204 (3.0%) |
| Total | 6,576 (100.0%) | 6,715 (100.0%) |
Families and Households in Woodland Park borough
Median Family Size in Woodland Park borough
The median family size in Woodland Park borough is 3.19 persons per family, with married-couple families (2,430 | 71.9%) accounting for the largest median family size of 3.31 persons per family. On the other hand, single female/mother families (634 | 18.8%) represent the smallest median family size with 2.89 persons per family.
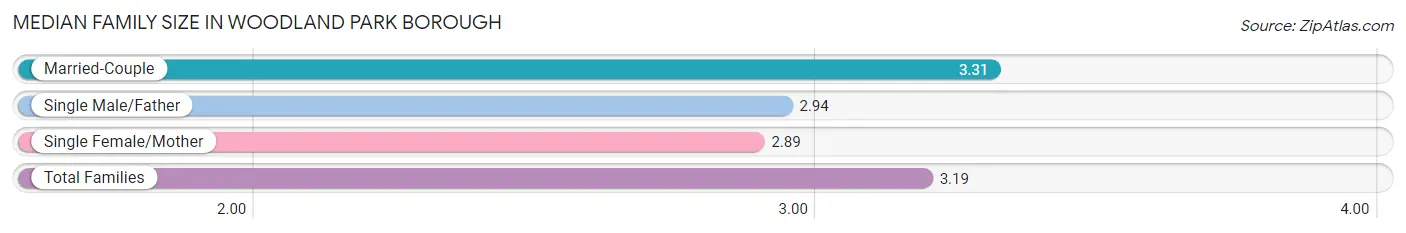
| Family Type | # Families | Family Size |
| Married-Couple | 2,430 (71.9%) | 3.31 |
| Single Male/Father | 315 (9.3%) | 2.94 |
| Single Female/Mother | 634 (18.8%) | 2.89 |
| Total Families | 3,379 (100.0%) | 3.19 |
Median Household Size in Woodland Park borough
The median household size in Woodland Park borough is 2.51 persons per household, with married-couple households (2,430 | 45.9%) accounting for the largest median household size of 3.32 persons per household. non-family households (1,915 | 36.2%) represent the smallest median household size with 1.13 persons per household.
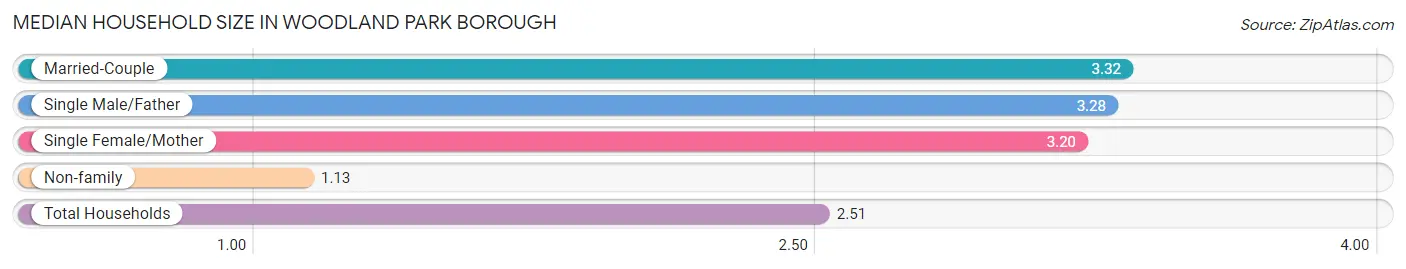
| Household Type | # Households | Household Size |
| Married-Couple | 2,430 (45.9%) | 3.32 |
| Single Male/Father | 315 (5.9%) | 3.28 |
| Single Female/Mother | 634 (12.0%) | 3.20 |
| Non-family | 1,915 (36.2%) | 1.13 |
| Total Households | 5,294 (100.0%) | 2.51 |
Household Size by Marriage Status in Woodland Park borough
Out of a total of 5,294 households in Woodland Park borough, 3,379 (63.8%) are family households, while 1,915 (36.2%) are nonfamily households. The most numerous type of family households are 2-person households, comprising 1,448, and the most common type of nonfamily households are 1-person households, comprising 1,657.
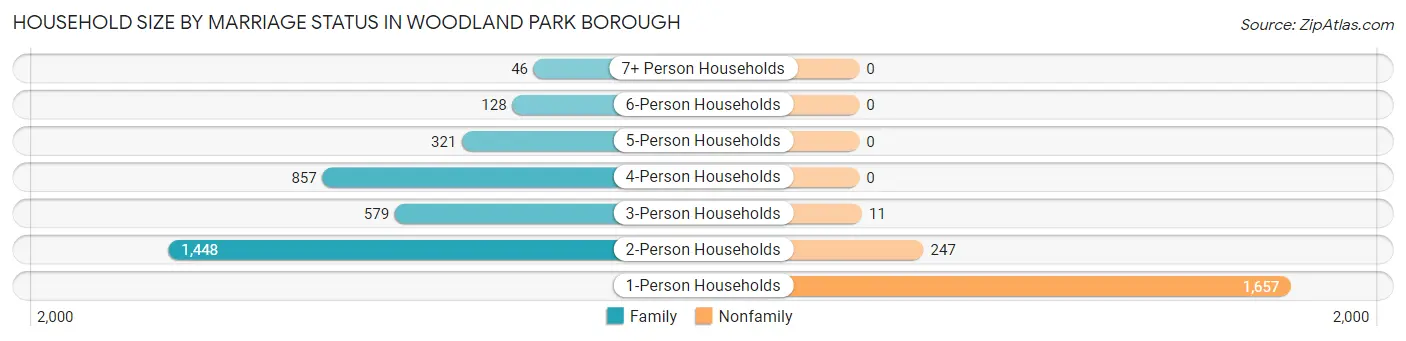
| Household Size | Family Households | Nonfamily Households |
| 1-Person Households | - | 1,657 (31.3%) |
| 2-Person Households | 1,448 (27.4%) | 247 (4.7%) |
| 3-Person Households | 579 (10.9%) | 11 (0.2%) |
| 4-Person Households | 857 (16.2%) | 0 (0.0%) |
| 5-Person Households | 321 (6.1%) | 0 (0.0%) |
| 6-Person Households | 128 (2.4%) | 0 (0.0%) |
| 7+ Person Households | 46 (0.9%) | 0 (0.0%) |
| Total | 3,379 (63.8%) | 1,915 (36.2%) |
Female Fertility in Woodland Park borough
Fertility by Age in Woodland Park borough
Average fertility rate in Woodland Park borough is 55.0 births per 1,000 women. Women in the age bracket of 35 to 50 years have the highest fertility rate with 100.0 births per 1,000 women. Women in the age bracket of 35 to 50 years acount for 76.3% of all women with births.
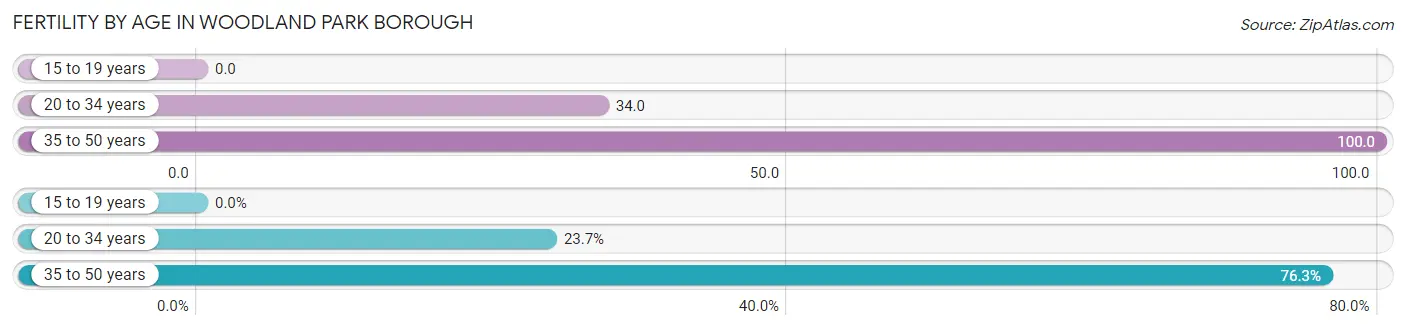
| Age Bracket | Women with Births | Births / 1,000 Women |
| 15 to 19 years | 0 (0.0%) | 0.0 |
| 20 to 34 years | 36 (23.7%) | 34.0 |
| 35 to 50 years | 116 (76.3%) | 100.0 |
| Total | 152 (100.0%) | 55.0 |
Fertility by Age by Marriage Status in Woodland Park borough
47.4% of women with births (152) in Woodland Park borough are married. The highest percentage of unmarried women with births falls into 20 to 34 years age bracket with 100.0% of them unmarried at the time of birth, while the lowest percentage of unmarried women with births belong to 35 to 50 years age bracket with 37.9% of them unmarried.
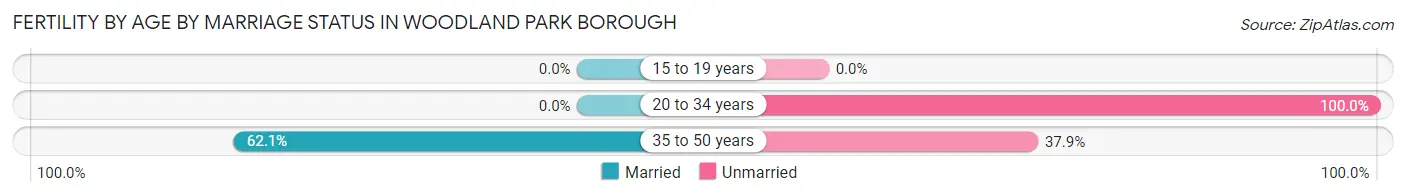
| Age Bracket | Married | Unmarried |
| 15 to 19 years | 0 (0.0%) | 0 (0.0%) |
| 20 to 34 years | 0 (0.0%) | 36 (100.0%) |
| 35 to 50 years | 72 (62.1%) | 44 (37.9%) |
| Total | 72 (47.4%) | 80 (52.6%) |
Fertility by Education in Woodland Park borough
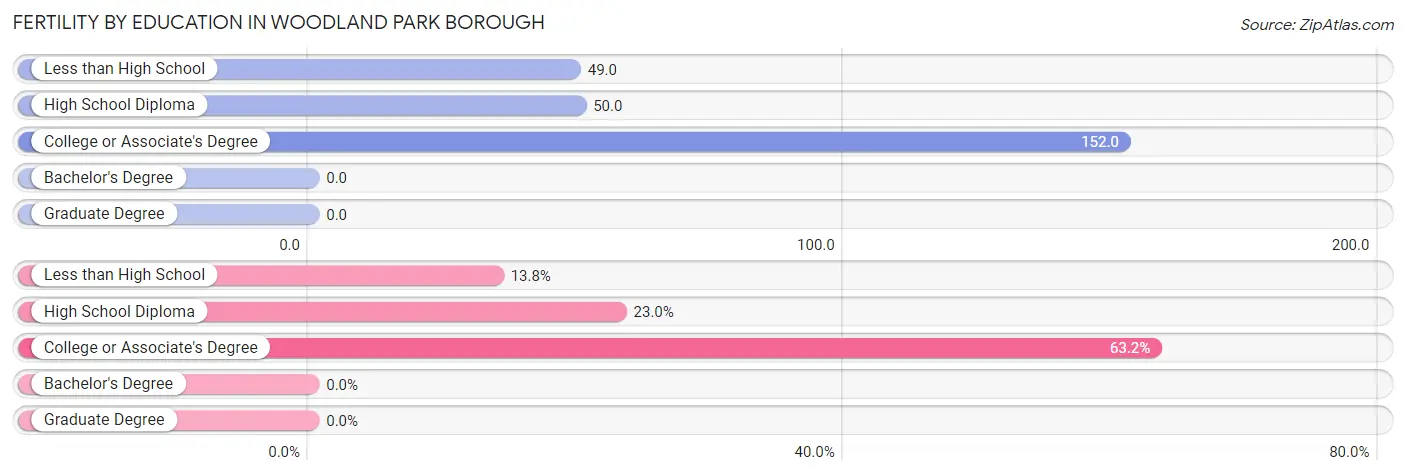
| Educational Attainment | Women with Births | Births / 1,000 Women |
| Less than High School | 21 (13.8%) | 49.0 |
| High School Diploma | 35 (23.0%) | 50.0 |
| College or Associate's Degree | 96 (63.2%) | 152.0 |
| Bachelor's Degree | 0 (0.0%) | 0.0 |
| Graduate Degree | 0 (0.0%) | 0.0 |
| Total | 152 (100.0%) | 55.0 |
Fertility by Education by Marriage Status in Woodland Park borough
52.6% of women with births in Woodland Park borough are unmarried. Women with the educational attainment of less than high school are most likely to be married with 100.0% of them married at childbirth, while women with the educational attainment of high school diploma are least likely to be married with 100.0% of them unmarried at childbirth.
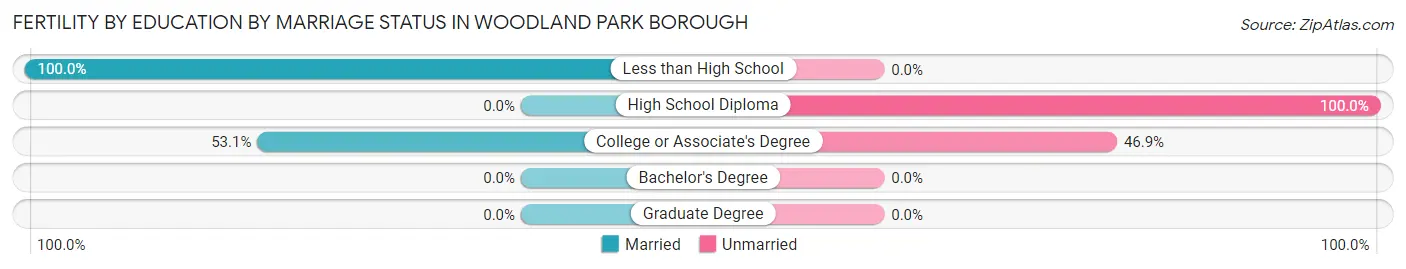
| Educational Attainment | Married | Unmarried |
| Less than High School | 21 (100.0%) | 0 (0.0%) |
| High School Diploma | 0 (0.0%) | 35 (100.0%) |
| College or Associate's Degree | 51 (53.1%) | 45 (46.9%) |
| Bachelor's Degree | 0 (0.0%) | 0 (0.0%) |
| Graduate Degree | 0 (0.0%) | 0 (0.0%) |
| Total | 72 (47.4%) | 80 (52.6%) |
Employment Characteristics in Woodland Park borough
Employment by Class of Employer in Woodland Park borough
Among the 6,318 employed individuals in Woodland Park borough, private company employees (4,672 | 74.0%), self-employed (not incorporated) (459 | 7.3%), and local government employees (420 | 6.7%) make up the most common classes of employment.
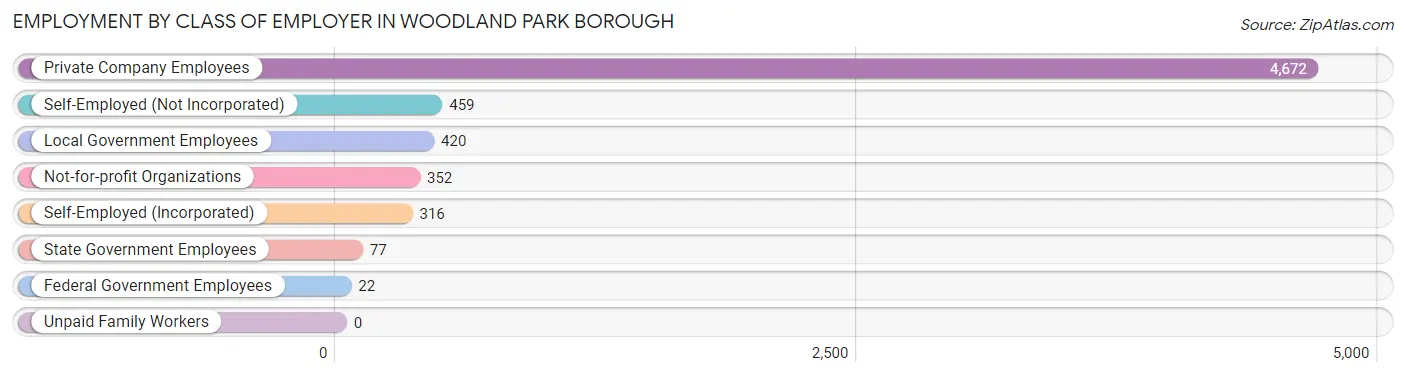
| Employer Class | # Employees | % Employees |
| Private Company Employees | 4,672 | 74.0% |
| Self-Employed (Incorporated) | 316 | 5.0% |
| Self-Employed (Not Incorporated) | 459 | 7.3% |
| Not-for-profit Organizations | 352 | 5.6% |
| Local Government Employees | 420 | 6.7% |
| State Government Employees | 77 | 1.2% |
| Federal Government Employees | 22 | 0.4% |
| Unpaid Family Workers | 0 | 0.0% |
| Total | 6,318 | 100.0% |
Employment Status by Age in Woodland Park borough
According to the labor force statistics for Woodland Park borough, out of the total population over 16 years of age (10,966), 63.5% or 6,963 individuals are in the labor force, with 6.1% or 425 of them unemployed. The age group with the highest labor force participation rate is 35 to 44 years, with 93.2% or 1,230 individuals in the labor force. Within the labor force, the 55 to 59 years age range has the highest percentage of unemployed individuals, with 16.7% or 156 of them being unemployed.
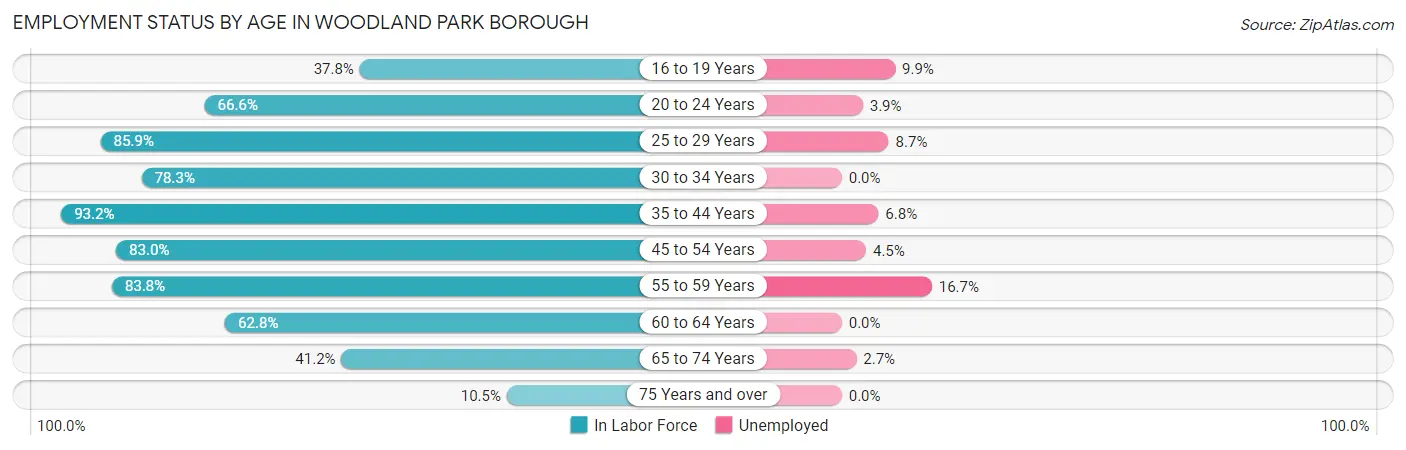
| Age Bracket | In Labor Force | Unemployed |
| 16 to 19 Years | 292 (37.8%) | 29 (9.9%) |
| 20 to 24 Years | 585 (66.6%) | 23 (3.9%) |
| 25 to 29 Years | 607 (85.9%) | 53 (8.7%) |
| 30 to 34 Years | 638 (78.3%) | 0 (0.0%) |
| 35 to 44 Years | 1,230 (93.2%) | 84 (6.8%) |
| 45 to 54 Years | 1,371 (83.0%) | 62 (4.5%) |
| 55 to 59 Years | 932 (83.8%) | 156 (16.7%) |
| 60 to 64 Years | 578 (62.8%) | 0 (0.0%) |
| 65 to 74 Years | 585 (41.2%) | 16 (2.7%) |
| 75 Years and over | 144 (10.5%) | 0 (0.0%) |
| Total | 6,963 (63.5%) | 425 (6.1%) |
Employment Status by Educational Attainment in Woodland Park borough
According to labor force statistics for Woodland Park borough, 82.1% of individuals (5,358) out of the total population between 25 and 64 years of age (6,526) are in the labor force, with 6.6% or 354 of them being unemployed. The group with the highest labor force participation rate are those with the educational attainment of bachelor's degree or higher, with 86.2% or 2,193 individuals in the labor force. Within the labor force, individuals with college / associate degree education have the highest percentage of unemployment, with 12.1% or 171 of them being unemployed.
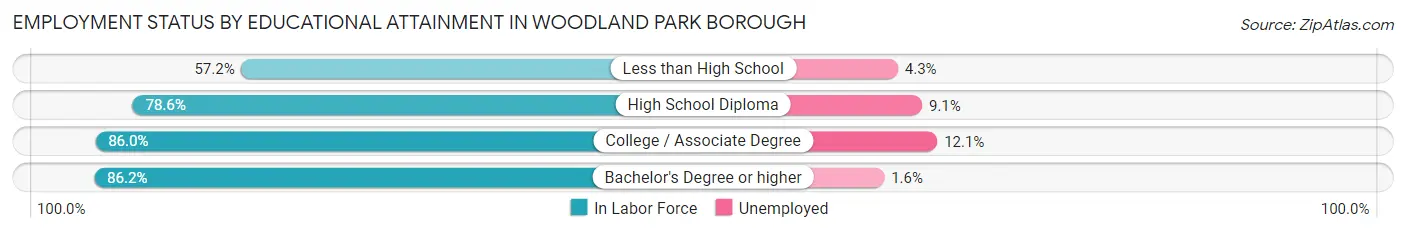
| Educational Attainment | In Labor Force | Unemployed |
| Less than High School | 233 (57.2%) | 18 (4.3%) |
| High School Diploma | 1,522 (78.6%) | 176 (9.1%) |
| College / Associate Degree | 1,410 (86.0%) | 198 (12.1%) |
| Bachelor's Degree or higher | 2,193 (86.2%) | 41 (1.6%) |
| Total | 5,358 (82.1%) | 431 (6.6%) |
Employment Occupations by Sex in Woodland Park borough
Management, Business, Science and Arts Occupations
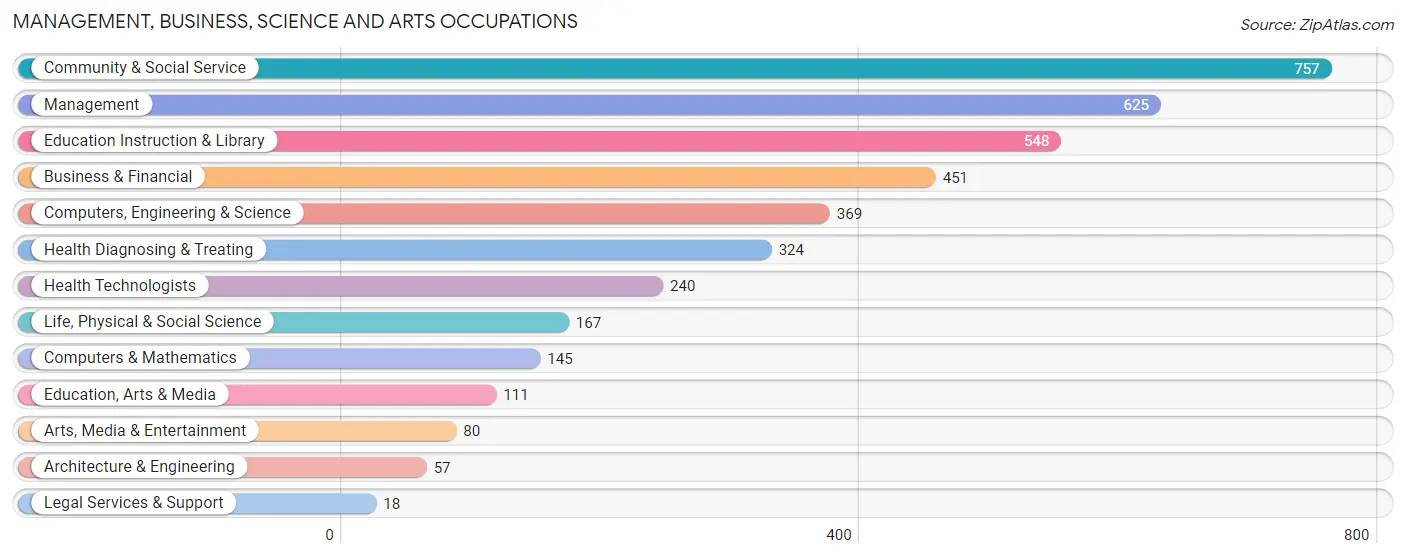
The most common Management, Business, Science and Arts occupations in Woodland Park borough are Community & Social Service (757 | 11.6%), Management (625 | 9.6%), Education Instruction & Library (548 | 8.4%), Business & Financial (451 | 6.9%), and Computers, Engineering & Science (369 | 5.6%).
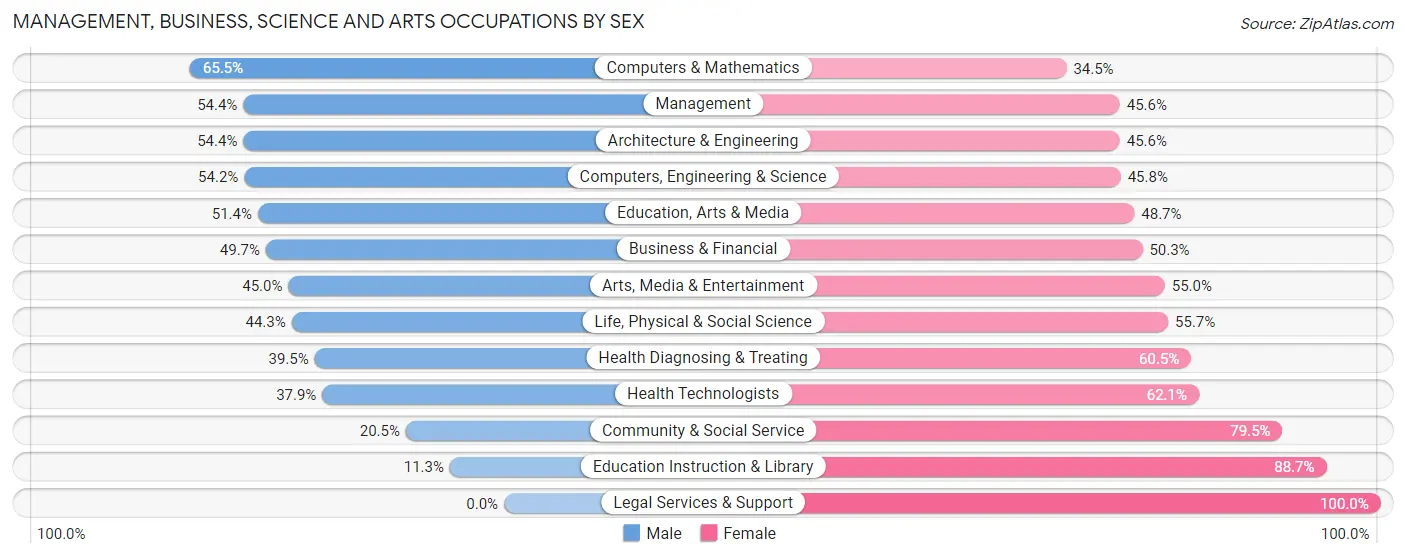
Management, Business, Science and Arts Occupations by Sex
Within the Management, Business, Science and Arts occupations in Woodland Park borough, the most male-oriented occupations are Computers & Mathematics (65.5%), Management (54.4%), and Architecture & Engineering (54.4%), while the most female-oriented occupations are Legal Services & Support (100.0%), Education Instruction & Library (88.7%), and Community & Social Service (79.5%).
| Occupation | Male | Female |
| Management | 340 (54.4%) | 285 (45.6%) |
| Business & Financial | 224 (49.7%) | 227 (50.3%) |
| Computers, Engineering & Science | 200 (54.2%) | 169 (45.8%) |
| Computers & Mathematics | 95 (65.5%) | 50 (34.5%) |
| Architecture & Engineering | 31 (54.4%) | 26 (45.6%) |
| Life, Physical & Social Science | 74 (44.3%) | 93 (55.7%) |
| Community & Social Service | 155 (20.5%) | 602 (79.5%) |
| Education, Arts & Media | 57 (51.3%) | 54 (48.6%) |
| Legal Services & Support | 0 (0.0%) | 18 (100.0%) |
| Education Instruction & Library | 62 (11.3%) | 486 (88.7%) |
| Arts, Media & Entertainment | 36 (45.0%) | 44 (55.0%) |
| Health Diagnosing & Treating | 128 (39.5%) | 196 (60.5%) |
| Health Technologists | 91 (37.9%) | 149 (62.1%) |
| Total (Category) | 1,047 (41.4%) | 1,479 (58.6%) |
| Total (Overall) | 3,431 (52.5%) | 3,107 (47.5%) |
Services Occupations
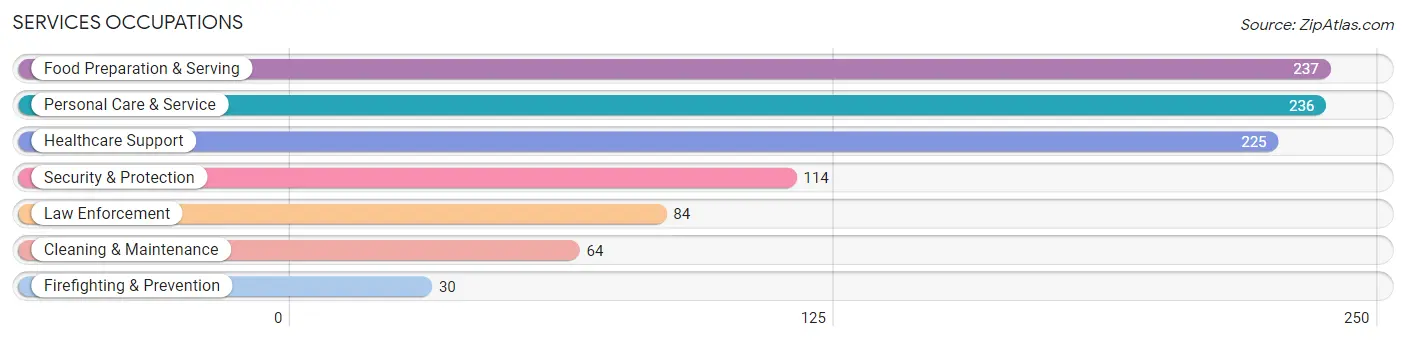
The most common Services occupations in Woodland Park borough are Food Preparation & Serving (237 | 3.6%), Personal Care & Service (236 | 3.6%), Healthcare Support (225 | 3.4%), Security & Protection (114 | 1.7%), and Law Enforcement (84 | 1.3%).
Services Occupations by Sex
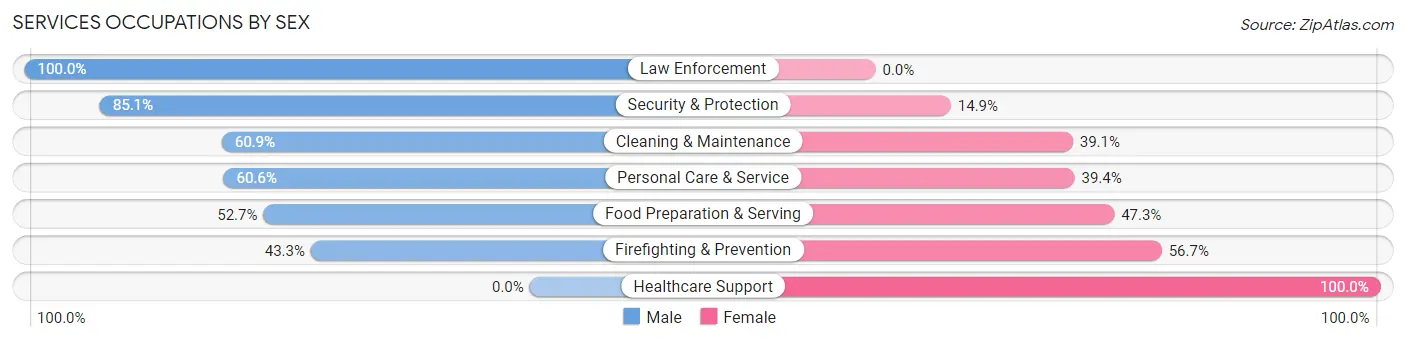
Within the Services occupations in Woodland Park borough, the most male-oriented occupations are Law Enforcement (100.0%), Security & Protection (85.1%), and Cleaning & Maintenance (60.9%), while the most female-oriented occupations are Healthcare Support (100.0%), Firefighting & Prevention (56.7%), and Food Preparation & Serving (47.3%).
| Occupation | Male | Female |
| Healthcare Support | 0 (0.0%) | 225 (100.0%) |
| Security & Protection | 97 (85.1%) | 17 (14.9%) |
| Firefighting & Prevention | 13 (43.3%) | 17 (56.7%) |
| Law Enforcement | 84 (100.0%) | 0 (0.0%) |
| Food Preparation & Serving | 125 (52.7%) | 112 (47.3%) |
| Cleaning & Maintenance | 39 (60.9%) | 25 (39.1%) |
| Personal Care & Service | 143 (60.6%) | 93 (39.4%) |
| Total (Category) | 404 (46.1%) | 472 (53.9%) |
| Total (Overall) | 3,431 (52.5%) | 3,107 (47.5%) |
Sales and Office Occupations
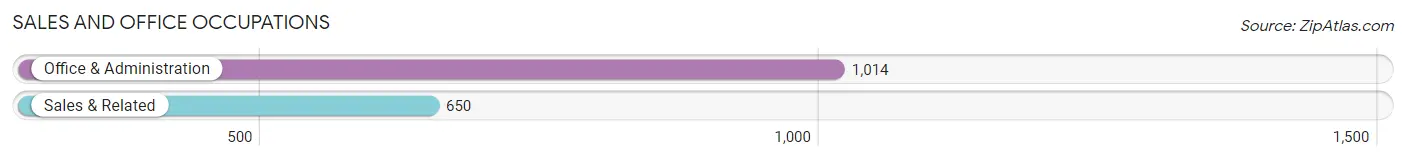
The most common Sales and Office occupations in Woodland Park borough are Office & Administration (1,014 | 15.5%), and Sales & Related (650 | 9.9%).
Sales and Office Occupations by Sex
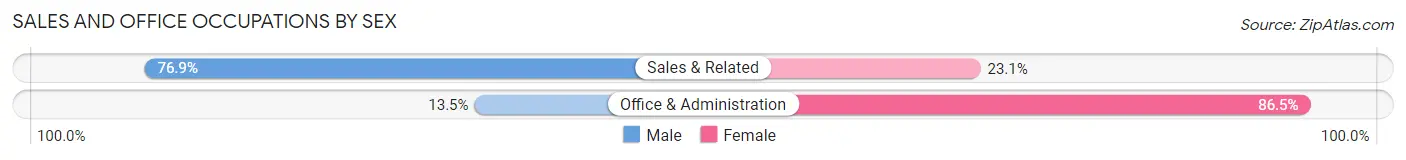
| Occupation | Male | Female |
| Sales & Related | 500 (76.9%) | 150 (23.1%) |
| Office & Administration | 137 (13.5%) | 877 (86.5%) |
| Total (Category) | 637 (38.3%) | 1,027 (61.7%) |
| Total (Overall) | 3,431 (52.5%) | 3,107 (47.5%) |
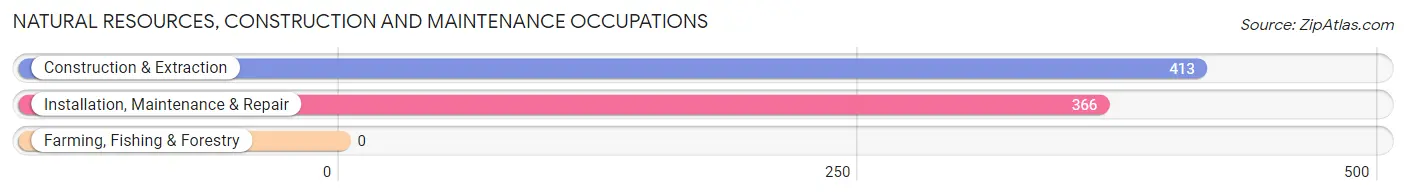
Natural Resources, Construction and Maintenance Occupations
The most common Natural Resources, Construction and Maintenance occupations in Woodland Park borough are Construction & Extraction (413 | 6.3%), and Installation, Maintenance & Repair (366 | 5.6%).
Natural Resources, Construction and Maintenance Occupations by Sex
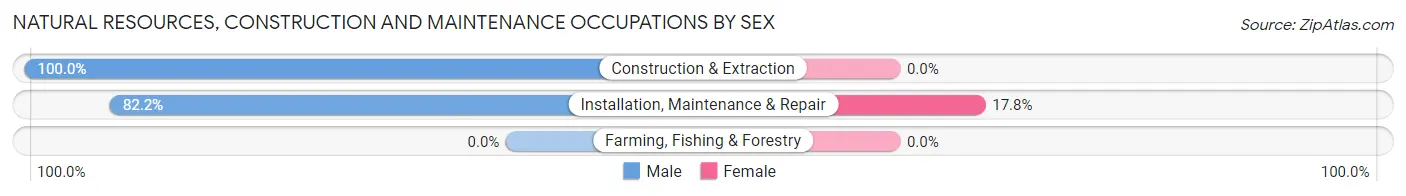
| Occupation | Male | Female |
| Farming, Fishing & Forestry | 0 (0.0%) | 0 (0.0%) |
| Construction & Extraction | 413 (100.0%) | 0 (0.0%) |
| Installation, Maintenance & Repair | 301 (82.2%) | 65 (17.8%) |
| Total (Category) | 714 (91.7%) | 65 (8.3%) |
| Total (Overall) | 3,431 (52.5%) | 3,107 (47.5%) |
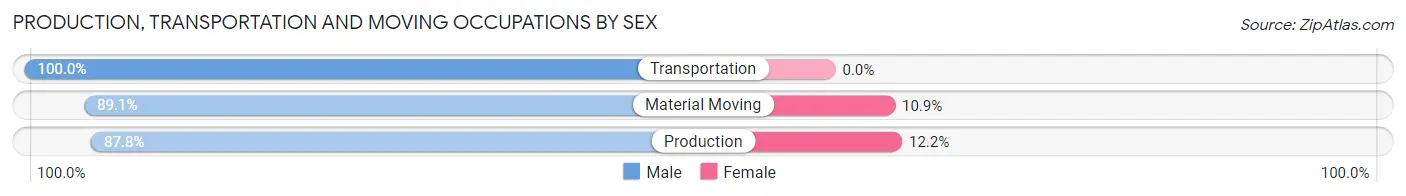
Production, Transportation and Moving Occupations
The most common Production, Transportation and Moving occupations in Woodland Park borough are Production (418 | 6.4%), Transportation (156 | 2.4%), and Material Moving (119 | 1.8%).
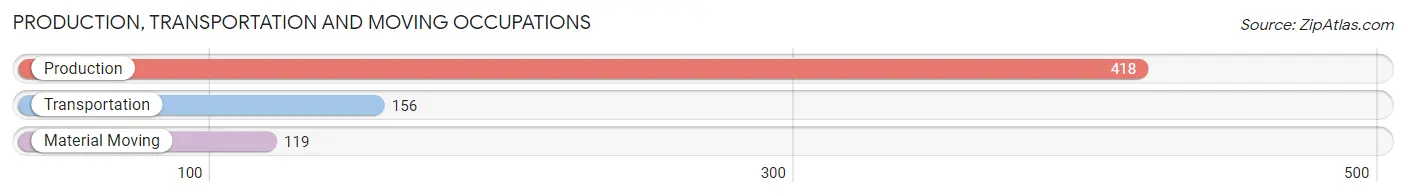
Production, Transportation and Moving Occupations by Sex
| Occupation | Male | Female |
| Production | 367 (87.8%) | 51 (12.2%) |
| Transportation | 156 (100.0%) | 0 (0.0%) |
| Material Moving | 106 (89.1%) | 13 (10.9%) |
| Total (Category) | 629 (90.8%) | 64 (9.2%) |
| Total (Overall) | 3,431 (52.5%) | 3,107 (47.5%) |
Employment Industries by Sex in Woodland Park borough
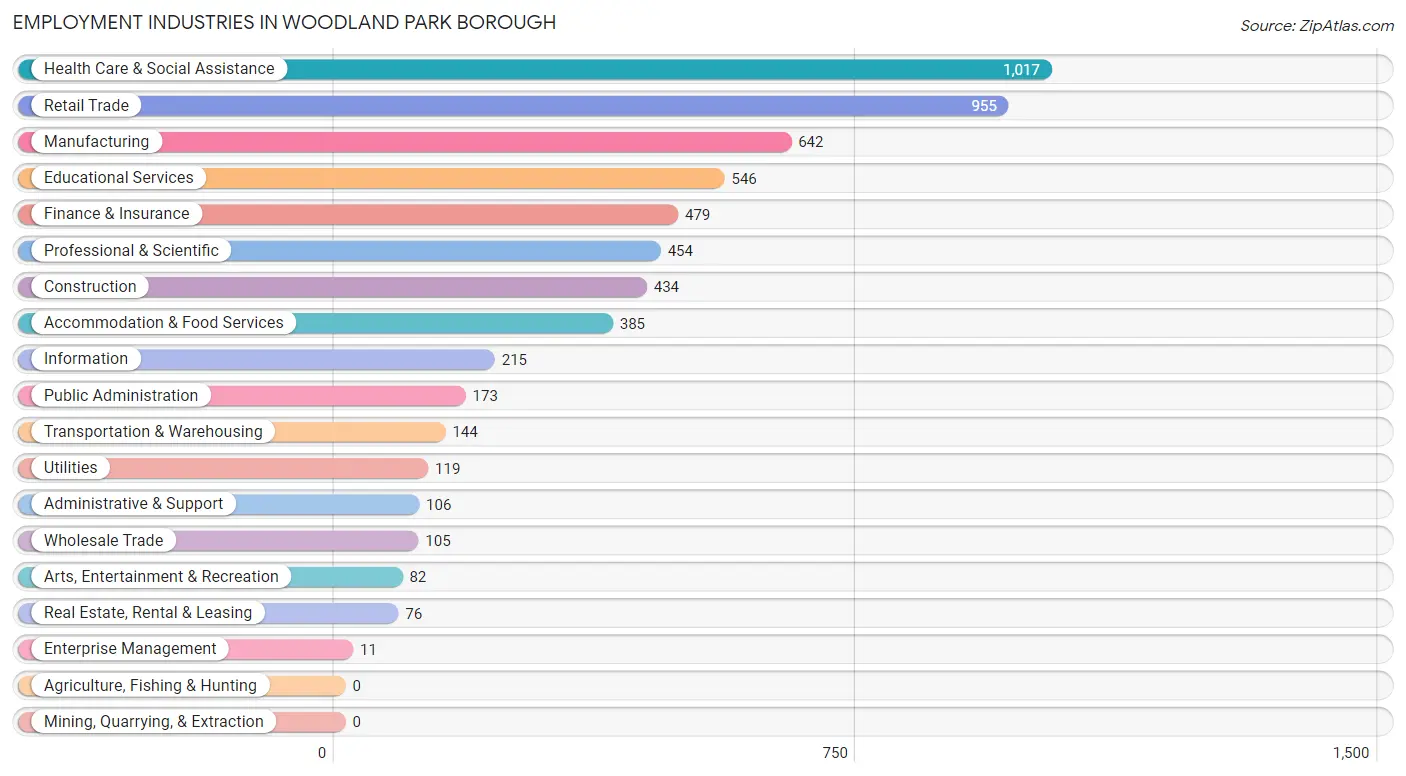
Employment Industries in Woodland Park borough
The major employment industries in Woodland Park borough include Health Care & Social Assistance (1,017 | 15.6%), Retail Trade (955 | 14.6%), Manufacturing (642 | 9.8%), Educational Services (546 | 8.4%), and Finance & Insurance (479 | 7.3%).
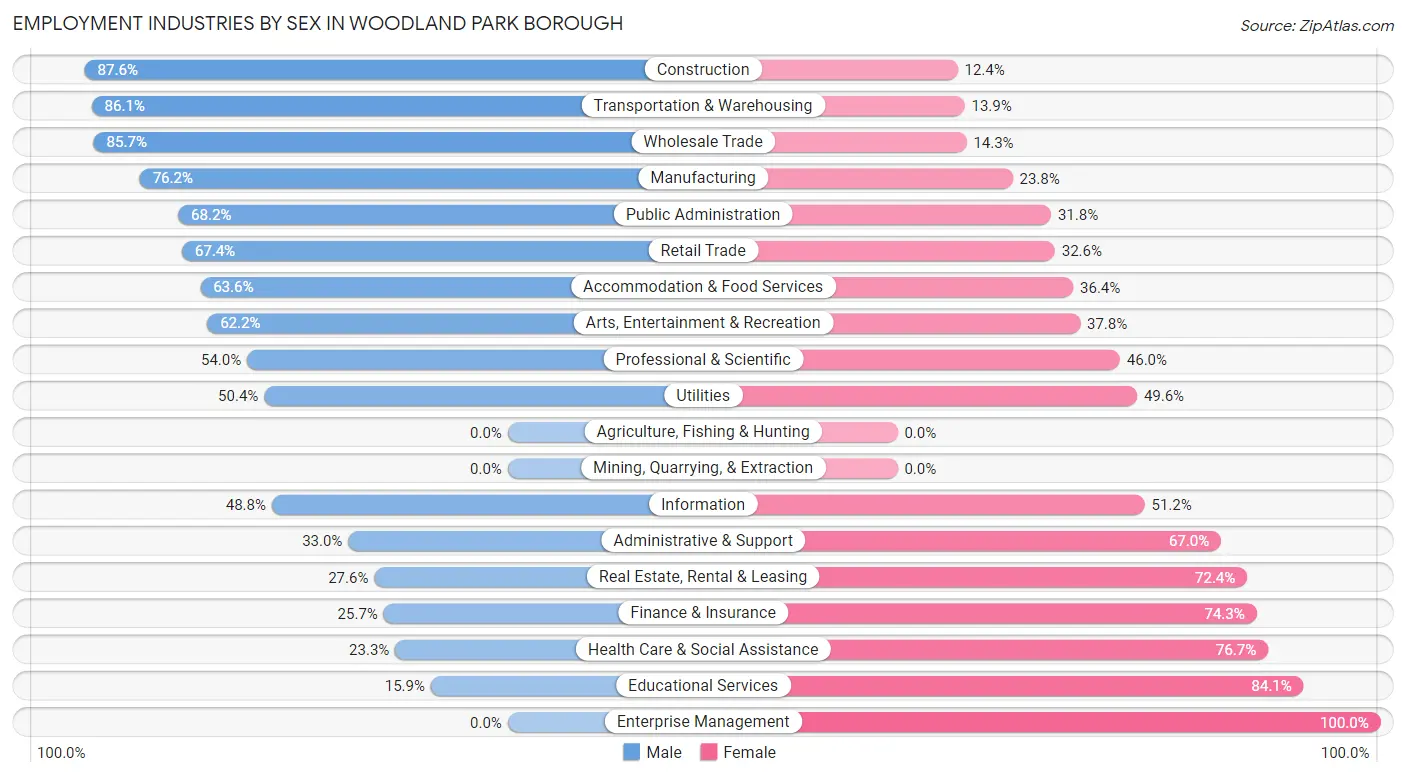
Employment Industries by Sex in Woodland Park borough
The Woodland Park borough industries that see more men than women are Construction (87.6%), Transportation & Warehousing (86.1%), and Wholesale Trade (85.7%), whereas the industries that tend to have a higher number of women are Enterprise Management (100.0%), Educational Services (84.1%), and Health Care & Social Assistance (76.7%).
| Industry | Male | Female |
| Agriculture, Fishing & Hunting | 0 (0.0%) | 0 (0.0%) |
| Mining, Quarrying, & Extraction | 0 (0.0%) | 0 (0.0%) |
| Construction | 380 (87.6%) | 54 (12.4%) |
| Manufacturing | 489 (76.2%) | 153 (23.8%) |
| Wholesale Trade | 90 (85.7%) | 15 (14.3%) |
| Retail Trade | 644 (67.4%) | 311 (32.6%) |
| Transportation & Warehousing | 124 (86.1%) | 20 (13.9%) |
| Utilities | 60 (50.4%) | 59 (49.6%) |
| Information | 105 (48.8%) | 110 (51.2%) |
| Finance & Insurance | 123 (25.7%) | 356 (74.3%) |
| Real Estate, Rental & Leasing | 21 (27.6%) | 55 (72.4%) |
| Professional & Scientific | 245 (54.0%) | 209 (46.0%) |
| Enterprise Management | 0 (0.0%) | 11 (100.0%) |
| Administrative & Support | 35 (33.0%) | 71 (67.0%) |
| Educational Services | 87 (15.9%) | 459 (84.1%) |
| Health Care & Social Assistance | 237 (23.3%) | 780 (76.7%) |
| Arts, Entertainment & Recreation | 51 (62.2%) | 31 (37.8%) |
| Accommodation & Food Services | 245 (63.6%) | 140 (36.4%) |
| Public Administration | 118 (68.2%) | 55 (31.8%) |
| Total | 3,431 (52.5%) | 3,107 (47.5%) |
Education in Woodland Park borough
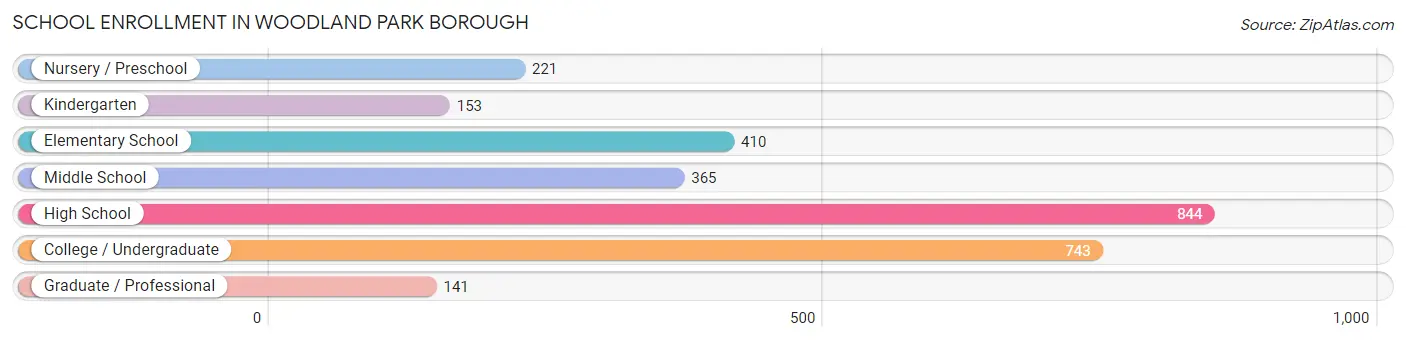
School Enrollment in Woodland Park borough
The most common levels of schooling among the 2,877 students in Woodland Park borough are high school (844 | 29.3%), college / undergraduate (743 | 25.8%), and elementary school (410 | 14.2%).
| School Level | # Students | % Students |
| Nursery / Preschool | 221 | 7.7% |
| Kindergarten | 153 | 5.3% |
| Elementary School | 410 | 14.2% |
| Middle School | 365 | 12.7% |
| High School | 844 | 29.3% |
| College / Undergraduate | 743 | 25.8% |
| Graduate / Professional | 141 | 4.9% |
| Total | 2,877 | 100.0% |
School Enrollment by Age by Funding Source in Woodland Park borough
Out of a total of 2,877 students who are enrolled in schools in Woodland Park borough, 866 (30.1%) attend a private institution, while the remaining 2,011 (69.9%) are enrolled in public schools. The age group of 3 to 4 year olds has the highest likelihood of being enrolled in private schools, with 147 (66.5% in the age bracket) enrolled. Conversely, the age group of 15 to 17 year olds has the lowest likelihood of being enrolled in a private school, with 596 (95.5% in the age bracket) attending a public institution.
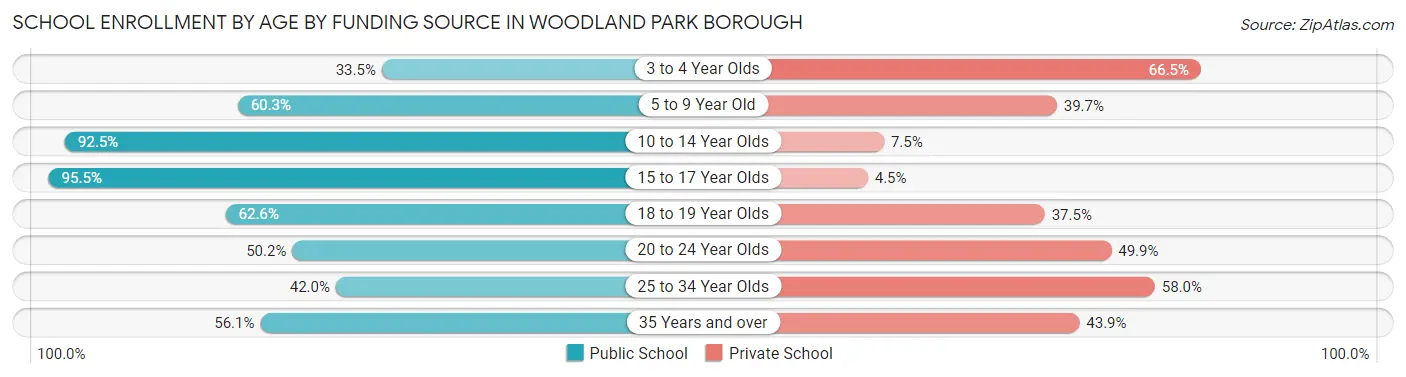
| Age Bracket | Public School | Private School |
| 3 to 4 Year Olds | 74 (33.5%) | 147 (66.5%) |
| 5 to 9 Year Old | 322 (60.3%) | 212 (39.7%) |
| 10 to 14 Year Olds | 517 (92.5%) | 42 (7.5%) |
| 15 to 17 Year Olds | 596 (95.5%) | 28 (4.5%) |
| 18 to 19 Year Olds | 172 (62.5%) | 103 (37.4%) |
| 20 to 24 Year Olds | 172 (50.1%) | 171 (49.8%) |
| 25 to 34 Year Olds | 66 (42.0%) | 91 (58.0%) |
| 35 Years and over | 92 (56.1%) | 72 (43.9%) |
| Total | 2,011 (69.9%) | 866 (30.1%) |
Educational Attainment by Field of Study in Woodland Park borough
Business (935 | 21.5%), education (645 | 14.9%), science & technology (428 | 9.9%), social sciences (370 | 8.5%), and engineering (317 | 7.3%) are the most common fields of study among 4,341 individuals in Woodland Park borough who have obtained a bachelor's degree or higher.
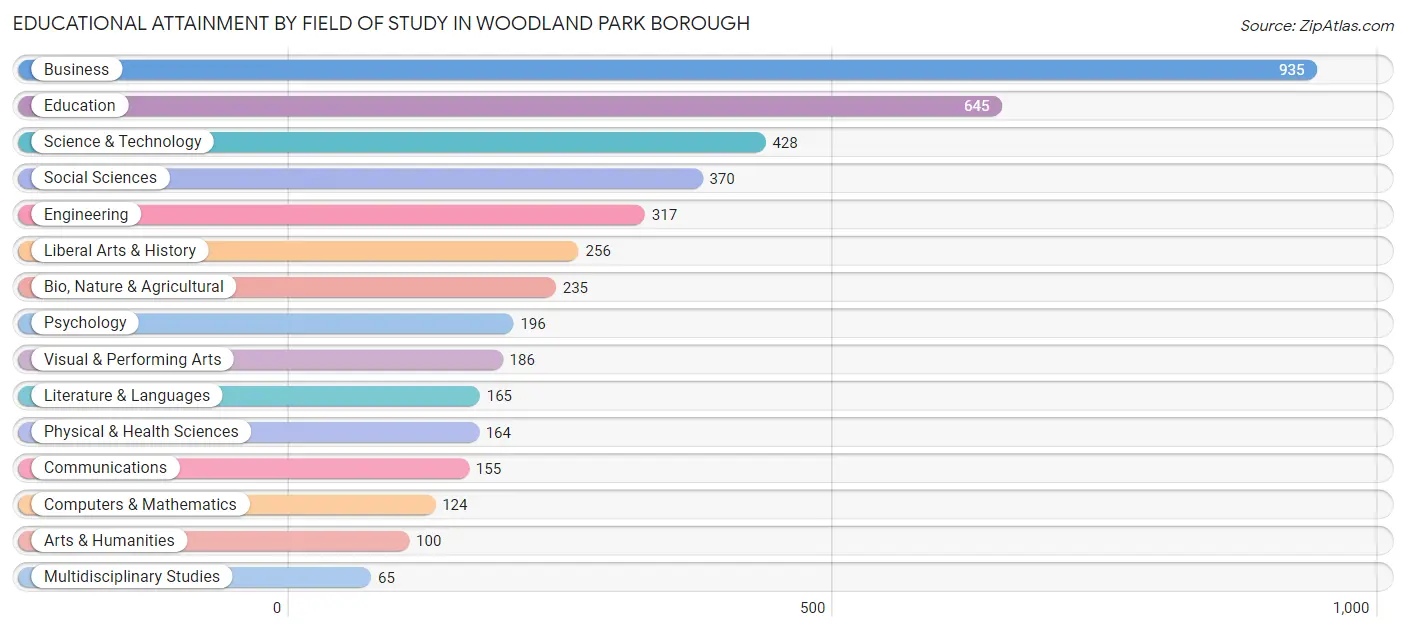
| Field of Study | # Graduates | % Graduates |
| Computers & Mathematics | 124 | 2.9% |
| Bio, Nature & Agricultural | 235 | 5.4% |
| Physical & Health Sciences | 164 | 3.8% |
| Psychology | 196 | 4.5% |
| Social Sciences | 370 | 8.5% |
| Engineering | 317 | 7.3% |
| Multidisciplinary Studies | 65 | 1.5% |
| Science & Technology | 428 | 9.9% |
| Business | 935 | 21.5% |
| Education | 645 | 14.9% |
| Literature & Languages | 165 | 3.8% |
| Liberal Arts & History | 256 | 5.9% |
| Visual & Performing Arts | 186 | 4.3% |
| Communications | 155 | 3.6% |
| Arts & Humanities | 100 | 2.3% |
| Total | 4,341 | 100.0% |
Transportation & Commute in Woodland Park borough
Vehicle Availability by Sex in Woodland Park borough
The most prevalent vehicle ownership categories in Woodland Park borough are males with 2 vehicles (1,243, accounting for 37.2%) and females with 2 vehicles (1,232, making up 41.8%).
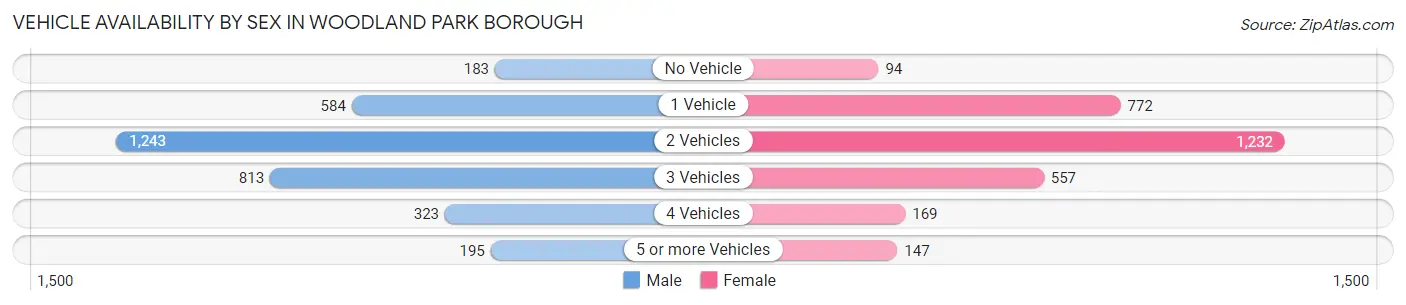
| Vehicles Available | Male | Female |
| No Vehicle | 183 (5.5%) | 94 (3.2%) |
| 1 Vehicle | 584 (17.5%) | 772 (26.0%) |
| 2 Vehicles | 1,243 (37.2%) | 1,232 (41.5%) |
| 3 Vehicles | 813 (24.3%) | 557 (18.8%) |
| 4 Vehicles | 323 (9.7%) | 169 (5.7%) |
| 5 or more Vehicles | 195 (5.8%) | 147 (5.0%) |
| Total | 3,341 (100.0%) | 2,971 (100.0%) |
Commute Time in Woodland Park borough
The most frequently occuring commute durations in Woodland Park borough are 30 to 34 minutes (1,180 commuters, 20.7%), 15 to 19 minutes (1,022 commuters, 18.0%), and 20 to 24 minutes (952 commuters, 16.7%).
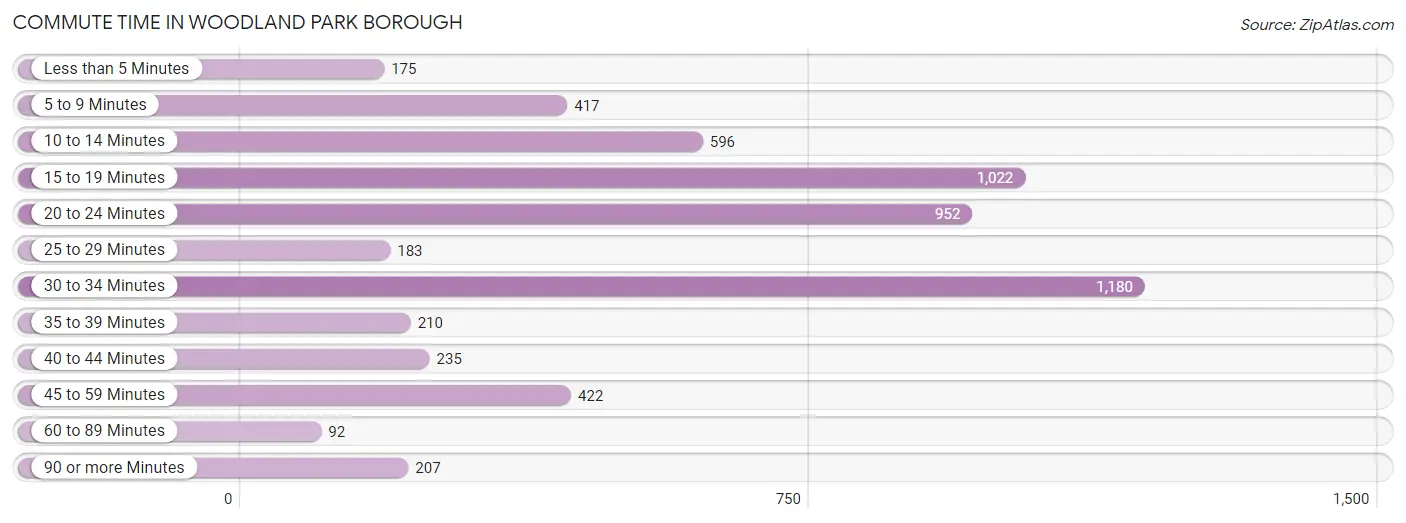
| Commute Time | # Commuters | % Commuters |
| Less than 5 Minutes | 175 | 3.1% |
| 5 to 9 Minutes | 417 | 7.3% |
| 10 to 14 Minutes | 596 | 10.5% |
| 15 to 19 Minutes | 1,022 | 18.0% |
| 20 to 24 Minutes | 952 | 16.7% |
| 25 to 29 Minutes | 183 | 3.2% |
| 30 to 34 Minutes | 1,180 | 20.7% |
| 35 to 39 Minutes | 210 | 3.7% |
| 40 to 44 Minutes | 235 | 4.1% |
| 45 to 59 Minutes | 422 | 7.4% |
| 60 to 89 Minutes | 92 | 1.6% |
| 90 or more Minutes | 207 | 3.6% |
Commute Time by Sex in Woodland Park borough
The most common commute times in Woodland Park borough are 30 to 34 minutes (744 commuters, 24.3%) for males and 15 to 19 minutes (559 commuters, 21.2%) for females.
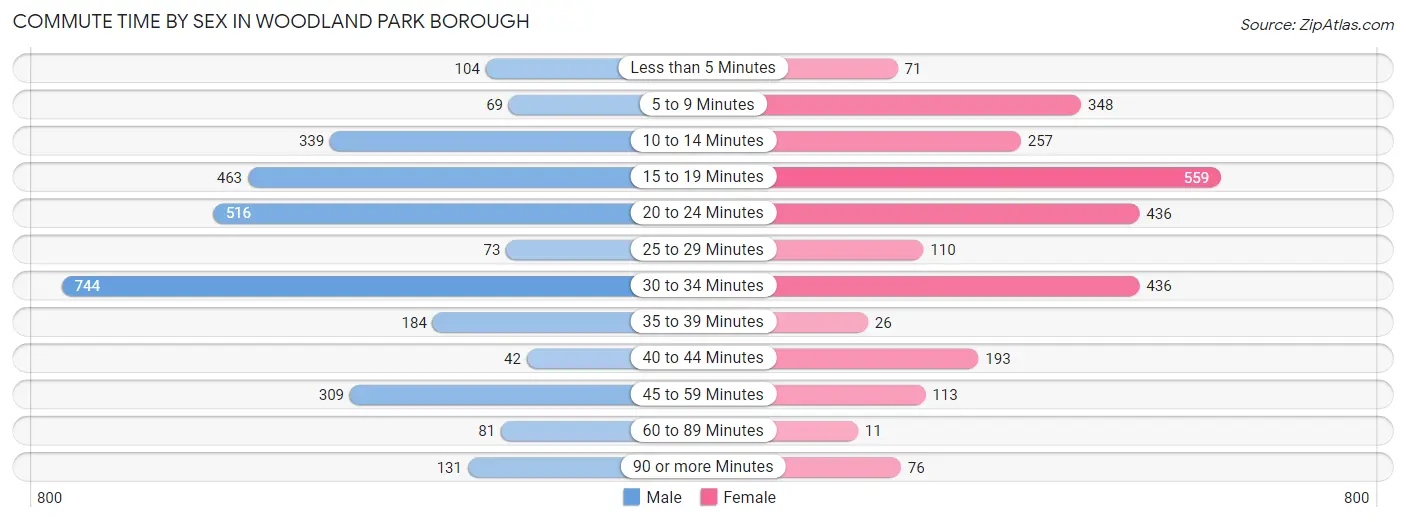
| Commute Time | Male | Female |
| Less than 5 Minutes | 104 (3.4%) | 71 (2.7%) |
| 5 to 9 Minutes | 69 (2.3%) | 348 (13.2%) |
| 10 to 14 Minutes | 339 (11.1%) | 257 (9.8%) |
| 15 to 19 Minutes | 463 (15.2%) | 559 (21.2%) |
| 20 to 24 Minutes | 516 (16.9%) | 436 (16.5%) |
| 25 to 29 Minutes | 73 (2.4%) | 110 (4.2%) |
| 30 to 34 Minutes | 744 (24.3%) | 436 (16.5%) |
| 35 to 39 Minutes | 184 (6.0%) | 26 (1.0%) |
| 40 to 44 Minutes | 42 (1.4%) | 193 (7.3%) |
| 45 to 59 Minutes | 309 (10.1%) | 113 (4.3%) |
| 60 to 89 Minutes | 81 (2.6%) | 11 (0.4%) |
| 90 or more Minutes | 131 (4.3%) | 76 (2.9%) |
Time of Departure to Work by Sex in Woodland Park borough
The most frequent times of departure to work in Woodland Park borough are 7:30 AM to 7:59 AM (614, 20.1%) for males and 9:00 AM to 9:59 AM (377, 14.3%) for females.
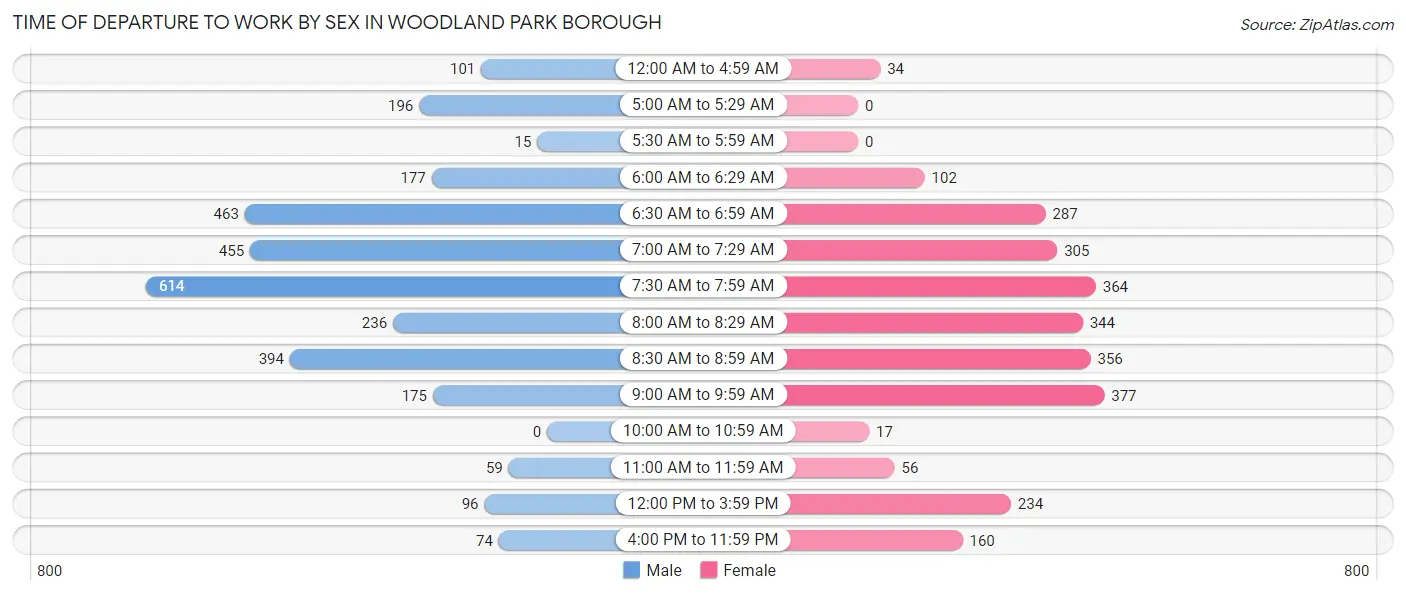
| Time of Departure | Male | Female |
| 12:00 AM to 4:59 AM | 101 (3.3%) | 34 (1.3%) |
| 5:00 AM to 5:29 AM | 196 (6.4%) | 0 (0.0%) |
| 5:30 AM to 5:59 AM | 15 (0.5%) | 0 (0.0%) |
| 6:00 AM to 6:29 AM | 177 (5.8%) | 102 (3.9%) |
| 6:30 AM to 6:59 AM | 463 (15.2%) | 287 (10.9%) |
| 7:00 AM to 7:29 AM | 455 (14.9%) | 305 (11.6%) |
| 7:30 AM to 7:59 AM | 614 (20.1%) | 364 (13.8%) |
| 8:00 AM to 8:29 AM | 236 (7.7%) | 344 (13.1%) |
| 8:30 AM to 8:59 AM | 394 (12.9%) | 356 (13.5%) |
| 9:00 AM to 9:59 AM | 175 (5.7%) | 377 (14.3%) |
| 10:00 AM to 10:59 AM | 0 (0.0%) | 17 (0.6%) |
| 11:00 AM to 11:59 AM | 59 (1.9%) | 56 (2.1%) |
| 12:00 PM to 3:59 PM | 96 (3.1%) | 234 (8.9%) |
| 4:00 PM to 11:59 PM | 74 (2.4%) | 160 (6.1%) |
| Total | 3,055 (100.0%) | 2,636 (100.0%) |
Housing Occupancy in Woodland Park borough
Occupancy by Ownership in Woodland Park borough
Of the total 5,294 dwellings in Woodland Park borough, owner-occupied units account for 3,363 (63.5%), while renter-occupied units make up 1,931 (36.5%).
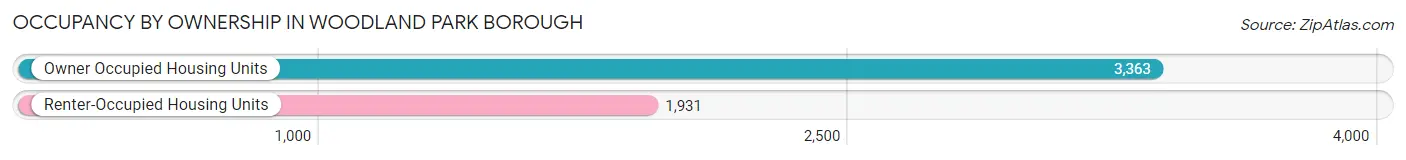
| Occupancy | # Housing Units | % Housing Units |
| Owner Occupied Housing Units | 3,363 | 63.5% |
| Renter-Occupied Housing Units | 1,931 | 36.5% |
| Total Occupied Housing Units | 5,294 | 100.0% |
Occupancy by Household Size in Woodland Park borough
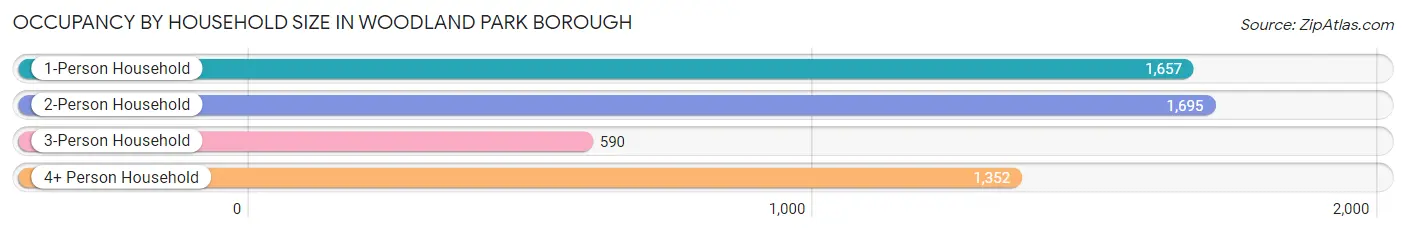
| Household Size | # Housing Units | % Housing Units |
| 1-Person Household | 1,657 | 31.3% |
| 2-Person Household | 1,695 | 32.0% |
| 3-Person Household | 590 | 11.1% |
| 4+ Person Household | 1,352 | 25.5% |
| Total Housing Units | 5,294 | 100.0% |
Occupancy by Ownership by Household Size in Woodland Park borough
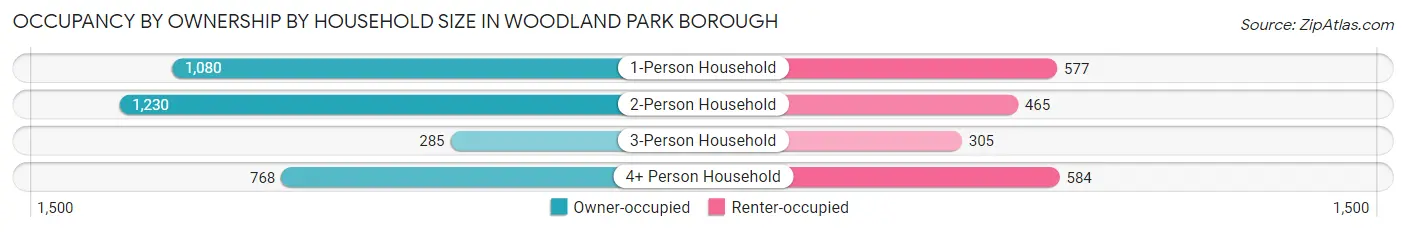
| Household Size | Owner-occupied | Renter-occupied |
| 1-Person Household | 1,080 (65.2%) | 577 (34.8%) |
| 2-Person Household | 1,230 (72.6%) | 465 (27.4%) |
| 3-Person Household | 285 (48.3%) | 305 (51.7%) |
| 4+ Person Household | 768 (56.8%) | 584 (43.2%) |
| Total Housing Units | 3,363 (63.5%) | 1,931 (36.5%) |
Occupancy by Educational Attainment in Woodland Park borough
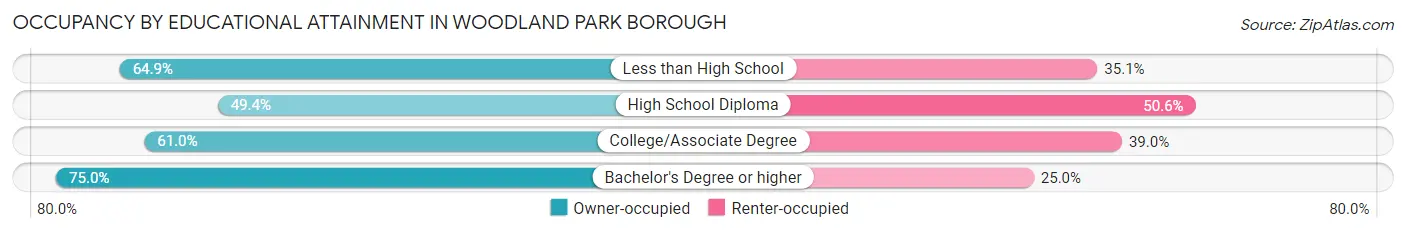
| Household Size | Owner-occupied | Renter-occupied |
| Less than High School | 296 (64.9%) | 160 (35.1%) |
| High School Diploma | 741 (49.4%) | 760 (50.6%) |
| College/Associate Degree | 770 (61.0%) | 492 (39.0%) |
| Bachelor's Degree or higher | 1,556 (75.0%) | 519 (25.0%) |
Occupancy by Age of Householder in Woodland Park borough
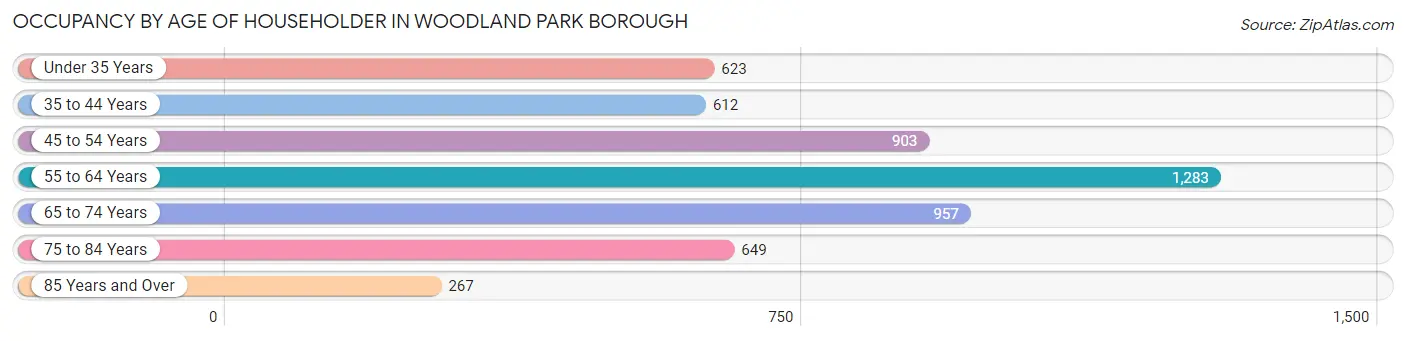
| Age Bracket | # Households | % Households |
| Under 35 Years | 623 | 11.8% |
| 35 to 44 Years | 612 | 11.6% |
| 45 to 54 Years | 903 | 17.1% |
| 55 to 64 Years | 1,283 | 24.2% |
| 65 to 74 Years | 957 | 18.1% |
| 75 to 84 Years | 649 | 12.3% |
| 85 Years and Over | 267 | 5.0% |
| Total | 5,294 | 100.0% |
Housing Finances in Woodland Park borough
Median Income by Occupancy in Woodland Park borough
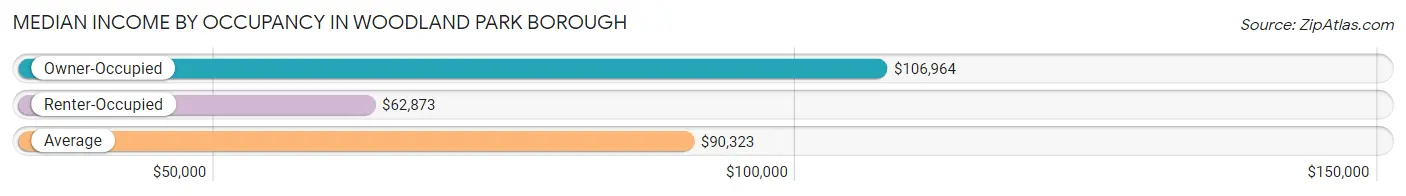
| Occupancy Type | # Households | Median Income |
| Owner-Occupied | 3,363 (63.5%) | $106,964 |
| Renter-Occupied | 1,931 (36.5%) | $62,873 |
| Average | 5,294 (100.0%) | $90,323 |
Occupancy by Householder Income Bracket in Woodland Park borough
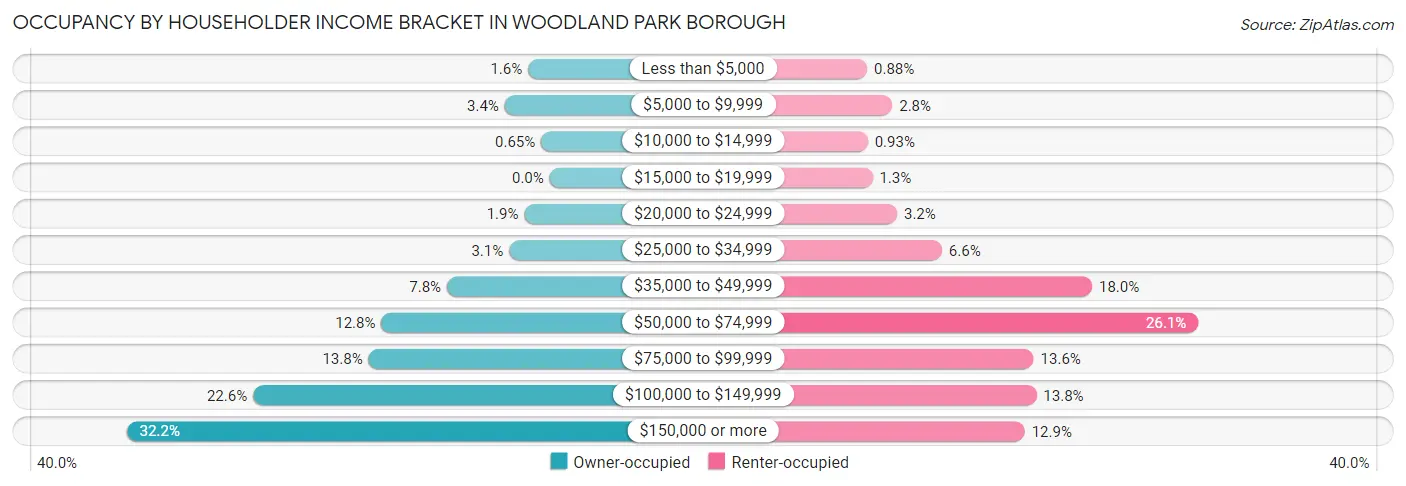
| Income Bracket | Owner-occupied | Renter-occupied |
| Less than $5,000 | 55 (1.6%) | 17 (0.9%) |
| $5,000 to $9,999 | 115 (3.4%) | 54 (2.8%) |
| $10,000 to $14,999 | 22 (0.6%) | 18 (0.9%) |
| $15,000 to $19,999 | 0 (0.0%) | 25 (1.3%) |
| $20,000 to $24,999 | 65 (1.9%) | 61 (3.2%) |
| $25,000 to $34,999 | 104 (3.1%) | 127 (6.6%) |
| $35,000 to $49,999 | 263 (7.8%) | 348 (18.0%) |
| $50,000 to $74,999 | 431 (12.8%) | 504 (26.1%) |
| $75,000 to $99,999 | 464 (13.8%) | 262 (13.6%) |
| $100,000 to $149,999 | 760 (22.6%) | 266 (13.8%) |
| $150,000 or more | 1,084 (32.2%) | 249 (12.9%) |
| Total | 3,363 (100.0%) | 1,931 (100.0%) |
Monthly Housing Cost Tiers in Woodland Park borough
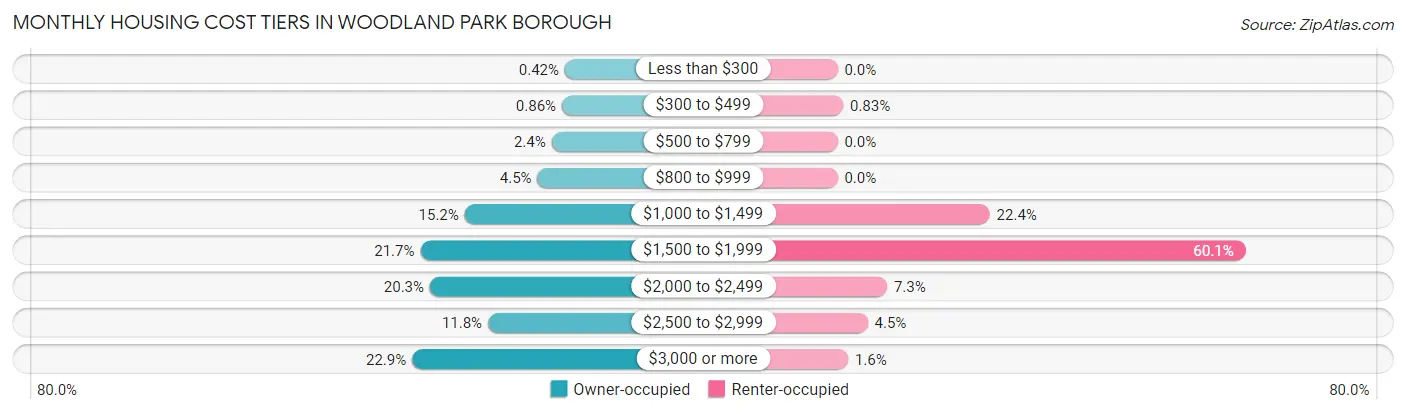
| Monthly Cost | Owner-occupied | Renter-occupied |
| Less than $300 | 14 (0.4%) | 0 (0.0%) |
| $300 to $499 | 29 (0.9%) | 16 (0.8%) |
| $500 to $799 | 80 (2.4%) | 0 (0.0%) |
| $800 to $999 | 150 (4.5%) | 0 (0.0%) |
| $1,000 to $1,499 | 511 (15.2%) | 433 (22.4%) |
| $1,500 to $1,999 | 730 (21.7%) | 1,161 (60.1%) |
| $2,000 to $2,499 | 683 (20.3%) | 141 (7.3%) |
| $2,500 to $2,999 | 395 (11.7%) | 86 (4.4%) |
| $3,000 or more | 771 (22.9%) | 30 (1.5%) |
| Total | 3,363 (100.0%) | 1,931 (100.0%) |
Physical Housing Characteristics in Woodland Park borough
Housing Structures in Woodland Park borough
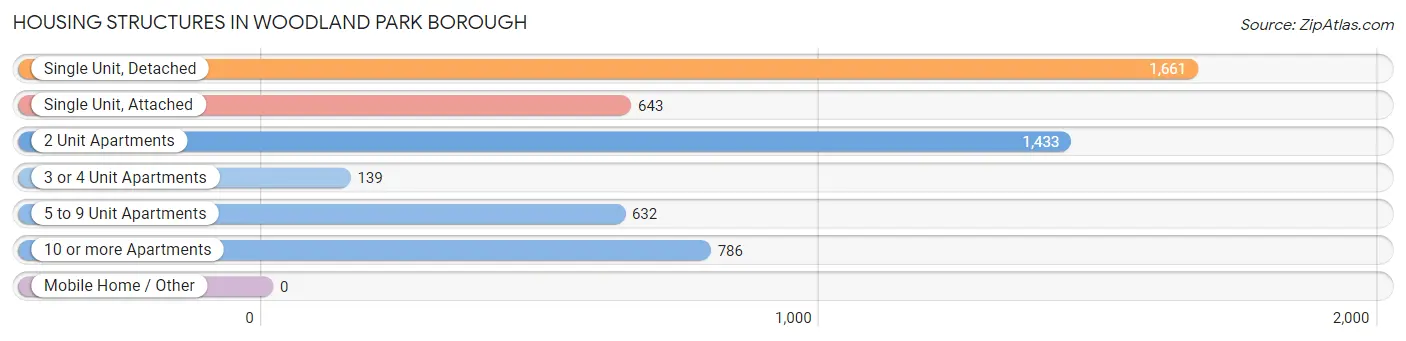
| Structure Type | # Housing Units | % Housing Units |
| Single Unit, Detached | 1,661 | 31.4% |
| Single Unit, Attached | 643 | 12.1% |
| 2 Unit Apartments | 1,433 | 27.1% |
| 3 or 4 Unit Apartments | 139 | 2.6% |
| 5 to 9 Unit Apartments | 632 | 11.9% |
| 10 or more Apartments | 786 | 14.8% |
| Mobile Home / Other | 0 | 0.0% |
| Total | 5,294 | 100.0% |
Housing Structures by Occupancy in Woodland Park borough
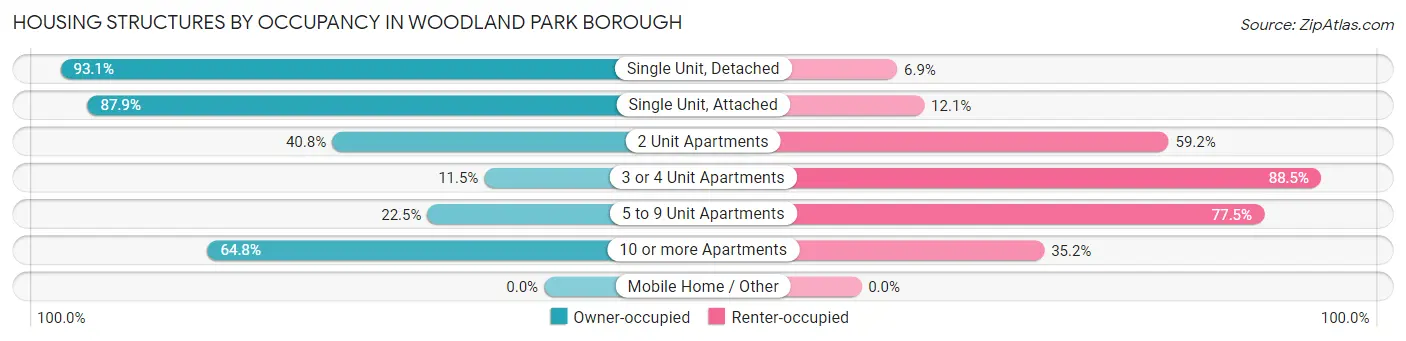
| Structure Type | Owner-occupied | Renter-occupied |
| Single Unit, Detached | 1,546 (93.1%) | 115 (6.9%) |
| Single Unit, Attached | 565 (87.9%) | 78 (12.1%) |
| 2 Unit Apartments | 585 (40.8%) | 848 (59.2%) |
| 3 or 4 Unit Apartments | 16 (11.5%) | 123 (88.5%) |
| 5 to 9 Unit Apartments | 142 (22.5%) | 490 (77.5%) |
| 10 or more Apartments | 509 (64.8%) | 277 (35.2%) |
| Mobile Home / Other | 0 (0.0%) | 0 (0.0%) |
| Total | 3,363 (63.5%) | 1,931 (36.5%) |
Housing Structures by Number of Rooms in Woodland Park borough
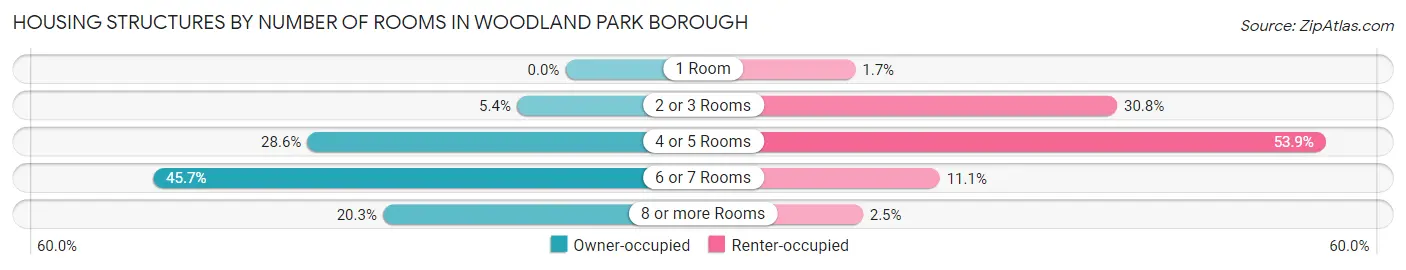
| Number of Rooms | Owner-occupied | Renter-occupied |
| 1 Room | 0 (0.0%) | 33 (1.7%) |
| 2 or 3 Rooms | 181 (5.4%) | 594 (30.8%) |
| 4 or 5 Rooms | 963 (28.6%) | 1,041 (53.9%) |
| 6 or 7 Rooms | 1,538 (45.7%) | 214 (11.1%) |
| 8 or more Rooms | 681 (20.3%) | 49 (2.5%) |
| Total | 3,363 (100.0%) | 1,931 (100.0%) |
Housing Structure by Heating Type in Woodland Park borough
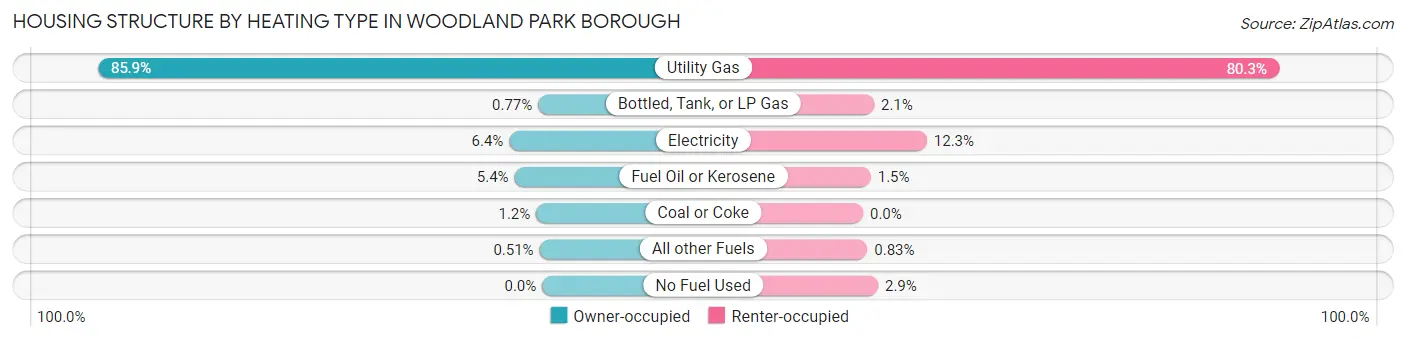
| Heating Type | Owner-occupied | Renter-occupied |
| Utility Gas | 2,887 (85.9%) | 1,551 (80.3%) |
| Bottled, Tank, or LP Gas | 26 (0.8%) | 41 (2.1%) |
| Electricity | 214 (6.4%) | 238 (12.3%) |
| Fuel Oil or Kerosene | 180 (5.3%) | 29 (1.5%) |
| Coal or Coke | 39 (1.2%) | 0 (0.0%) |
| All other Fuels | 17 (0.5%) | 16 (0.8%) |
| No Fuel Used | 0 (0.0%) | 56 (2.9%) |
| Total | 3,363 (100.0%) | 1,931 (100.0%) |
Household Vehicle Usage in Woodland Park borough
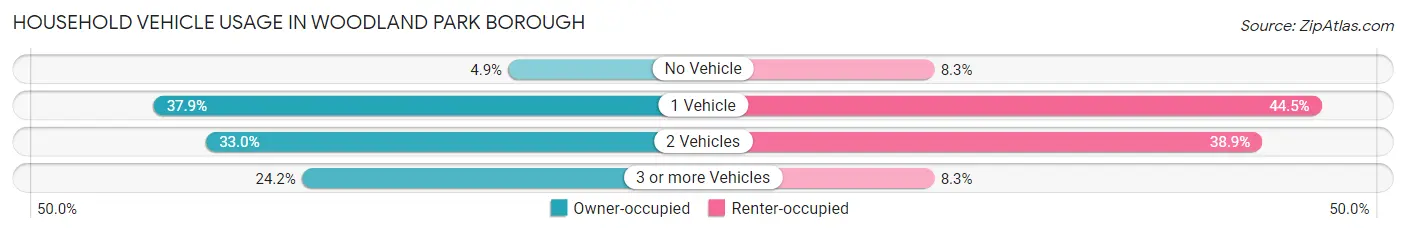
| Vehicles per Household | Owner-occupied | Renter-occupied |
| No Vehicle | 164 (4.9%) | 160 (8.3%) |
| 1 Vehicle | 1,276 (37.9%) | 859 (44.5%) |
| 2 Vehicles | 1,111 (33.0%) | 752 (38.9%) |
| 3 or more Vehicles | 812 (24.1%) | 160 (8.3%) |
| Total | 3,363 (100.0%) | 1,931 (100.0%) |
Real Estate & Mortgages in Woodland Park borough
Real Estate and Mortgage Overview in Woodland Park borough
| Characteristic | Without Mortgage | With Mortgage |
| Housing Units | 1,768 | 1,595 |
| Median Property Value | $469,500 | $440,400 |
| Median Household Income | $95,400 | $594 |
| Monthly Housing Costs | $1,501 | $771 |
| Real Estate Taxes | $10,001 | $17 |
Property Value by Mortgage Status in Woodland Park borough
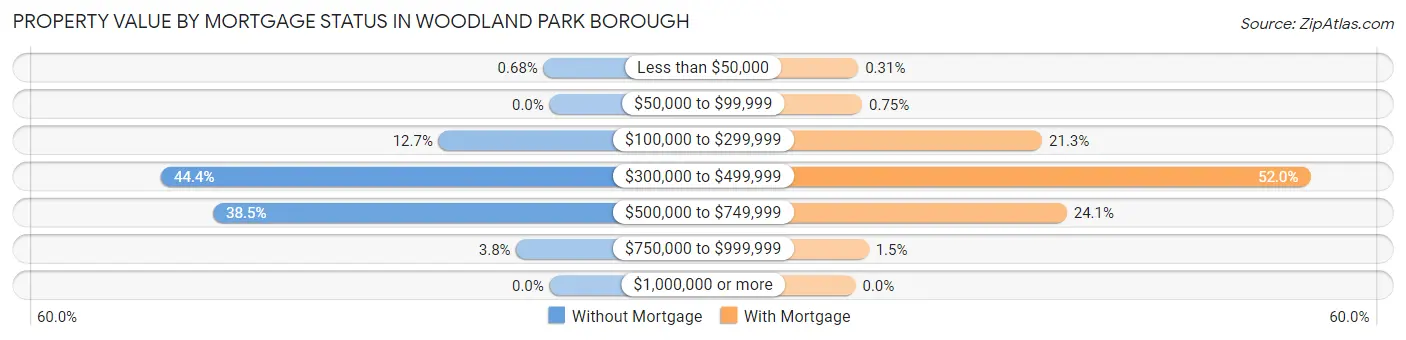
| Property Value | Without Mortgage | With Mortgage |
| Less than $50,000 | 12 (0.7%) | 5 (0.3%) |
| $50,000 to $99,999 | 0 (0.0%) | 12 (0.7%) |
| $100,000 to $299,999 | 224 (12.7%) | 340 (21.3%) |
| $300,000 to $499,999 | 785 (44.4%) | 829 (52.0%) |
| $500,000 to $749,999 | 680 (38.5%) | 385 (24.1%) |
| $750,000 to $999,999 | 67 (3.8%) | 24 (1.5%) |
| $1,000,000 or more | 0 (0.0%) | 0 (0.0%) |
| Total | 1,768 (100.0%) | 1,595 (100.0%) |
Household Income by Mortgage Status in Woodland Park borough
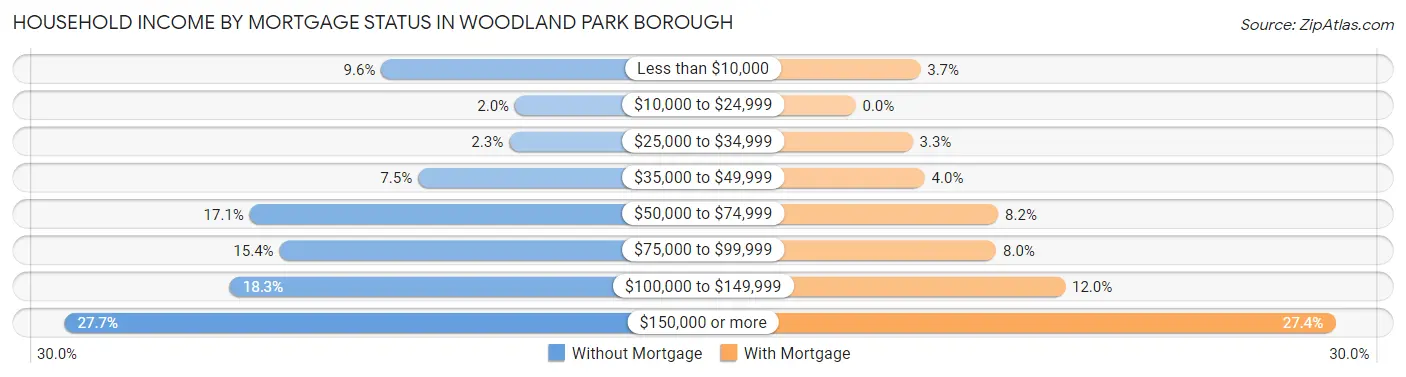
| Household Income | Without Mortgage | With Mortgage |
| Less than $10,000 | 170 (9.6%) | 59 (3.7%) |
| $10,000 to $24,999 | 35 (2.0%) | 0 (0.0%) |
| $25,000 to $34,999 | 41 (2.3%) | 52 (3.3%) |
| $35,000 to $49,999 | 133 (7.5%) | 63 (4.0%) |
| $50,000 to $74,999 | 303 (17.1%) | 130 (8.2%) |
| $75,000 to $99,999 | 273 (15.4%) | 128 (8.0%) |
| $100,000 to $149,999 | 323 (18.3%) | 191 (12.0%) |
| $150,000 or more | 490 (27.7%) | 437 (27.4%) |
| Total | 1,768 (100.0%) | 1,595 (100.0%) |
Property Value to Household Income Ratio in Woodland Park borough
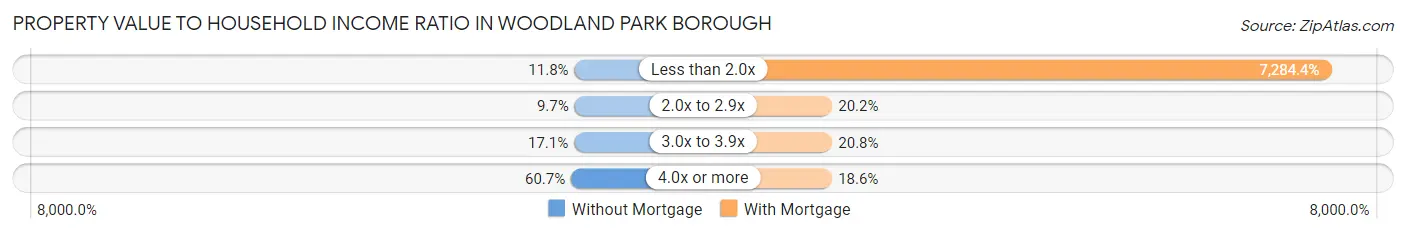
| Value-to-Income Ratio | Without Mortgage | With Mortgage |
| Less than 2.0x | 209 (11.8%) | 116,186 (7,284.4%) |
| 2.0x to 2.9x | 171 (9.7%) | 322 (20.2%) |
| 3.0x to 3.9x | 302 (17.1%) | 331 (20.7%) |
| 4.0x or more | 1,073 (60.7%) | 296 (18.6%) |
| Total | 1,768 (100.0%) | 1,595 (100.0%) |
Real Estate Taxes by Mortgage Status in Woodland Park borough
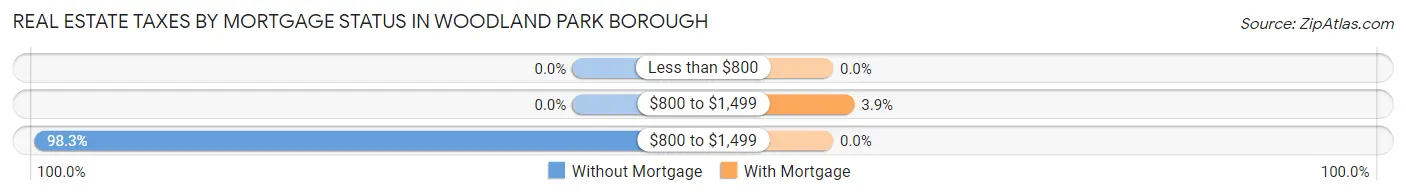
| Property Taxes | Without Mortgage | With Mortgage |
| Less than $800 | 0 (0.0%) | 0 (0.0%) |
| $800 to $1,499 | 0 (0.0%) | 62 (3.9%) |
| $800 to $1,499 | 1,737 (98.3%) | 0 (0.0%) |
| Total | 1,768 (100.0%) | 1,595 (100.0%) |
Health & Disability in Woodland Park borough
Health Insurance Coverage by Age in Woodland Park borough
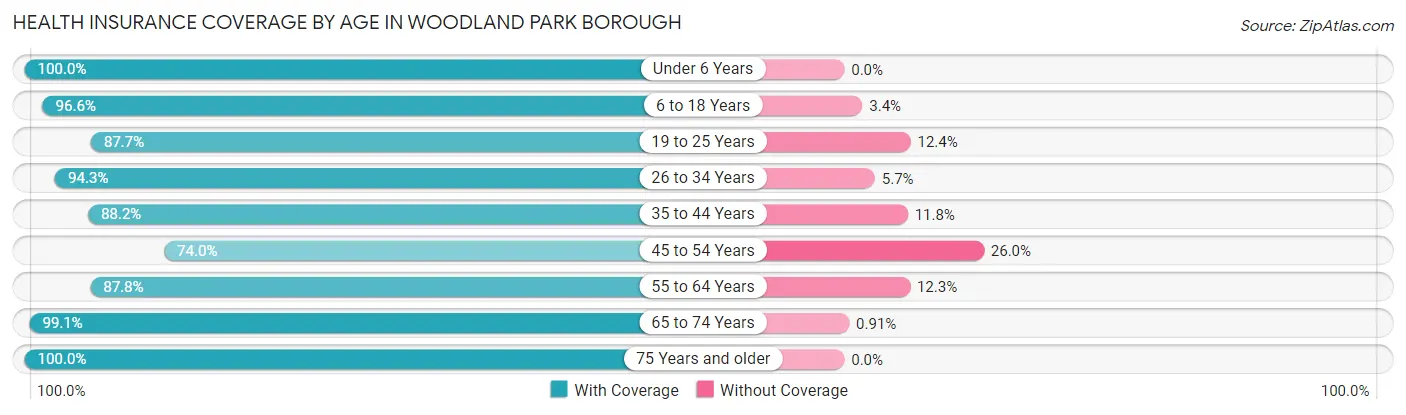
| Age Bracket | With Coverage | Without Coverage |
| Under 6 Years | 1,080 (100.0%) | 0 (0.0%) |
| 6 to 18 Years | 1,691 (96.6%) | 59 (3.4%) |
| 19 to 25 Years | 1,072 (87.6%) | 151 (12.3%) |
| 26 to 34 Years | 1,359 (94.3%) | 82 (5.7%) |
| 35 to 44 Years | 1,164 (88.2%) | 156 (11.8%) |
| 45 to 54 Years | 1,222 (74.0%) | 430 (26.0%) |
| 55 to 64 Years | 1,783 (87.7%) | 249 (12.2%) |
| 65 to 74 Years | 1,408 (99.1%) | 13 (0.9%) |
| 75 Years and older | 1,367 (100.0%) | 0 (0.0%) |
| Total | 12,146 (91.4%) | 1,140 (8.6%) |
Health Insurance Coverage by Citizenship Status in Woodland Park borough
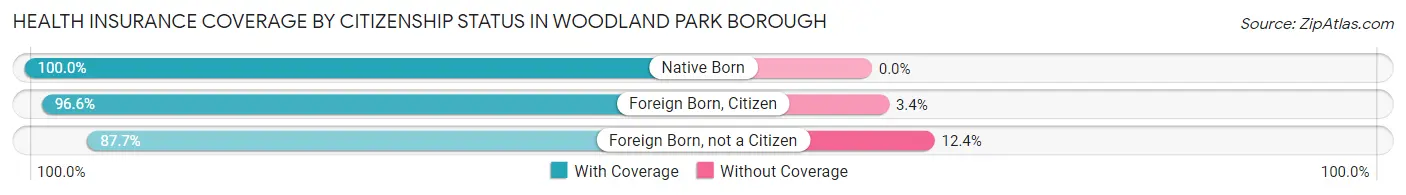
| Citizenship Status | With Coverage | Without Coverage |
| Native Born | 1,080 (100.0%) | 0 (0.0%) |
| Foreign Born, Citizen | 1,691 (96.6%) | 59 (3.4%) |
| Foreign Born, not a Citizen | 1,072 (87.6%) | 151 (12.3%) |
Health Insurance Coverage by Household Income in Woodland Park borough
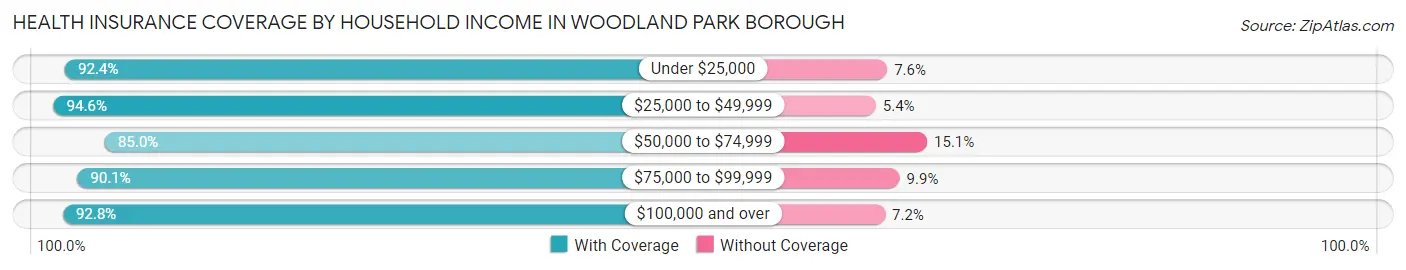
| Household Income | With Coverage | Without Coverage |
| Under $25,000 | 732 (92.4%) | 60 (7.6%) |
| $25,000 to $49,999 | 1,876 (94.6%) | 108 (5.4%) |
| $50,000 to $74,999 | 1,868 (85.0%) | 331 (15.0%) |
| $75,000 to $99,999 | 1,484 (90.1%) | 163 (9.9%) |
| $100,000 and over | 6,178 (92.8%) | 478 (7.2%) |
Public vs Private Health Insurance Coverage by Age in Woodland Park borough
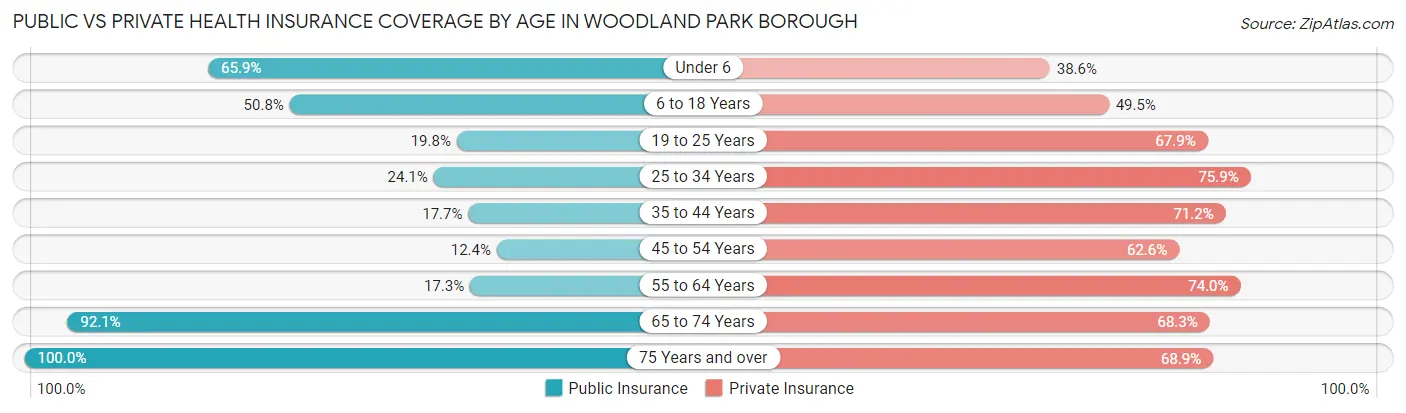
| Age Bracket | Public Insurance | Private Insurance |
| Under 6 | 712 (65.9%) | 417 (38.6%) |
| 6 to 18 Years | 889 (50.8%) | 867 (49.5%) |
| 19 to 25 Years | 242 (19.8%) | 830 (67.9%) |
| 25 to 34 Years | 347 (24.1%) | 1,093 (75.8%) |
| 35 to 44 Years | 233 (17.6%) | 940 (71.2%) |
| 45 to 54 Years | 204 (12.3%) | 1,034 (62.6%) |
| 55 to 64 Years | 352 (17.3%) | 1,503 (74.0%) |
| 65 to 74 Years | 1,308 (92.0%) | 970 (68.3%) |
| 75 Years and over | 1,367 (100.0%) | 942 (68.9%) |
| Total | 5,654 (42.6%) | 8,596 (64.7%) |
Disability Status by Sex by Age in Woodland Park borough
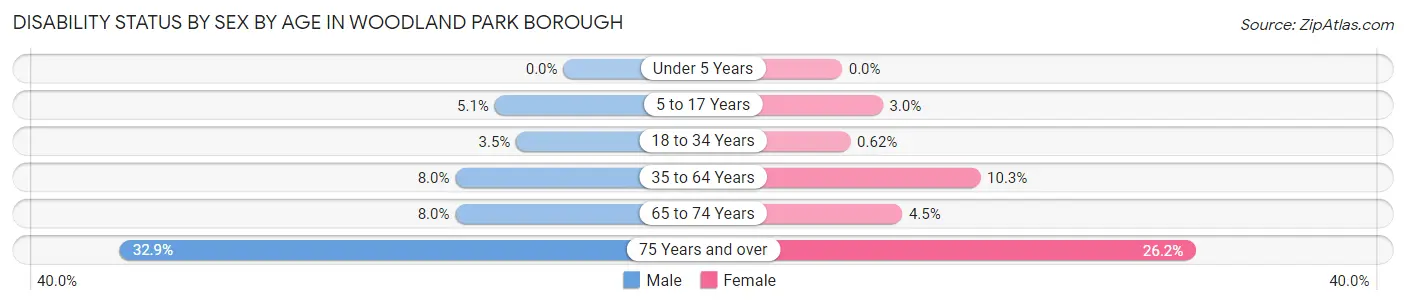
| Age Bracket | Male | Female |
| Under 5 Years | 0 (0.0%) | 0 (0.0%) |
| 5 to 17 Years | 51 (5.1%) | 22 (3.0%) |
| 18 to 34 Years | 54 (3.5%) | 8 (0.6%) |
| 35 to 64 Years | 185 (8.0%) | 277 (10.3%) |
| 65 to 74 Years | 53 (8.0%) | 34 (4.5%) |
| 75 Years and over | 189 (32.9%) | 208 (26.2%) |
Disability Class by Sex by Age in Woodland Park borough
Disability Class: Hearing Difficulty
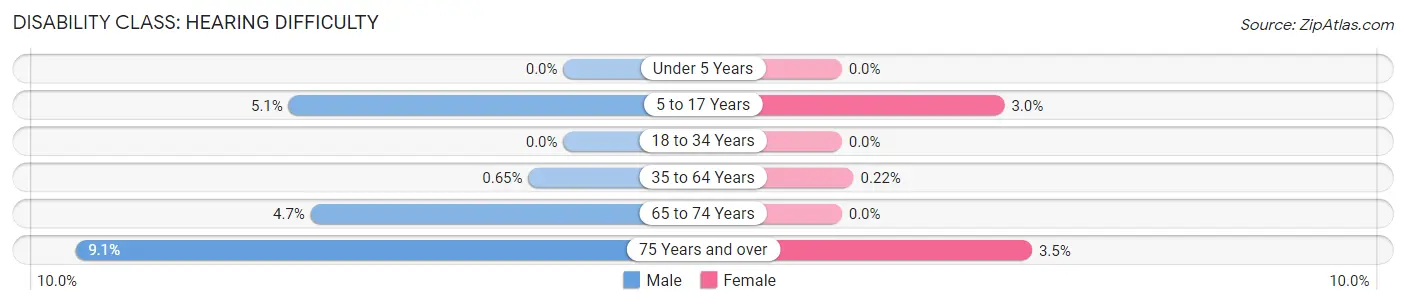
| Age Bracket | Male | Female |
| Under 5 Years | 0 (0.0%) | 0 (0.0%) |
| 5 to 17 Years | 51 (5.1%) | 22 (3.0%) |
| 18 to 34 Years | 0 (0.0%) | 0 (0.0%) |
| 35 to 64 Years | 15 (0.6%) | 6 (0.2%) |
| 65 to 74 Years | 31 (4.7%) | 0 (0.0%) |
| 75 Years and over | 52 (9.1%) | 28 (3.5%) |
Disability Class: Vision Difficulty
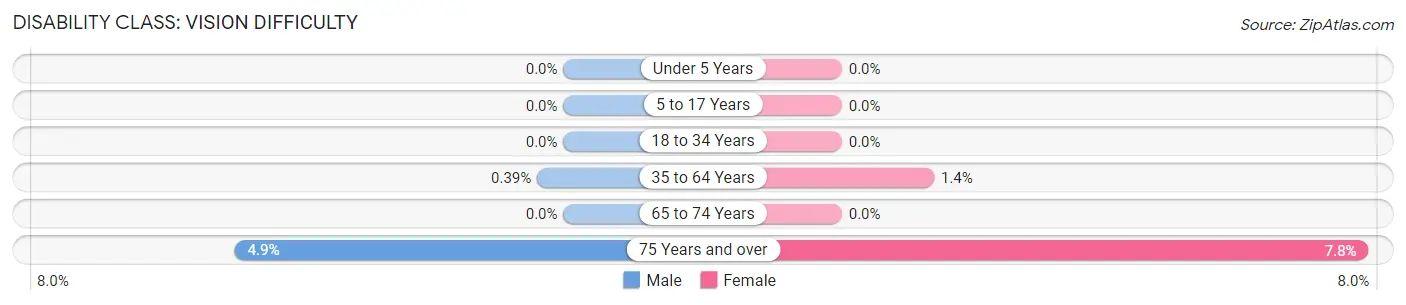
| Age Bracket | Male | Female |
| Under 5 Years | 0 (0.0%) | 0 (0.0%) |
| 5 to 17 Years | 0 (0.0%) | 0 (0.0%) |
| 18 to 34 Years | 0 (0.0%) | 0 (0.0%) |
| 35 to 64 Years | 9 (0.4%) | 37 (1.4%) |
| 65 to 74 Years | 0 (0.0%) | 0 (0.0%) |
| 75 Years and over | 28 (4.9%) | 62 (7.8%) |
Disability Class: Cognitive Difficulty
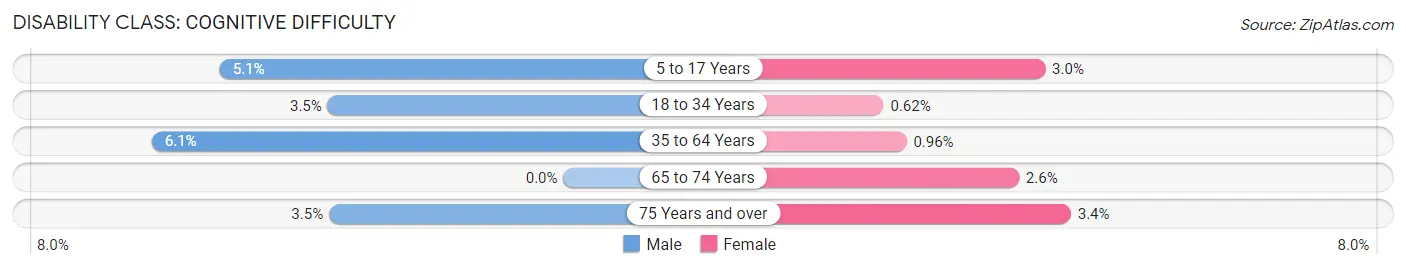
| Age Bracket | Male | Female |
| 5 to 17 Years | 51 (5.1%) | 22 (3.0%) |
| 18 to 34 Years | 54 (3.5%) | 8 (0.6%) |
| 35 to 64 Years | 141 (6.1%) | 26 (1.0%) |
| 65 to 74 Years | 0 (0.0%) | 20 (2.6%) |
| 75 Years and over | 20 (3.5%) | 27 (3.4%) |
Disability Class: Ambulatory Difficulty
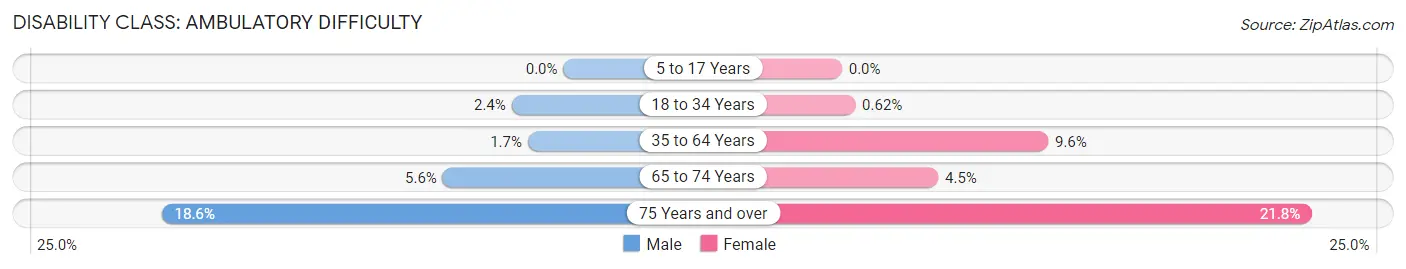
| Age Bracket | Male | Female |
| 5 to 17 Years | 0 (0.0%) | 0 (0.0%) |
| 18 to 34 Years | 37 (2.4%) | 8 (0.6%) |
| 35 to 64 Years | 38 (1.7%) | 258 (9.6%) |
| 65 to 74 Years | 37 (5.6%) | 34 (4.5%) |
| 75 Years and over | 107 (18.6%) | 173 (21.8%) |
Disability Class: Self-Care Difficulty
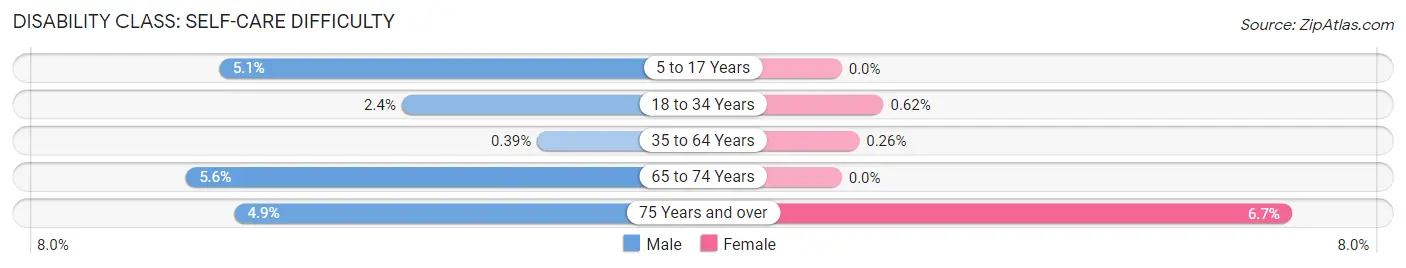
| Age Bracket | Male | Female |
| 5 to 17 Years | 51 (5.1%) | 0 (0.0%) |
| 18 to 34 Years | 37 (2.4%) | 8 (0.6%) |
| 35 to 64 Years | 9 (0.4%) | 7 (0.3%) |
| 65 to 74 Years | 37 (5.6%) | 0 (0.0%) |
| 75 Years and over | 28 (4.9%) | 53 (6.7%) |
Technology Access in Woodland Park borough
Computing Device Access in Woodland Park borough
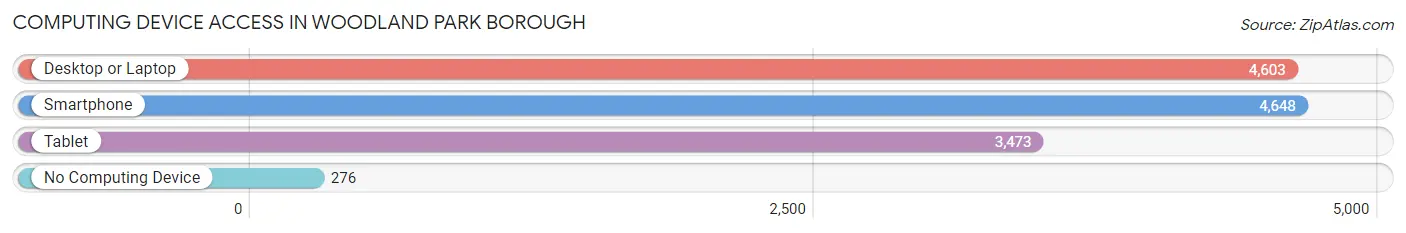
| Device Type | # Households | % Households |
| Desktop or Laptop | 4,603 | 87.0% |
| Smartphone | 4,648 | 87.8% |
| Tablet | 3,473 | 65.6% |
| No Computing Device | 276 | 5.2% |
| Total | 5,294 | 100.0% |
Internet Access in Woodland Park borough
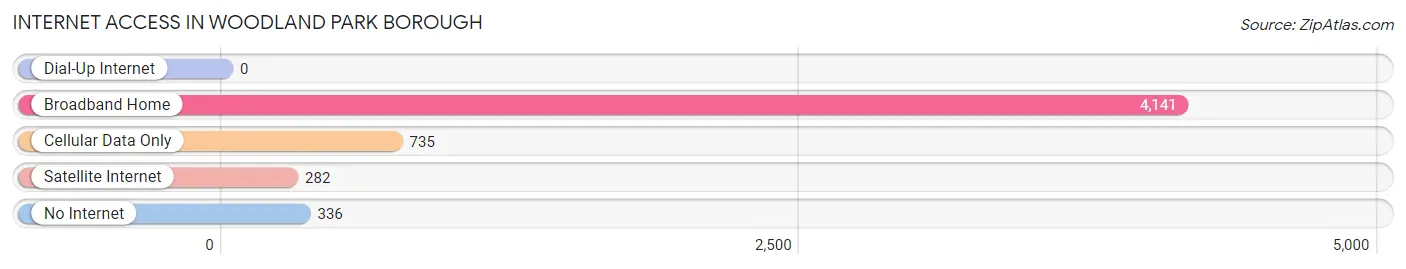
| Internet Type | # Households | % Households |
| Dial-Up Internet | 0 | 0.0% |
| Broadband Home | 4,141 | 78.2% |
| Cellular Data Only | 735 | 13.9% |
| Satellite Internet | 282 | 5.3% |
| No Internet | 336 | 6.4% |
| Total | 5,294 | 100.0% |
Woodland Park borough Summary
Woodland Park Borough is a small borough located in Passaic County, New Jersey. It is situated in the northern part of the state, just west of the city of Paterson. The borough was incorporated in 1908 and is home to a population of 11,819 people, according to the 2010 United States Census.
Geography
Woodland Park Borough is located at 40°53'N 74°10'W. It is bordered by the cities of Paterson and Clifton to the east, Little Falls Township to the south, and Totowa to the west. The borough is situated on a plateau, with an elevation of approximately 500 feet above sea level. The borough is approximately 2.5 square miles in size and is located in the Passaic River Valley.
The borough is home to several parks, including the Woodland Park Nature Preserve, which is a popular destination for bird watching and hiking. The borough also has a number of recreational facilities, including a public pool, tennis courts, and a skate park.
History
Woodland Park Borough was originally part of the Township of Little Falls, which was established in 1837. In 1908, the borough was incorporated as its own municipality. The borough was named after the Woodland Park Hotel, which was built in the area in 1891.
The borough experienced significant growth in the early 20th century, as the population increased from 1,000 in 1910 to over 10,000 by the 1950s. The borough was home to a number of factories, including the American Can Company, which was the largest employer in the area.
Economy
Woodland Park Borough is home to a number of small businesses, including restaurants, retail stores, and professional services. The borough is also home to a number of industrial and manufacturing businesses, including the American Can Company, which is the largest employer in the area.
The borough is home to a number of corporate headquarters, including the headquarters of the American Can Company, which is located in the borough. The borough is also home to a number of medical facilities, including the St. Joseph's Regional Medical Center, which is located in the borough.
Demographics
According to the 2010 United States Census, the population of Woodland Park Borough was 11,819. The racial makeup of the borough was 79.3% White, 8.2% African American, 0.3% Native American, 5.2% Asian, and 6.9% from other races. Hispanic or Latino of any race were 18.2% of the population.
The median household income in the borough was $60,945, and the median family income was $71,917. The per capita income in the borough was $27,945. About 6.2% of families and 8.3% of the population were below the poverty line, including 10.2% of those under age 18 and 6.7% of those age 65 or over.
Woodland Park Borough is served by the Woodland Park School District, which consists of four elementary schools, one middle school, and one high school. The borough is also home to a number of private schools, including the Woodland Park Academy and the Woodland Park Montessori School.
Common Questions
What is Per Capita Income in Woodland Park borough?
Per Capita income in Woodland Park borough is $46,030.
What is the Median Family Income in Woodland Park borough?
Median Family Income in Woodland Park borough is $106,780.
What is the Median Household income in Woodland Park borough?
Median Household Income in Woodland Park borough is $90,323.
What is Income or Wage Gap in Woodland Park borough?
Income or Wage Gap in Woodland Park borough is 25.0%.
Women in Woodland Park borough earn 75.0 cents for every dollar earned by a man.
What is Inequality or Gini Index in Woodland Park borough?
Inequality or Gini Index in Woodland Park borough is 0.41.
What is the Total Population of Woodland Park borough?
Total Population of Woodland Park borough is 13,291.
What is the Total Male Population of Woodland Park borough?
Total Male Population of Woodland Park borough is 6,576.
What is the Total Female Population of Woodland Park borough?
Total Female Population of Woodland Park borough is 6,715.
What is the Ratio of Males per 100 Females in Woodland Park borough?
There are 97.93 Males per 100 Females in Woodland Park borough.
What is the Ratio of Females per 100 Males in Woodland Park borough?
There are 102.11 Females per 100 Males in Woodland Park borough.
What is the Median Population Age in Woodland Park borough?
Median Population Age in Woodland Park borough is 43.2 Years.
What is the Average Family Size in Woodland Park borough
Average Family Size in Woodland Park borough is 3.2 People.
What is the Average Household Size in Woodland Park borough
Average Household Size in Woodland Park borough is 2.5 People.
How Large is the Labor Force in Woodland Park borough?
There are 6,963 People in the Labor Forcein in Woodland Park borough.
What is the Percentage of People in the Labor Force in Woodland Park borough?
63.5% of People are in the Labor Force in Woodland Park borough.
What is the Unemployment Rate in Woodland Park borough?
Unemployment Rate in Woodland Park borough is 6.1%.