Cities with the Highest Percentage of Immigrants from Africa in New Jersey
RELATED REPORTS & OPTIONS
Africa
New Jersey
Compare Cities
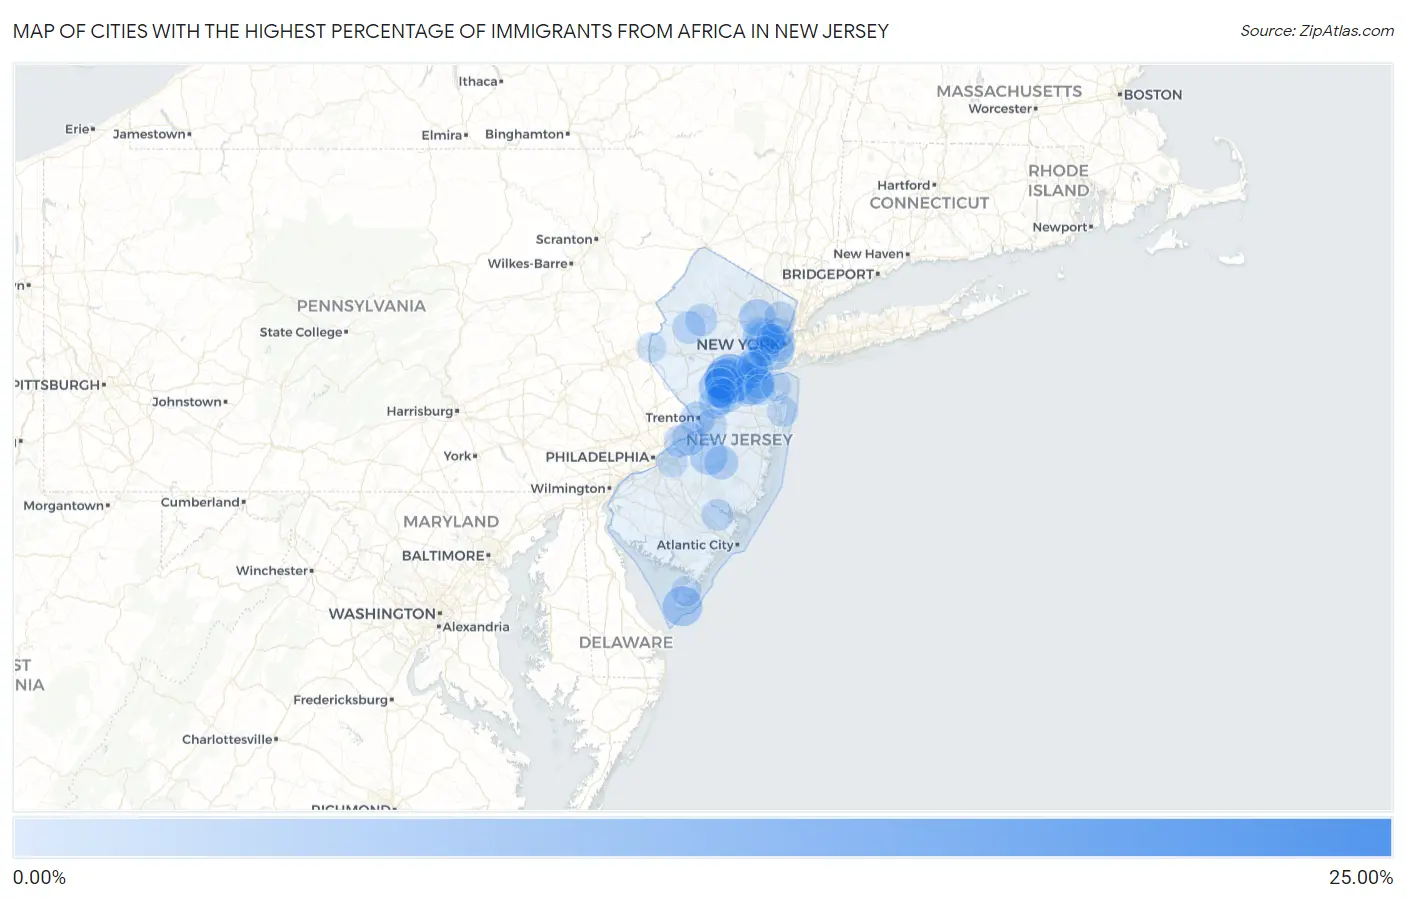
Map of Cities with the Highest Percentage of Immigrants from Africa in New Jersey
0.00%
25.00%
Cities with the Highest Percentage of Immigrants from Africa in New Jersey
| City | Africa | vs State | vs National | |
| 1. | Goshen | 23.22% | 1.42%(+21.8)#-1 | 0.78%(+22.4)#0 |
| 2. | Voorhees | 11.35% | 1.42%(+9.93)#0 | 0.78%(+10.6)#1 |
| 3. | Vauxhall | 10.86% | 1.42%(+9.44)#1 | 0.78%(+10.1)#2 |
| 4. | Union Beach Borough | 10.02% | 1.42%(+8.60)#2 | 0.78%(+9.24)#3 |
| 5. | Madison Park | 7.49% | 1.42%(+6.07)#3 | 0.78%(+6.71)#4 |
| 6. | Six Mile Run | 7.27% | 1.42%(+5.85)#4 | 0.78%(+6.49)#5 |
| 7. | Bayonne | 6.86% | 1.42%(+5.45)#31 | 0.78%(+6.08)#336 |
| 8. | Cape May | 6.36% | 1.42%(+4.94)#32 | 0.78%(+5.58)#337 |
| 9. | Ten Mile Run | 6.29% | 1.42%(+4.87)#33 | 0.78%(+5.51)#338 |
| 10. | Milltown Borough | 6.24% | 1.42%(+4.82)#34 | 0.78%(+5.46)#339 |
| 11. | Andover Borough | 6.02% | 1.42%(+4.61)#35 | 0.78%(+5.24)#340 |
| 12. | Newark | 5.54% | 1.42%(+4.13)#36 | 0.78%(+4.76)#341 |
| 13. | Pemberton Heights | 5.22% | 1.42%(+3.81)#37 | 0.78%(+4.44)#342 |
| 14. | Sayreville Borough | 5.10% | 1.42%(+3.68)#38 | 0.78%(+4.32)#343 |
| 15. | East Orange | 5.09% | 1.42%(+3.67)#39 | 0.78%(+4.31)#344 |
| 16. | Fords | 5.09% | 1.42%(+3.67)#40 | 0.78%(+4.31)#345 |
| 17. | Franklin Park | 5.08% | 1.42%(+3.66)#41 | 0.78%(+4.30)#346 |
| 18. | Singac | 4.91% | 1.42%(+3.50)#42 | 0.78%(+4.13)#347 |
| 19. | Wrightstown Borough | 4.71% | 1.42%(+3.29)#43 | 0.78%(+3.93)#348 |
| 20. | Jersey City | 4.43% | 1.42%(+3.02)#44 | 0.78%(+3.66)#473 |
| 21. | Forsgate | 4.22% | 1.42%(+2.80)#45 | 0.78%(+3.44)#474 |
| 22. | Trenton | 3.68% | 1.42%(+2.27)#46 | 0.78%(+2.90)#475 |
| 23. | Peapack And Gladstone Borough | 3.59% | 1.42%(+2.18)#47 | 0.78%(+2.81)#476 |
| 24. | Dayton | 3.52% | 1.42%(+2.10)#48 | 0.78%(+2.74)#477 |
| 25. | Lodi Borough | 3.48% | 1.42%(+2.06)#49 | 0.78%(+2.70)#478 |
| 26. | Presidential Lakes Estates | 3.37% | 1.42%(+1.96)#50 | 0.78%(+2.59)#479 |
| 27. | Ampere North | 3.20% | 1.42%(+1.78)#51 | 0.78%(+2.42)#480 |
| 28. | Burlington | 3.16% | 1.42%(+1.75)#52 | 0.78%(+2.38)#481 |
| 29. | Encore At Monroe | 2.91% | 1.42%(+1.49)#53 | 0.78%(+2.13)#482 |
| 30. | Bargaintown | 2.83% | 1.42%(+1.41)#54 | 0.78%(+2.05)#483 |
| 31. | Edgewater Borough | 2.83% | 1.42%(+1.41)#55 | 0.78%(+2.05)#484 |
| 32. | Watsessing | 2.77% | 1.42%(+1.35)#56 | 0.78%(+1.99)#485 |
| 33. | Beattystown | 2.70% | 1.42%(+1.28)#57 | 0.78%(+1.92)#486 |
| 34. | Princeton Junction | 2.67% | 1.42%(+1.25)#58 | 0.78%(+1.89)#487 |
| 35. | Somerset | 2.66% | 1.42%(+1.25)#59 | 0.78%(+1.89)#488 |
| 36. | Budd Lake | 2.61% | 1.42%(+1.20)#60 | 0.78%(+1.84)#489 |
| 37. | Beverly | 2.60% | 1.42%(+1.18)#61 | 0.78%(+1.82)#490 |
| 38. | North Caldwell Borough | 2.57% | 1.42%(+1.15)#62 | 0.78%(+1.79)#491 |
| 39. | North Plainfield Borough | 2.55% | 1.42%(+1.13)#63 | 0.78%(+1.77)#492 |
| 40. | Avenel | 2.53% | 1.42%(+1.12)#64 | 0.78%(+1.75)#493 |
| 41. | Helmetta Borough | 2.52% | 1.42%(+1.10)#65 | 0.78%(+1.74)#494 |
| 42. | Tinton Falls Borough | 2.50% | 1.42%(+1.09)#66 | 0.78%(+1.72)#495 |
| 43. | Moonachie Borough | 2.46% | 1.42%(+1.04)#67 | 0.78%(+1.68)#496 |
| 44. | Secaucus | 2.45% | 1.42%(+1.03)#68 | 0.78%(+1.67)#497 |
| 45. | Port Reading | 2.40% | 1.42%(+0.984)#69 | 0.78%(+1.62)#498 |
| 46. | Hightstown Borough | 2.39% | 1.42%(+0.970)#70 | 0.78%(+1.61)#499 |
| 47. | Egg Harbor City | 2.35% | 1.42%(+0.937)#71 | 0.78%(+1.57)#500 |
| 48. | Hackensack | 2.34% | 1.42%(+0.928)#72 | 0.78%(+1.57)#501 |
| 49. | Mount Arlington Borough | 2.32% | 1.42%(+0.903)#73 | 0.78%(+1.54)#502 |
| 50. | Roselle Borough | 2.28% | 1.42%(+0.863)#74 | 0.78%(+1.50)#503 |
| 51. | Monroe Manor | 2.28% | 1.42%(+0.858)#75 | 0.78%(+1.50)#504 |
| 52. | Rainbow Lakes | 2.27% | 1.42%(+0.858)#76 | 0.78%(+1.50)#505 |
| 53. | Woodland Park Borough | 2.14% | 1.42%(+0.727)#77 | 0.78%(+1.37)#506 |
| 54. | Groveville | 2.13% | 1.42%(+0.712)#78 | 0.78%(+1.35)#507 |
| 55. | Pleasant Plains | 2.10% | 1.42%(+0.678)#79 | 0.78%(+1.32)#508 |
| 56. | Pine Beach Borough | 2.08% | 1.42%(+0.665)#80 | 0.78%(+1.30)#509 |
| 57. | Landing | 2.02% | 1.42%(+0.603)#81 | 0.78%(+1.24)#510 |
| 58. | Oakhurst | 2.02% | 1.42%(+0.602)#82 | 0.78%(+1.24)#511 |
| 59. | Parsippany | 2.00% | 1.42%(+0.587)#83 | 0.78%(+1.22)#512 |
| 60. | Middlesex Borough | 1.99% | 1.42%(+0.573)#84 | 0.78%(+1.21)#513 |
| 61. | Glen Gardner Borough | 1.99% | 1.42%(+0.570)#85 | 0.78%(+1.21)#514 |
| 62. | Bloomsbury Borough | 1.98% | 1.42%(+0.560)#86 | 0.78%(+1.20)#515 |
| 63. | Sicklerville | 1.94% | 1.42%(+0.524)#87 | 0.78%(+1.16)#516 |
| 64. | Carlstadt Borough | 1.91% | 1.42%(+0.491)#88 | 0.78%(+1.13)#517 |
| 65. | East Newark Borough | 1.84% | 1.42%(+0.422)#89 | 0.78%(+1.06)#518 |
| 66. | Woodlynne Borough | 1.83% | 1.42%(+0.408)#90 | 0.78%(+1.05)#519 |
| 67. | Saddle River Borough | 1.81% | 1.42%(+0.397)#91 | 0.78%(+1.03)#520 |
| 68. | Pottersville | 1.80% | 1.42%(+0.387)#92 | 0.78%(+1.02)#521 |
| 69. | Preakness | 1.75% | 1.42%(+0.331)#93 | 0.78%(+0.969)#522 |
| 70. | Lindenwold Borough | 1.72% | 1.42%(+0.308)#94 | 0.78%(+0.945)#523 |
| 71. | Woodbridge | 1.72% | 1.42%(+0.303)#95 | 0.78%(+0.941)#524 |
| 72. | Old Bridge | 1.71% | 1.42%(+0.295)#96 | 0.78%(+0.933)#525 |
| 73. | Pleasantdale | 1.71% | 1.42%(+0.289)#97 | 0.78%(+0.927)#526 |
| 74. | Elizabeth | 1.68% | 1.42%(+0.267)#98 | 0.78%(+0.905)#527 |
| 75. | South River Borough | 1.66% | 1.42%(+0.243)#99 | 0.78%(+0.881)#528 |
| 76. | Montvale Borough | 1.64% | 1.42%(+0.223)#100 | 0.78%(+0.861)#529 |
| 77. | William Paterson University Of New Jersey | 1.62% | 1.42%(+0.201)#101 | 0.78%(+0.839)#530 |
| 78. | Ramapo College Of New Jersey | 1.60% | 1.42%(+0.188)#102 | 0.78%(+0.826)#531 |
| 79. | Cliffwood Beach | 1.60% | 1.42%(+0.179)#103 | 0.78%(+0.816)#532 |
| 80. | Highland Park Borough | 1.59% | 1.42%(+0.177)#104 | 0.78%(+0.814)#533 |
| 81. | Carteret Borough | 1.58% | 1.42%(+0.165)#105 | 0.78%(+0.803)#534 |
| 82. | Fairview Borough | 1.58% | 1.42%(+0.163)#106 | 0.78%(+0.801)#535 |
| 83. | Princeton Meadows | 1.58% | 1.42%(+0.161)#107 | 0.78%(+0.799)#536 |
| 84. | Kearny | 1.58% | 1.42%(+0.160)#108 | 0.78%(+0.798)#537 |
| 85. | Heathcote | 1.57% | 1.42%(+0.148)#109 | 0.78%(+0.786)#538 |
| 86. | Strathmore | 1.56% | 1.42%(+0.147)#110 | 0.78%(+0.785)#539 |
| 87. | Kingston Estates | 1.56% | 1.42%(+0.140)#111 | 0.78%(+0.778)#540 |
| 88. | Menlo Park Terrace | 1.54% | 1.42%(+0.123)#112 | 0.78%(+0.761)#541 |
| 89. | Monmouth Junction | 1.54% | 1.42%(+0.121)#113 | 0.78%(+0.759)#542 |
| 90. | Collingswood Borough | 1.53% | 1.42%(+0.111)#114 | 0.78%(+0.749)#543 |
| 91. | Little Ferry Borough | 1.52% | 1.42%(+0.098)#115 | 0.78%(+0.736)#544 |
| 92. | Roselle Park Borough | 1.51% | 1.42%(+0.094)#116 | 0.78%(+0.732)#545 |
| 93. | Whitesboro | 1.48% | 1.42%(+0.065)#117 | 0.78%(+0.702)#546 |
| 94. | Flemington Borough | 1.48% | 1.42%(+0.063)#118 | 0.78%(+0.701)#547 |
| 95. | North Arlington Borough | 1.48% | 1.42%(+0.063)#119 | 0.78%(+0.701)#548 |
| 96. | Englishtown Borough | 1.46% | 1.42%(+0.039)#120 | 0.78%(+0.677)#549 |
| 97. | Stockton University | 1.45% | 1.42%(+0.030)#121 | 0.78%(+0.667)#550 |
| 98. | Phillipsburg | 1.41% | 1.42%(-0.010)#122 | 0.78%(+0.628)#551 |
| 99. | Belford | 1.40% | 1.42%(-0.022)#123 | 0.78%(+0.616)#552 |
| 100. | Tenafly Borough | 1.39% | 1.42%(-0.025)#124 | 0.78%(+0.613)#553 |
Common Questions
What are the Top 10 Cities with the Highest Percentage of Immigrants from Africa in New Jersey?
Top 10 Cities with the Highest Percentage of Immigrants from Africa in New Jersey are:
#1
11.35%
#2
7.49%
#3
7.27%
#4
6.86%
#5
6.36%
#6
6.29%
#7
5.54%
#8
5.22%
#9
5.09%
#10
5.09%
What city has the Highest Percentage of Immigrants from Africa in New Jersey?
Voorhees has the Highest Percentage of Immigrants from Africa in New Jersey with 11.35%.
What is the Percentage of Immigrants from Africa in the State of New Jersey?
Percentage of Immigrants from Africa in New Jersey is 1.42%.
What is the Percentage of Immigrants from Africa in the United States?
Percentage of Immigrants from Africa in the United States is 0.78%.