Cities with the Highest Percentage of Guatemalan Population in New Jersey
RELATED REPORTS & OPTIONS
Guatemalan
New Jersey
Compare Cities
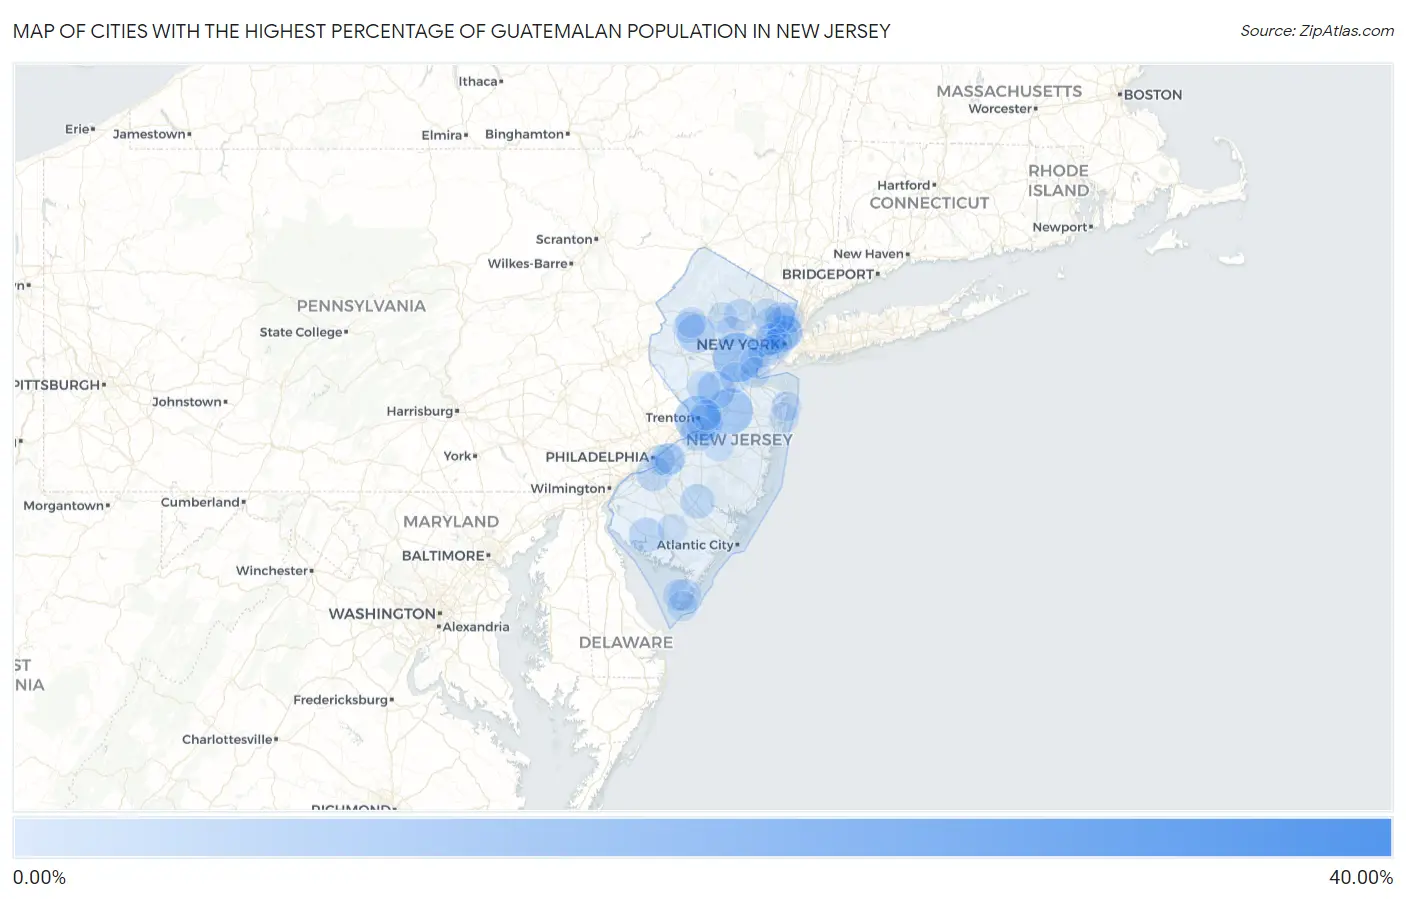
Map of Cities with the Highest Percentage of Guatemalan Population in New Jersey
0.00%
40.00%
Cities with the Highest Percentage of Guatemalan Population in New Jersey
| City | Guatemalan | vs State | vs National | |
| 1. | Teterboro Borough | 38.46% | 0.78%(+37.7)#1 | 0.50%(+38.0)#10 |
| 2. | Dividing Creek | 16.41% | 0.78%(+15.6)#2 | 0.50%(+15.9)#60 |
| 3. | Plainfield | 12.53% | 0.78%(+11.7)#3 | 0.50%(+12.0)#92 |
| 4. | Twin Rivers | 10.38% | 0.78%(+9.60)#4 | 0.50%(+9.87)#126 |
| 5. | Trenton | 10.35% | 0.78%(+9.57)#5 | 0.50%(+9.85)#128 |
| 6. | Roosevelt Borough | 9.16% | 0.78%(+8.38)#6 | 0.50%(+8.66)#148 |
| 7. | Fairview Borough | 8.89% | 0.78%(+8.11)#7 | 0.50%(+8.39)#155 |
| 8. | North Plainfield Borough | 8.33% | 0.78%(+7.55)#8 | 0.50%(+7.83)#165 |
| 9. | Cliffside Park Borough | 7.07% | 0.78%(+6.29)#9 | 0.50%(+6.57)#205 |
| 10. | Flemington Borough | 6.93% | 0.78%(+6.15)#10 | 0.50%(+6.42)#211 |
| 11. | Bound Brook Borough | 6.61% | 0.78%(+5.83)#11 | 0.50%(+6.11)#228 |
| 12. | Swedesboro Borough | 6.58% | 0.78%(+5.80)#12 | 0.50%(+6.07)#230 |
| 13. | Long Valley | 5.91% | 0.78%(+5.13)#13 | 0.50%(+5.41)#268 |
| 14. | East Rocky Hill | 5.35% | 0.78%(+4.57)#14 | 0.50%(+4.85)#300 |
| 15. | Gillette | 5.05% | 0.78%(+4.27)#15 | 0.50%(+4.55)#321 |
| 16. | Palisades Park Borough | 4.80% | 0.78%(+4.02)#16 | 0.50%(+4.30)#340 |
| 17. | White Horse | 4.59% | 0.78%(+3.81)#17 | 0.50%(+4.09)#358 |
| 18. | Netcong Borough | 4.36% | 0.78%(+3.58)#18 | 0.50%(+3.86)#379 |
| 19. | West New York | 4.00% | 0.78%(+3.22)#19 | 0.50%(+3.49)#431 |
| 20. | Woodbury | 3.55% | 0.78%(+2.77)#20 | 0.50%(+3.04)#483 |
| 21. | Roebling | 3.55% | 0.78%(+2.76)#21 | 0.50%(+3.04)#484 |
| 22. | Bridgeton | 3.50% | 0.78%(+2.72)#22 | 0.50%(+2.99)#493 |
| 23. | Hammonton | 3.30% | 0.78%(+2.52)#23 | 0.50%(+2.79)#516 |
| 24. | Glen Gardner Borough | 2.98% | 0.78%(+2.20)#24 | 0.50%(+2.48)#570 |
| 25. | Watsessing | 2.95% | 0.78%(+2.17)#25 | 0.50%(+2.45)#579 |
| 26. | Guttenberg | 2.91% | 0.78%(+2.13)#26 | 0.50%(+2.40)#597 |
| 27. | Skillman | 2.69% | 0.78%(+1.91)#27 | 0.50%(+2.19)#647 |
| 28. | Bernardsville Borough | 2.56% | 0.78%(+1.78)#28 | 0.50%(+2.06)#684 |
| 29. | Golden Triangle | 2.40% | 0.78%(+1.62)#29 | 0.50%(+1.90)#729 |
| 30. | Ridgefield Borough | 2.27% | 0.78%(+1.49)#30 | 0.50%(+1.76)#767 |
| 31. | Saddle River Borough | 2.23% | 0.78%(+1.45)#31 | 0.50%(+1.73)#781 |
| 32. | Rio Grande | 2.17% | 0.78%(+1.39)#32 | 0.50%(+1.67)#795 |
| 33. | Victory Gardens Borough | 2.04% | 0.78%(+1.26)#33 | 0.50%(+1.54)#829 |
| 34. | Ridgefield Park | 1.99% | 0.78%(+1.21)#34 | 0.50%(+1.49)#849 |
| 35. | Boonton | 1.84% | 0.78%(+1.06)#35 | 0.50%(+1.34)#899 |
| 36. | Elizabeth | 1.77% | 0.78%(+0.985)#36 | 0.50%(+1.26)#935 |
| 37. | Prospect Park Borough | 1.75% | 0.78%(+0.966)#37 | 0.50%(+1.24)#947 |
| 38. | Union City | 1.73% | 0.78%(+0.952)#38 | 0.50%(+1.23)#956 |
| 39. | Villas | 1.66% | 0.78%(+0.882)#39 | 0.50%(+1.16)#985 |
| 40. | Beattystown | 1.59% | 0.78%(+0.807)#40 | 0.50%(+1.08)#1,022 |
| 41. | Pemberton Borough | 1.57% | 0.78%(+0.789)#41 | 0.50%(+1.07)#1,032 |
| 42. | Leonia Borough | 1.55% | 0.78%(+0.772)#42 | 0.50%(+1.05)#1,038 |
| 43. | Butler Borough | 1.53% | 0.78%(+0.748)#43 | 0.50%(+1.02)#1,057 |
| 44. | South Plainfield Borough | 1.52% | 0.78%(+0.740)#44 | 0.50%(+1.02)#1,061 |
| 45. | Hightstown Borough | 1.48% | 0.78%(+0.703)#45 | 0.50%(+0.980)#1,083 |
| 46. | Stratford Borough | 1.42% | 0.78%(+0.641)#46 | 0.50%(+0.918)#1,134 |
| 47. | Chester Borough | 1.42% | 0.78%(+0.638)#47 | 0.50%(+0.915)#1,136 |
| 48. | South Bound Brook Borough | 1.41% | 0.78%(+0.625)#48 | 0.50%(+0.901)#1,144 |
| 49. | Cherry Hill Mall | 1.38% | 0.78%(+0.597)#49 | 0.50%(+0.873)#1,165 |
| 50. | Newark | 1.36% | 0.78%(+0.581)#50 | 0.50%(+0.857)#1,176 |
| 51. | South Toms River Borough | 1.34% | 0.78%(+0.557)#51 | 0.50%(+0.834)#1,194 |
| 52. | North Arlington Borough | 1.33% | 0.78%(+0.553)#52 | 0.50%(+0.829)#1,196 |
| 53. | South River Borough | 1.33% | 0.78%(+0.550)#53 | 0.50%(+0.827)#1,199 |
| 54. | Passaic | 1.33% | 0.78%(+0.548)#54 | 0.50%(+0.825)#1,200 |
| 55. | Union | 1.31% | 0.78%(+0.531)#55 | 0.50%(+0.807)#1,214 |
| 56. | Cresskill Borough | 1.27% | 0.78%(+0.493)#56 | 0.50%(+0.770)#1,237 |
| 57. | North Haledon Borough | 1.27% | 0.78%(+0.492)#57 | 0.50%(+0.768)#1,240 |
| 58. | Kearny | 1.23% | 0.78%(+0.451)#58 | 0.50%(+0.728)#1,276 |
| 59. | Englewood | 1.21% | 0.78%(+0.425)#59 | 0.50%(+0.702)#1,302 |
| 60. | Raritan Borough | 1.18% | 0.78%(+0.400)#60 | 0.50%(+0.676)#1,326 |
| 61. | Mercerville | 1.16% | 0.78%(+0.375)#61 | 0.50%(+0.652)#1,343 |
| 62. | Wanaque Borough | 1.12% | 0.78%(+0.343)#62 | 0.50%(+0.619)#1,381 |
| 63. | Freehold Borough | 1.10% | 0.78%(+0.324)#63 | 0.50%(+0.600)#1,397 |
| 64. | Hopewell Borough | 1.10% | 0.78%(+0.315)#64 | 0.50%(+0.592)#1,406 |
| 65. | Haworth Borough | 1.08% | 0.78%(+0.297)#65 | 0.50%(+0.573)#1,426 |
| 66. | Hackensack | 1.07% | 0.78%(+0.290)#66 | 0.50%(+0.567)#1,430 |
| 67. | Alpha Borough | 1.03% | 0.78%(+0.254)#67 | 0.50%(+0.531)#1,473 |
| 68. | New Brunswick | 1.00% | 0.78%(+0.221)#68 | 0.50%(+0.497)#1,506 |
| 69. | Runnemede Borough | 0.96% | 0.78%(+0.182)#69 | 0.50%(+0.459)#1,546 |
| 70. | Hackettstown | 0.96% | 0.78%(+0.179)#70 | 0.50%(+0.455)#1,550 |
| 71. | Hillsdale Borough | 0.96% | 0.78%(+0.177)#71 | 0.50%(+0.454)#1,553 |
| 72. | Ogdensburg Borough | 0.95% | 0.78%(+0.167)#72 | 0.50%(+0.444)#1,564 |
| 73. | Avenel | 0.92% | 0.78%(+0.143)#73 | 0.50%(+0.420)#1,592 |
| 74. | Cape May | 0.92% | 0.78%(+0.143)#74 | 0.50%(+0.420)#1,593 |
| 75. | Caldwell Borough | 0.92% | 0.78%(+0.141)#75 | 0.50%(+0.418)#1,594 |
| 76. | Hawthorne Borough | 0.91% | 0.78%(+0.134)#76 | 0.50%(+0.411)#1,604 |
| 77. | Merchantville Borough | 0.89% | 0.78%(+0.114)#77 | 0.50%(+0.391)#1,621 |
| 78. | Camden | 0.86% | 0.78%(+0.084)#78 | 0.50%(+0.361)#1,664 |
| 79. | Paterson | 0.86% | 0.78%(+0.084)#79 | 0.50%(+0.361)#1,665 |
| 80. | Perth Amboy | 0.84% | 0.78%(+0.063)#80 | 0.50%(+0.340)#1,699 |
| 81. | Northvale Borough | 0.82% | 0.78%(+0.037)#81 | 0.50%(+0.314)#1,739 |
| 82. | Ramapo College Of New Jersey | 0.80% | 0.78%(+0.022)#82 | 0.50%(+0.298)#1,765 |
| 83. | Jersey City | 0.80% | 0.78%(+0.017)#83 | 0.50%(+0.293)#1,769 |
| 84. | Dover | 0.77% | 0.78%(-0.015)#84 | 0.50%(+0.261)#1,803 |
| 85. | Buena Borough | 0.73% | 0.78%(-0.048)#85 | 0.50%(+0.229)#1,877 |
| 86. | Asbury Park | 0.73% | 0.78%(-0.053)#86 | 0.50%(+0.224)#1,889 |
| 87. | Bayonne | 0.70% | 0.78%(-0.078)#87 | 0.50%(+0.198)#1,936 |
| 88. | Mcguire Afb | 0.70% | 0.78%(-0.085)#88 | 0.50%(+0.192)#1,942 |
| 89. | Beachwood Borough | 0.66% | 0.78%(-0.122)#89 | 0.50%(+0.154)#1,997 |
| 90. | Long Branch | 0.66% | 0.78%(-0.123)#90 | 0.50%(+0.154)#2,000 |
| 91. | Midland Park Borough | 0.66% | 0.78%(-0.126)#91 | 0.50%(+0.151)#2,005 |
| 92. | The College Of New Jersey | 0.65% | 0.78%(-0.129)#92 | 0.50%(+0.147)#2,019 |
| 93. | Emerson Borough | 0.65% | 0.78%(-0.135)#93 | 0.50%(+0.141)#2,031 |
| 94. | Closter Borough | 0.64% | 0.78%(-0.138)#94 | 0.50%(+0.139)#2,036 |
| 95. | Montclair State University | 0.64% | 0.78%(-0.139)#95 | 0.50%(+0.138)#2,040 |
| 96. | Elmwood Park Borough | 0.64% | 0.78%(-0.141)#96 | 0.50%(+0.136)#2,045 |
| 97. | Manville Borough | 0.63% | 0.78%(-0.147)#97 | 0.50%(+0.129)#2,056 |
| 98. | Vineland | 0.62% | 0.78%(-0.157)#98 | 0.50%(+0.119)#2,078 |
| 99. | Glen Rock Borough | 0.61% | 0.78%(-0.168)#99 | 0.50%(+0.108)#2,105 |
| 100. | Morristown | 0.61% | 0.78%(-0.169)#100 | 0.50%(+0.107)#2,109 |
Common Questions
What are the Top 10 Cities with the Highest Percentage of Guatemalan Population in New Jersey?
Top 10 Cities with the Highest Percentage of Guatemalan Population in New Jersey are:
#1
12.53%
#2
10.38%
#3
10.35%
#4
5.91%
#5
5.35%
#6
4.59%
#7
4.00%
#8
3.55%
#9
3.55%
#10
3.50%
What city has the Highest Percentage of Guatemalan Population in New Jersey?
Plainfield has the Highest Percentage of Guatemalan Population in New Jersey with 12.53%.
What is the Percentage of Guatemalan Population in the State of New Jersey?
Percentage of Guatemalan Population in New Jersey is 0.78%.
What is the Percentage of Guatemalan Population in the United States?
Percentage of Guatemalan Population in the United States is 0.50%.