Zip Codes with the Highest Percentage of Population Employed in Life, Physical & Social Science in Vineland, NJ
RELATED REPORTS & OPTIONS
Life, Physical & Social Science
Vineland
Compare Zip Codes
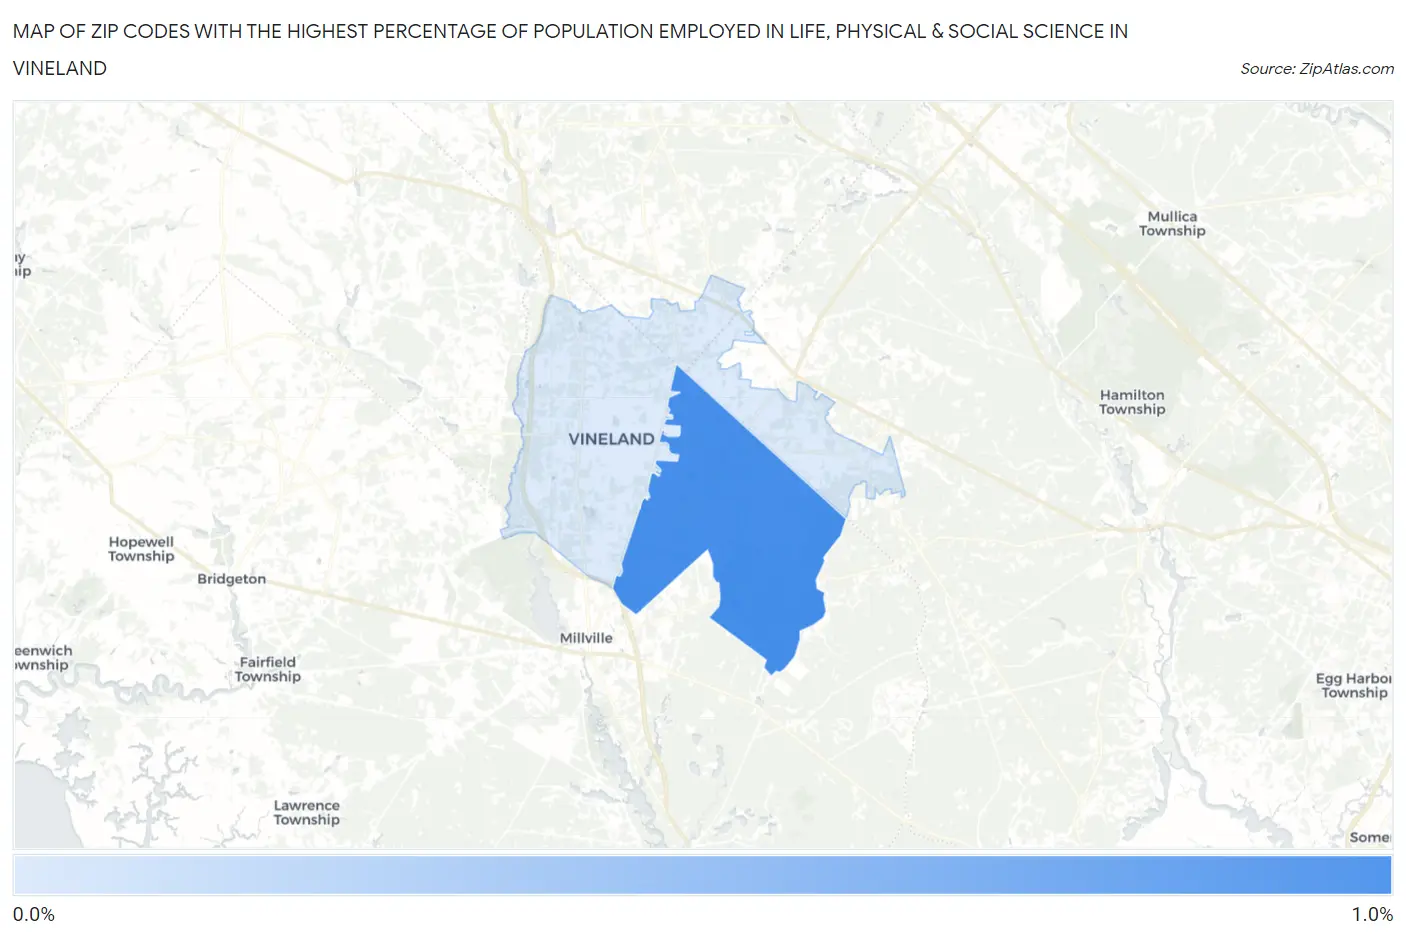
Map of Zip Codes with the Highest Percentage of Population Employed in Life, Physical & Social Science in Vineland
0.11%
0.95%
Zip Codes with the Highest Percentage of Population Employed in Life, Physical & Social Science in Vineland, NJ
| Zip Code | % Employed | vs State | vs National | |
| 1. | 08361 | 0.95% | 1.3%(-0.303)#297 | 1.1%(-0.139)#9,478 |
| 2. | 08360 | 0.11% | 1.3%(-1.15)#491 | 1.1%(-0.983)#19,031 |
1
Common Questions
What are the Top Zip Codes with the Highest Percentage of Population Employed in Life, Physical & Social Science in Vineland, NJ?
Top Zip Codes with the Highest Percentage of Population Employed in Life, Physical & Social Science in Vineland, NJ are:
What zip code has the Highest Percentage of Population Employed in Life, Physical & Social Science in Vineland, NJ?
08361 has the Highest Percentage of Population Employed in Life, Physical & Social Science in Vineland, NJ with 0.95%.
What is the Percentage of Population Employed in Life, Physical & Social Science in Vineland, NJ?
Percentage of Population Employed in Life, Physical & Social Science in Vineland is 0.37%.
What is the Percentage of Population Employed in Life, Physical & Social Science in New Jersey?
Percentage of Population Employed in Life, Physical & Social Science in New Jersey is 1.3%.
What is the Percentage of Population Employed in Life, Physical & Social Science in the United States?
Percentage of Population Employed in Life, Physical & Social Science in the United States is 1.1%.