Cities with the Highest Percentage of Immigrants from Eastern Asia in New Jersey
RELATED REPORTS & OPTIONS
Eastern Asia
New Jersey
Compare Cities
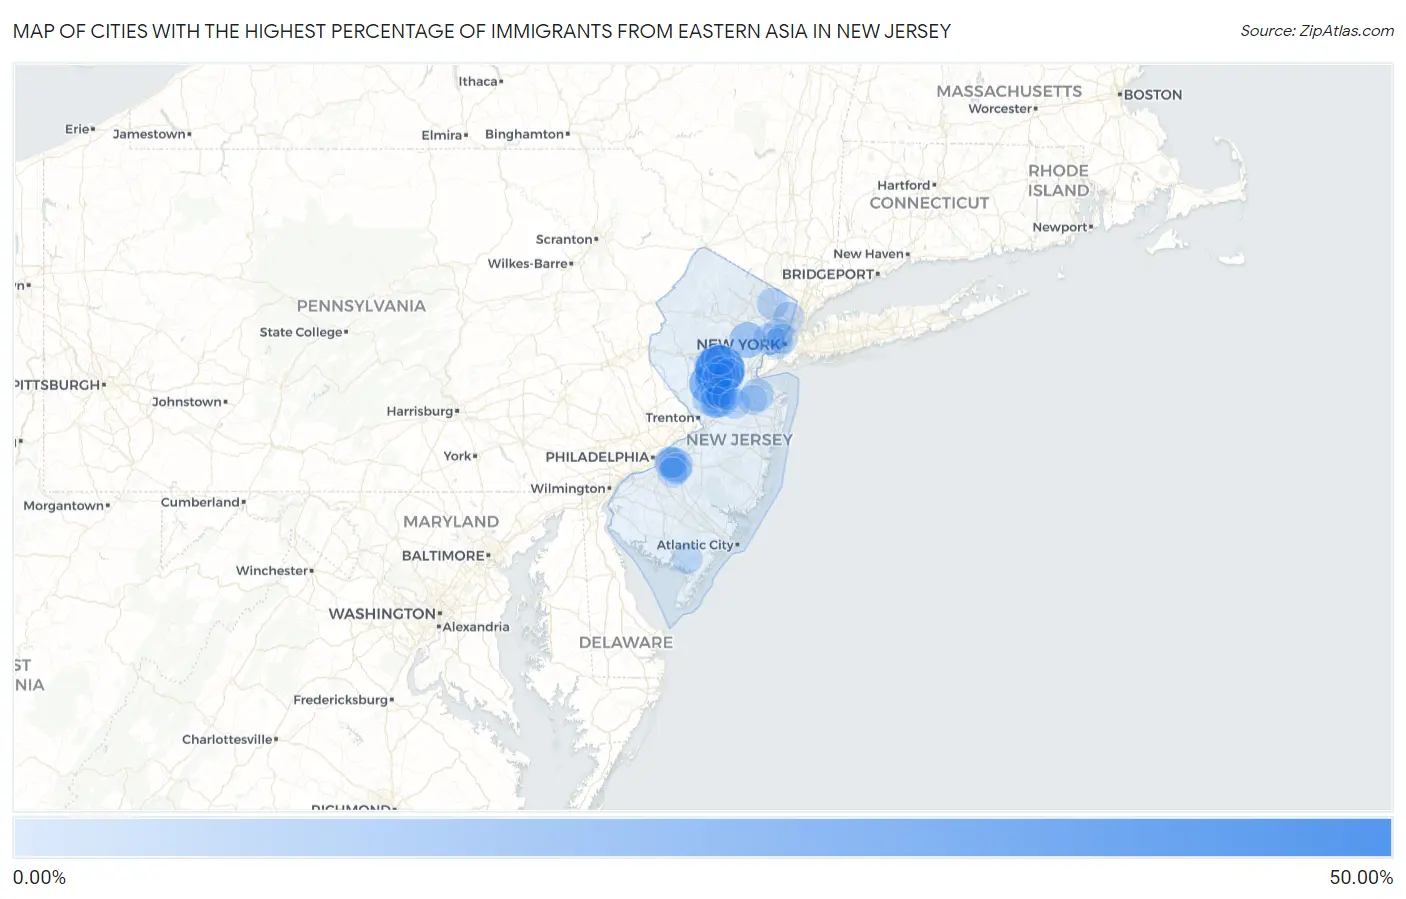
Map of Cities with the Highest Percentage of Immigrants from Eastern Asia in New Jersey
0.00%
50.00%
Cities with the Highest Percentage of Immigrants from Eastern Asia in New Jersey
| City | Eastern Asia | vs State | vs National | |
| 1. | Palisades Park Borough | 42.24% | 2.01%(+40.2)#1 | 1.28%(+41.0)#6 |
| 2. | Zarephath | 39.19% | 2.01%(+37.2)#2 | 1.28%(+37.9)#9 |
| 3. | Fort Lee Borough | 27.48% | 2.01%(+25.5)#3 | 1.28%(+26.2)#25 |
| 4. | Edgewater Borough | 24.45% | 2.01%(+22.4)#4 | 1.28%(+23.2)#31 |
| 5. | Harlingen | 23.78% | 2.01%(+21.8)#5 | 1.28%(+22.5)#32 |
| 6. | Leonia Borough | 22.82% | 2.01%(+20.8)#6 | 1.28%(+21.5)#36 |
| 7. | Ridgefield Borough | 21.68% | 2.01%(+19.7)#7 | 1.28%(+20.4)#38 |
| 8. | Norwood Borough | 21.51% | 2.01%(+19.5)#8 | 1.28%(+20.2)#40 |
| 9. | Englewood Cliffs Borough | 20.67% | 2.01%(+18.7)#9 | 1.28%(+19.4)#45 |
| 10. | Old Tappan Borough | 19.70% | 2.01%(+17.7)#10 | 1.28%(+18.4)#49 |
| 11. | Alpine Borough | 17.74% | 2.01%(+15.7)#11 | 1.28%(+16.5)#59 |
| 12. | Cresskill Borough | 17.09% | 2.01%(+15.1)#12 | 1.28%(+15.8)#60 |
| 13. | Northvale Borough | 16.82% | 2.01%(+14.8)#13 | 1.28%(+15.5)#63 |
| 14. | Closter Borough | 16.33% | 2.01%(+14.3)#14 | 1.28%(+15.1)#67 |
| 15. | Tenafly Borough | 16.26% | 2.01%(+14.2)#15 | 1.28%(+15.0)#68 |
| 16. | Short Hills | 13.45% | 2.01%(+11.4)#16 | 1.28%(+12.2)#88 |
| 17. | Barnegat Light Borough | 12.18% | 2.01%(+10.2)#17 | 1.28%(+10.9)#107 |
| 18. | River Edge Borough | 11.84% | 2.01%(+9.82)#18 | 1.28%(+10.6)#116 |
| 19. | Demarest Borough | 11.64% | 2.01%(+9.63)#19 | 1.28%(+10.4)#122 |
| 20. | Greentree | 9.60% | 2.01%(+7.59)#20 | 1.28%(+8.33)#174 |
| 21. | Princeton Meadows | 9.30% | 2.01%(+7.28)#21 | 1.28%(+8.02)#182 |
| 22. | Highland Park Borough | 9.30% | 2.01%(+7.28)#22 | 1.28%(+8.02)#183 |
| 23. | Harrington Park Borough | 9.28% | 2.01%(+7.27)#23 | 1.28%(+8.01)#184 |
| 24. | Little Ferry Borough | 9.18% | 2.01%(+7.17)#24 | 1.28%(+7.91)#190 |
| 25. | The Hills | 9.16% | 2.01%(+7.15)#25 | 1.28%(+7.89)#194 |
| 26. | Lakeside-Beebe Run | 9.09% | 2.01%(+7.08)#26 | 1.28%(+7.82)#196 |
| 27. | Forsgate | 8.87% | 2.01%(+6.86)#27 | 1.28%(+7.59)#205 |
| 28. | Belle Mead | 8.81% | 2.01%(+6.80)#28 | 1.28%(+7.54)#209 |
| 29. | Lyons | 8.27% | 2.01%(+6.26)#29 | 1.28%(+7.00)#236 |
| 30. | Morganville | 8.19% | 2.01%(+6.18)#30 | 1.28%(+6.91)#240 |
| 31. | Princeton | 7.99% | 2.01%(+5.98)#31 | 1.28%(+6.72)#249 |
| 32. | Haworth Borough | 7.93% | 2.01%(+5.92)#32 | 1.28%(+6.65)#251 |
| 33. | Plainsboro Center | 7.85% | 2.01%(+5.83)#33 | 1.28%(+6.57)#256 |
| 34. | Allendale Borough | 7.63% | 2.01%(+5.61)#34 | 1.28%(+6.35)#262 |
| 35. | Bradley Gardens | 7.35% | 2.01%(+5.34)#35 | 1.28%(+6.08)#272 |
| 36. | Robbinsville Center | 7.05% | 2.01%(+5.03)#36 | 1.28%(+5.77)#289 |
| 37. | Deans | 6.96% | 2.01%(+4.95)#37 | 1.28%(+5.68)#297 |
| 38. | Cedar Knolls | 6.72% | 2.01%(+4.71)#38 | 1.28%(+5.45)#314 |
| 39. | Kingston | 6.52% | 2.01%(+4.50)#39 | 1.28%(+5.24)#330 |
| 40. | Wood Ridge Borough | 6.49% | 2.01%(+4.48)#40 | 1.28%(+5.22)#333 |
| 41. | Whippany | 6.42% | 2.01%(+4.41)#41 | 1.28%(+5.15)#337 |
| 42. | Ridgewood | 6.35% | 2.01%(+4.34)#42 | 1.28%(+5.08)#340 |
| 43. | Monmouth Junction | 6.34% | 2.01%(+4.32)#43 | 1.28%(+5.06)#341 |
| 44. | Mount Tabor | 6.27% | 2.01%(+4.26)#44 | 1.28%(+5.00)#348 |
| 45. | Ellisburg | 6.15% | 2.01%(+4.14)#45 | 1.28%(+4.88)#358 |
| 46. | Upper Saddle River Borough | 5.98% | 2.01%(+3.96)#46 | 1.28%(+4.70)#373 |
| 47. | Englewood | 5.98% | 2.01%(+3.96)#47 | 1.28%(+4.70)#374 |
| 48. | Green Knoll | 5.94% | 2.01%(+3.92)#48 | 1.28%(+4.66)#378 |
| 49. | Mickleton | 5.92% | 2.01%(+3.90)#49 | 1.28%(+4.64)#380 |
| 50. | Paramus Borough | 5.88% | 2.01%(+3.86)#50 | 1.28%(+4.60)#387 |
| 51. | Middlebush | 5.86% | 2.01%(+3.85)#51 | 1.28%(+4.59)#390 |
| 52. | Franklin Center | 5.86% | 2.01%(+3.84)#52 | 1.28%(+4.58)#392 |
| 53. | Parsippany | 5.76% | 2.01%(+3.75)#53 | 1.28%(+4.48)#400 |
| 54. | Springfield | 5.75% | 2.01%(+3.74)#54 | 1.28%(+4.47)#401 |
| 55. | Cliffside Park Borough | 5.66% | 2.01%(+3.65)#55 | 1.28%(+4.39)#412 |
| 56. | Harrison | 5.65% | 2.01%(+3.64)#56 | 1.28%(+4.38)#415 |
| 57. | Rutgers University-Busch Campus | 5.61% | 2.01%(+3.60)#57 | 1.28%(+4.34)#422 |
| 58. | Mountainside Borough | 5.59% | 2.01%(+3.58)#58 | 1.28%(+4.32)#424 |
| 59. | Glen Rock Borough | 5.51% | 2.01%(+3.50)#59 | 1.28%(+4.23)#429 |
| 60. | Rockleigh Borough | 5.47% | 2.01%(+3.45)#60 | 1.28%(+4.19)#434 |
| 61. | Montvale Borough | 5.42% | 2.01%(+3.41)#61 | 1.28%(+4.14)#439 |
| 62. | Weston | 5.41% | 2.01%(+3.40)#62 | 1.28%(+4.13)#440 |
| 63. | Mountain Lakes Borough | 5.22% | 2.01%(+3.21)#63 | 1.28%(+3.95)#465 |
| 64. | Neshanic | 5.09% | 2.01%(+3.08)#64 | 1.28%(+3.82)#477 |
| 65. | Kingston Estates | 5.07% | 2.01%(+3.06)#65 | 1.28%(+3.80)#481 |
| 66. | Springdale | 5.06% | 2.01%(+3.05)#66 | 1.28%(+3.79)#484 |
| 67. | Princeton Junction | 5.00% | 2.01%(+2.98)#67 | 1.28%(+3.72)#491 |
| 68. | Maywood Borough | 4.86% | 2.01%(+2.85)#68 | 1.28%(+3.58)#513 |
| 69. | East Rutherford Borough | 4.83% | 2.01%(+2.82)#69 | 1.28%(+3.55)#516 |
| 70. | Pine Brook | 4.75% | 2.01%(+2.74)#70 | 1.28%(+3.47)#530 |
| 71. | Somerset | 4.64% | 2.01%(+2.63)#71 | 1.28%(+3.36)#544 |
| 72. | Carlstadt Borough | 4.46% | 2.01%(+2.45)#72 | 1.28%(+3.19)#580 |
| 73. | Secaucus | 4.29% | 2.01%(+2.28)#73 | 1.28%(+3.02)#611 |
| 74. | Roseland Borough | 4.26% | 2.01%(+2.25)#74 | 1.28%(+2.98)#618 |
| 75. | Jersey City | 4.22% | 2.01%(+2.21)#75 | 1.28%(+2.94)#628 |
| 76. | Heathcote | 4.16% | 2.01%(+2.15)#76 | 1.28%(+2.89)#638 |
| 77. | Oradell Borough | 4.15% | 2.01%(+2.14)#77 | 1.28%(+2.88)#641 |
| 78. | Blackwells Mills | 4.12% | 2.01%(+2.11)#78 | 1.28%(+2.84)#643 |
| 79. | Watchung Borough | 4.08% | 2.01%(+2.07)#79 | 1.28%(+2.81)#652 |
| 80. | Keasbey | 3.97% | 2.01%(+1.96)#80 | 1.28%(+2.70)#668 |
| 81. | Hoboken | 3.95% | 2.01%(+1.94)#81 | 1.28%(+2.67)#674 |
| 82. | Chatham Borough | 3.91% | 2.01%(+1.90)#82 | 1.28%(+2.64)#680 |
| 83. | Dayton | 3.90% | 2.01%(+1.89)#83 | 1.28%(+2.62)#685 |
| 84. | Concordia | 3.87% | 2.01%(+1.86)#84 | 1.28%(+2.60)#689 |
| 85. | Lake Hiawatha | 3.85% | 2.01%(+1.83)#85 | 1.28%(+2.57)#697 |
| 86. | Emerson Borough | 3.80% | 2.01%(+1.79)#86 | 1.28%(+2.53)#713 |
| 87. | Towaco | 3.69% | 2.01%(+1.68)#87 | 1.28%(+2.42)#743 |
| 88. | Troy Hills | 3.61% | 2.01%(+1.60)#88 | 1.28%(+2.34)#768 |
| 89. | Franklin Lakes Borough | 3.59% | 2.01%(+1.57)#89 | 1.28%(+2.31)#773 |
| 90. | Saddle River Borough | 3.54% | 2.01%(+1.52)#90 | 1.28%(+2.26)#787 |
| 91. | Belleplain | 3.46% | 2.01%(+1.44)#91 | 1.28%(+2.18)#812 |
| 92. | Echelon | 3.45% | 2.01%(+1.44)#92 | 1.28%(+2.18)#813 |
| 93. | Highlands Borough | 3.40% | 2.01%(+1.39)#93 | 1.28%(+2.13)#838 |
| 94. | Metuchen Borough | 3.36% | 2.01%(+1.35)#94 | 1.28%(+2.09)#849 |
| 95. | Basking Ridge | 3.33% | 2.01%(+1.31)#95 | 1.28%(+2.05)#856 |
| 96. | Regency At Monroe | 3.32% | 2.01%(+1.30)#96 | 1.28%(+2.04)#859 |
| 97. | Mauricetown | 3.31% | 2.01%(+1.30)#97 | 1.28%(+2.03)#862 |
| 98. | New Providence Borough | 3.29% | 2.01%(+1.27)#98 | 1.28%(+2.01)#870 |
| 99. | Martinsville | 3.28% | 2.01%(+1.27)#99 | 1.28%(+2.01)#871 |
| 100. | Robertsville | 3.25% | 2.01%(+1.24)#100 | 1.28%(+1.97)#888 |
Common Questions
What are the Top 10 Cities with the Highest Percentage of Immigrants from Eastern Asia in New Jersey?
Top 10 Cities with the Highest Percentage of Immigrants from Eastern Asia in New Jersey are:
#1
39.19%
#2
23.78%
#3
13.45%
#4
9.60%
#5
9.30%
#6
8.81%
#7
8.19%
#8
7.99%
#9
7.85%
#10
7.35%
What city has the Highest Percentage of Immigrants from Eastern Asia in New Jersey?
Zarephath has the Highest Percentage of Immigrants from Eastern Asia in New Jersey with 39.19%.
What is the Percentage of Immigrants from Eastern Asia in the State of New Jersey?
Percentage of Immigrants from Eastern Asia in New Jersey is 2.01%.
What is the Percentage of Immigrants from Eastern Asia in the United States?
Percentage of Immigrants from Eastern Asia in the United States is 1.28%.