Cities with the Most Immigrants from Haiti in New Jersey
RELATED REPORTS & OPTIONS
Haiti
New Jersey
Compare Cities
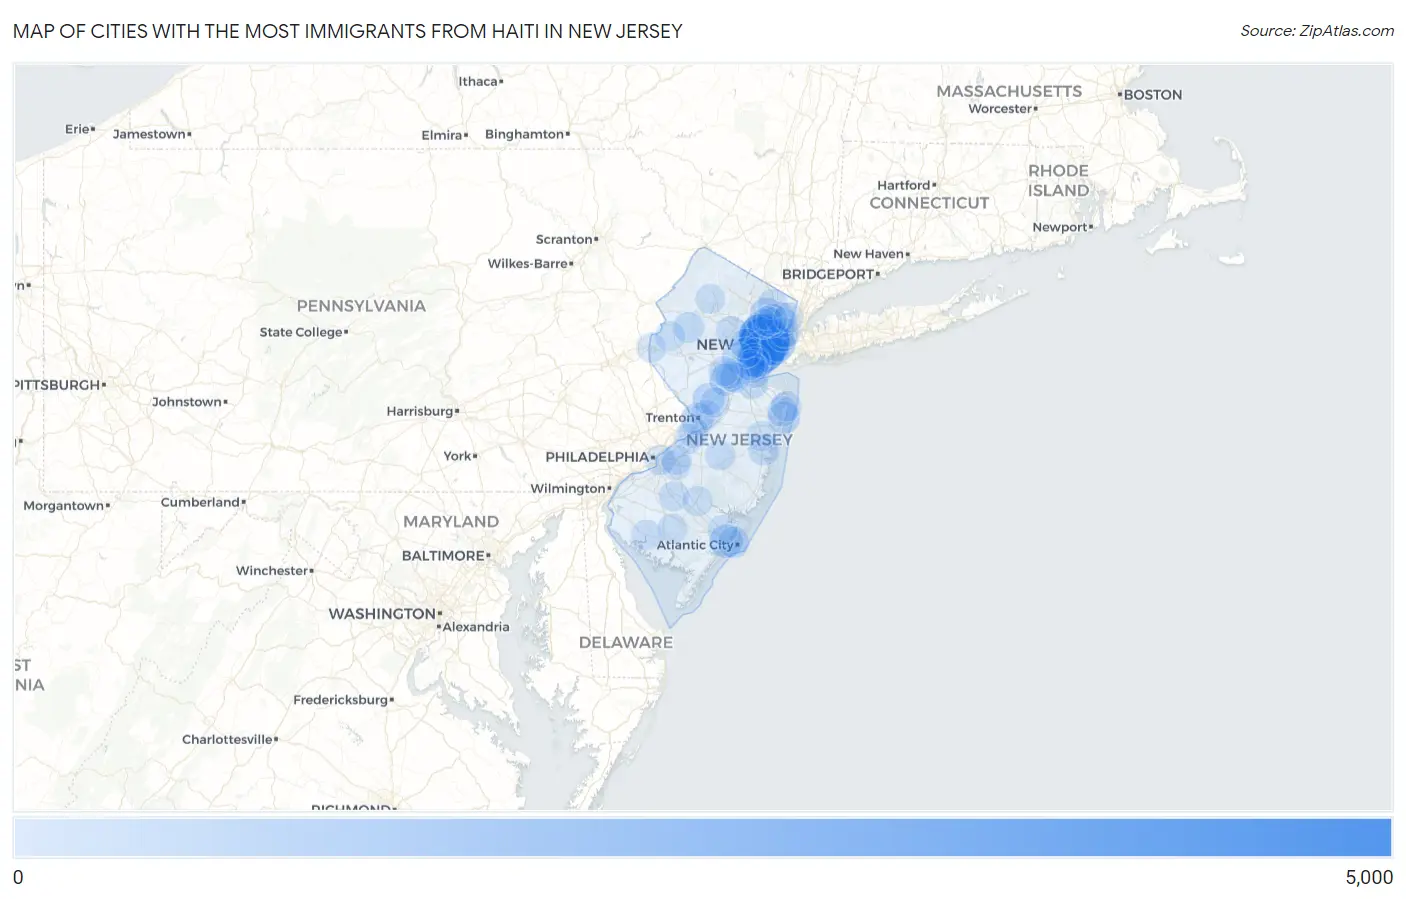
Map of Cities with the Most Immigrants from Haiti in New Jersey
0
5,000
Cities with the Most Immigrants from Haiti in New Jersey
| City | Haiti | vs State | vs National | |
| 1. | Newark | 4,615 | 49,491(9.32%)#1 | 694,547(0.66%)#29 |
| 2. | East Orange | 3,327 | 49,491(6.72%)#2 | 694,547(0.48%)#37 |
| 3. | Elizabeth | 2,807 | 49,491(5.67%)#3 | 694,547(0.40%)#42 |
| 4. | Linden | 2,155 | 49,491(4.35%)#4 | 694,547(0.31%)#51 |
| 5. | Jersey City | 1,374 | 49,491(2.78%)#5 | 694,547(0.20%)#74 |
| 6. | Roselle Borough | 1,366 | 49,491(2.76%)#6 | 694,547(0.20%)#75 |
| 7. | Pleasantville | 797 | 49,491(1.61%)#7 | 694,547(0.11%)#107 |
| 8. | Union | 699 | 49,491(1.41%)#8 | 694,547(0.10%)#123 |
| 9. | Trenton | 569 | 49,491(1.15%)#9 | 694,547(0.08%)#143 |
| 10. | Paterson | 562 | 49,491(1.14%)#10 | 694,547(0.08%)#146 |
| 11. | Asbury Park | 548 | 49,491(1.11%)#11 | 694,547(0.08%)#152 |
| 12. | Rahway | 517 | 49,491(1.04%)#12 | 694,547(0.07%)#163 |
| 13. | Princeton | 429 | 49,491(0.87%)#13 | 694,547(0.06%)#195 |
| 14. | Six Mile Run | 359 | 49,491(0.73%)#14 | 694,547(0.05%)#209 |
| 15. | Bayonne | 340 | 49,491(0.69%)#15 | 694,547(0.05%)#220 |
| 16. | Roselle Park Borough | 273 | 49,491(0.55%)#16 | 694,547(0.04%)#252 |
| 17. | Somerville Borough | 265 | 49,491(0.54%)#17 | 694,547(0.04%)#256 |
| 18. | Atlantic City | 249 | 49,491(0.50%)#18 | 694,547(0.04%)#268 |
| 19. | Toms River | 245 | 49,491(0.50%)#19 | 694,547(0.04%)#269 |
| 20. | Plainfield | 240 | 49,491(0.48%)#20 | 694,547(0.03%)#275 |
| 21. | Carteret Borough | 223 | 49,491(0.45%)#21 | 694,547(0.03%)#291 |
| 22. | Beattystown | 214 | 49,491(0.43%)#22 | 694,547(0.03%)#300 |
| 23. | Madison Park | 204 | 49,491(0.41%)#23 | 694,547(0.03%)#314 |
| 24. | Morristown | 155 | 49,491(0.31%)#24 | 694,547(0.02%)#384 |
| 25. | Union City | 138 | 49,491(0.28%)#25 | 694,547(0.02%)#419 |
| 26. | Neptune City Borough | 137 | 49,491(0.28%)#26 | 694,547(0.02%)#423 |
| 27. | Sicklerville | 130 | 49,491(0.26%)#27 | 694,547(0.02%)#439 |
| 28. | Hackensack | 121 | 49,491(0.24%)#28 | 694,547(0.02%)#469 |
| 29. | Lake Hopatcong | 116 | 49,491(0.23%)#29 | 694,547(0.02%)#483 |
| 30. | Bridgeton | 114 | 49,491(0.23%)#30 | 694,547(0.02%)#492 |
| 31. | Clayton Borough | 109 | 49,491(0.22%)#31 | 694,547(0.02%)#504 |
| 32. | Beachwood Borough | 100 | 49,491(0.20%)#32 | 694,547(0.01%)#534 |
| 33. | Sayreville Borough | 98 | 49,491(0.20%)#33 | 694,547(0.01%)#541 |
| 34. | Oakhurst | 96 | 49,491(0.19%)#34 | 694,547(0.01%)#554 |
| 35. | Lake Hiawatha | 95 | 49,491(0.19%)#35 | 694,547(0.01%)#557 |
| 36. | Long Branch | 87 | 49,491(0.18%)#36 | 694,547(0.01%)#592 |
| 37. | Vauxhall | 80 | 49,491(0.16%)#37 | 694,547(0.01%)#618 |
| 38. | Ampere North | 78 | 49,491(0.16%)#38 | 694,547(0.01%)#630 |
| 39. | Woodbridge | 74 | 49,491(0.15%)#39 | 694,547(0.01%)#649 |
| 40. | South Toms River Borough | 68 | 49,491(0.14%)#40 | 694,547(0.01%)#681 |
| 41. | Avenel | 67 | 49,491(0.14%)#41 | 694,547(0.01%)#685 |
| 42. | Vineland | 64 | 49,491(0.13%)#42 | 694,547(0.01%)#697 |
| 43. | Edgewater Borough | 62 | 49,491(0.13%)#43 | 694,547(0.01%)#718 |
| 44. | Bergenfield Borough | 58 | 49,491(0.12%)#44 | 694,547(0.01%)#742 |
| 45. | Camden | 57 | 49,491(0.12%)#45 | 694,547(0.01%)#748 |
| 46. | Browns Mills | 57 | 49,491(0.12%)#46 | 694,547(0.01%)#755 |
| 47. | Perth Amboy | 56 | 49,491(0.11%)#47 | 694,547(0.01%)#759 |
| 48. | East Franklin | 56 | 49,491(0.11%)#48 | 694,547(0.01%)#761 |
| 49. | Iselin | 55 | 49,491(0.11%)#49 | 694,547(0.01%)#770 |
| 50. | New Milford Borough | 55 | 49,491(0.11%)#50 | 694,547(0.01%)#771 |
| 51. | Westfield | 54 | 49,491(0.11%)#51 | 694,547(0.01%)#777 |
| 52. | Palmyra Borough | 51 | 49,491(0.10%)#52 | 694,547(0.01%)#806 |
| 53. | Park Ridge Borough | 49 | 49,491(0.10%)#53 | 694,547(0.01%)#828 |
| 54. | Kenilworth Borough | 49 | 49,491(0.10%)#54 | 694,547(0.01%)#829 |
| 55. | Parsippany | 45 | 49,491(0.09%)#55 | 694,547(0.01%)#866 |
| 56. | New Brunswick | 44 | 49,491(0.09%)#56 | 694,547(0.01%)#870 |
| 57. | Ridgefield Park | 44 | 49,491(0.09%)#57 | 694,547(0.01%)#874 |
| 58. | Prospect Park Borough | 44 | 49,491(0.09%)#58 | 694,547(0.01%)#877 |
| 59. | Williamstown | 43 | 49,491(0.09%)#59 | 694,547(0.01%)#884 |
| 60. | West New York | 39 | 49,491(0.08%)#60 | 694,547(0.01%)#920 |
| 61. | Carlstadt Borough | 39 | 49,491(0.08%)#61 | 694,547(0.01%)#935 |
| 62. | Towaco | 39 | 49,491(0.08%)#62 | 694,547(0.01%)#937 |
| 63. | Greentree | 37 | 49,491(0.07%)#63 | 694,547(0.01%)#954 |
| 64. | Brass Castle | 36 | 49,491(0.07%)#64 | 694,547(0.01%)#972 |
| 65. | Passaic | 35 | 49,491(0.07%)#65 | 694,547(0.01%)#977 |
| 66. | Pomona | 35 | 49,491(0.07%)#66 | 694,547(0.01%)#984 |
| 67. | Ridgewood | 33 | 49,491(0.07%)#67 | 694,547(0.00%)#1,000 |
| 68. | Garfield | 31 | 49,491(0.06%)#68 | 694,547(0.00%)#1,030 |
| 69. | Bridgewater Center | 30 | 49,491(0.06%)#69 | 694,547(0.00%)#1,046 |
| 70. | Mercerville | 28 | 49,491(0.06%)#70 | 694,547(0.00%)#1,069 |
| 71. | Hammonton | 27 | 49,491(0.05%)#71 | 694,547(0.00%)#1,083 |
| 72. | North Plainfield Borough | 26 | 49,491(0.05%)#72 | 694,547(0.00%)#1,094 |
| 73. | Phillipsburg | 26 | 49,491(0.05%)#73 | 694,547(0.00%)#1,097 |
| 74. | Summit | 25 | 49,491(0.05%)#74 | 694,547(0.00%)#1,120 |
| 75. | Upper Montclair | 25 | 49,491(0.05%)#75 | 694,547(0.00%)#1,126 |
| 76. | Lakewood | 24 | 49,491(0.05%)#76 | 694,547(0.00%)#1,133 |
| 77. | Florence | 24 | 49,491(0.05%)#77 | 694,547(0.00%)#1,144 |
| 78. | Menlo Park Terrace | 24 | 49,491(0.05%)#78 | 694,547(0.00%)#1,147 |
| 79. | Clifton | 23 | 49,491(0.05%)#79 | 694,547(0.00%)#1,152 |
| 80. | Somerset | 22 | 49,491(0.04%)#80 | 694,547(0.00%)#1,179 |
| 81. | Eatontown Borough | 21 | 49,491(0.04%)#81 | 694,547(0.00%)#1,195 |
| 82. | Florham Park Borough | 21 | 49,491(0.04%)#82 | 694,547(0.00%)#1,196 |
| 83. | Ramblewood | 21 | 49,491(0.04%)#83 | 694,547(0.00%)#1,202 |
| 84. | Franklin Center | 21 | 49,491(0.04%)#84 | 694,547(0.00%)#1,203 |
| 85. | Tinton Falls Borough | 20 | 49,491(0.04%)#85 | 694,547(0.00%)#1,217 |
| 86. | Watsessing | 20 | 49,491(0.04%)#86 | 694,547(0.00%)#1,222 |
| 87. | Rutgers University-Busch Campus | 19 | 49,491(0.04%)#87 | 694,547(0.00%)#1,239 |
| 88. | Englewood | 18 | 49,491(0.04%)#88 | 694,547(0.00%)#1,256 |
| 89. | Lake Mohawk | 18 | 49,491(0.04%)#89 | 694,547(0.00%)#1,266 |
| 90. | Runnemede Borough | 18 | 49,491(0.04%)#90 | 694,547(0.00%)#1,267 |
| 91. | Spotswood Borough | 18 | 49,491(0.04%)#91 | 694,547(0.00%)#1,268 |
| 92. | Connecticut Farms | 18 | 49,491(0.04%)#92 | 694,547(0.00%)#1,278 |
| 93. | Princeton Junction | 17 | 49,491(0.03%)#93 | 694,547(0.00%)#1,293 |
| 94. | Pine Hill Borough | 16 | 49,491(0.03%)#94 | 694,547(0.00%)#1,317 |
| 95. | Burlington | 16 | 49,491(0.03%)#95 | 694,547(0.00%)#1,318 |
| 96. | Chatham Borough | 16 | 49,491(0.03%)#96 | 694,547(0.00%)#1,319 |
| 97. | Pleasantdale | 16 | 49,491(0.03%)#97 | 694,547(0.00%)#1,329 |
| 98. | Hopatcong Borough | 14 | 49,491(0.03%)#98 | 694,547(0.00%)#1,384 |
| 99. | Netcong Borough | 14 | 49,491(0.03%)#99 | 694,547(0.00%)#1,393 |
| 100. | Clearbrook | 14 | 49,491(0.03%)#100 | 694,547(0.00%)#1,395 |
Common Questions
What are the Top 10 Cities with the Most Immigrants from Haiti in New Jersey?
Top 10 Cities with the Most Immigrants from Haiti in New Jersey are:
#1
4,615
#2
3,327
#3
2,807
#4
2,155
#5
1,374
#6
797
#7
569
#8
562
#9
548
#10
517
What city has the Most Immigrants from Haiti in New Jersey?
Newark has the Most Immigrants from Haiti in New Jersey with 4,615.
What is the Total Immigrants from Haiti in the State of New Jersey?
Total Immigrants from Haiti in New Jersey is 49,491.
What is the Total Immigrants from Haiti in the United States?
Total Immigrants from Haiti in the United States is 694,547.