Cities with the Highest Percentage of Population Employed in Community & Social Service in New Jersey
RELATED REPORTS & OPTIONS
Community & Social Service
New Jersey
Compare Cities
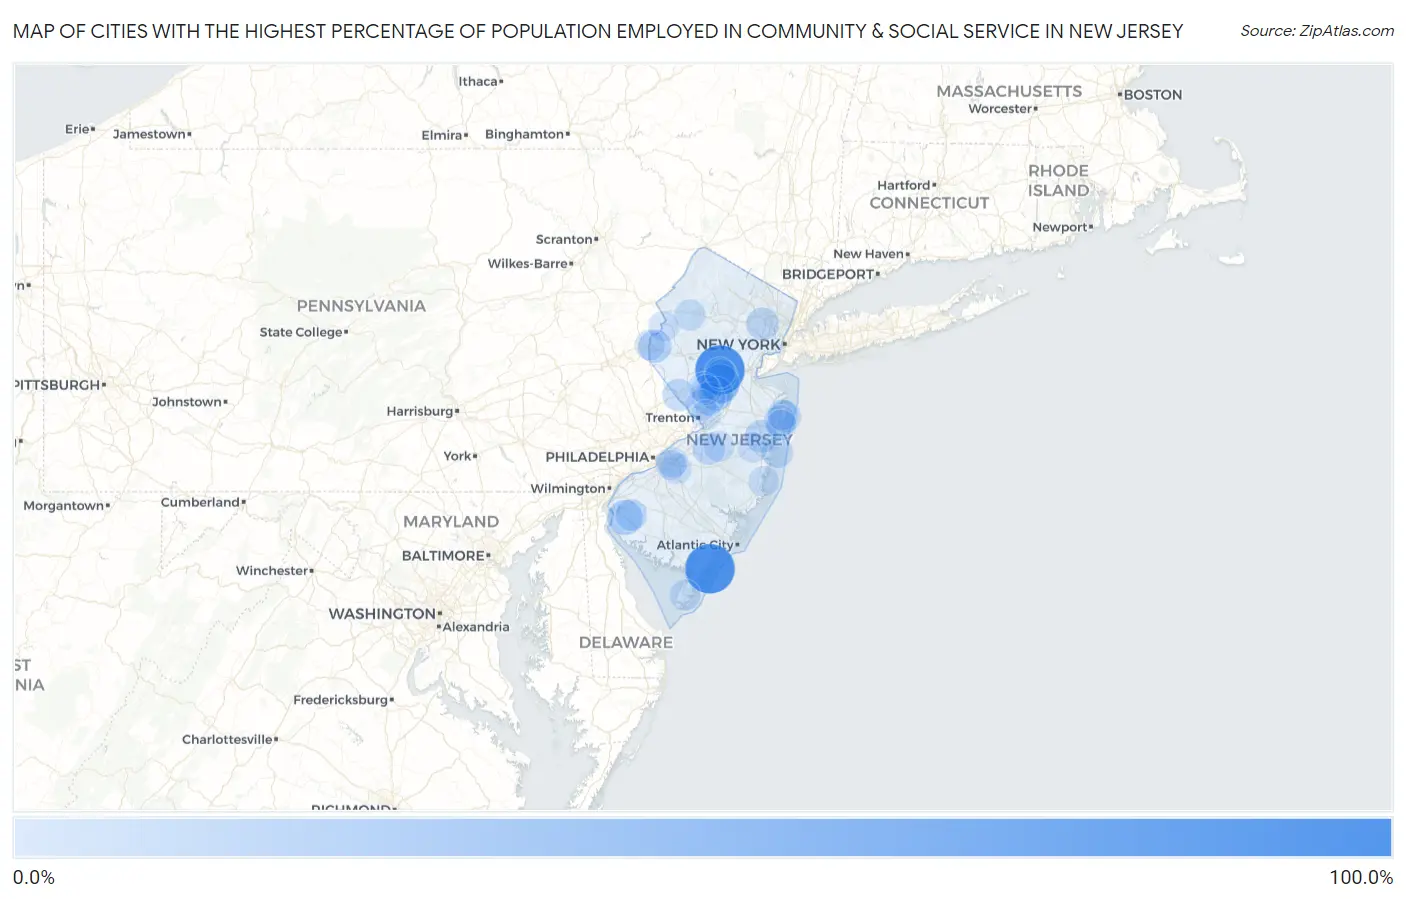
Map of Cities with the Highest Percentage of Population Employed in Community & Social Service in New Jersey
0.0%
100.0%
Cities with the Highest Percentage of Population Employed in Community & Social Service in New Jersey
| City | % Employed | vs State | vs National | |
| 1. | Strathmere | 82.2% | 12.7%(+69.5)#1 | 11.2%(+71.0)#59 |
| 2. | Zarephath | 81.8% | 12.7%(+69.1)#2 | 11.2%(+70.6)#60 |
| 3. | Hibernia | 80.0% | 12.7%(+67.3)#3 | 11.2%(+68.8)#64 |
| 4. | Roadstown | 74.6% | 12.7%(+61.9)#4 | 11.2%(+63.4)#78 |
| 5. | Rutgers University-Busch Campus | 54.7% | 12.7%(+42.0)#5 | 11.2%(+43.5)#157 |
| 6. | Pleasant Plains | 47.7% | 12.7%(+35.0)#6 | 11.2%(+36.5)#233 |
| 7. | Rutgers University-Livingston Campus | 47.1% | 12.7%(+34.3)#7 | 11.2%(+35.8)#240 |
| 8. | Cape May Point Borough | 43.5% | 12.7%(+30.8)#8 | 11.2%(+32.3)#298 |
| 9. | Leeds Point | 39.0% | 12.7%(+26.3)#9 | 11.2%(+27.7)#373 |
| 10. | Beesleys Point | 38.4% | 12.7%(+25.7)#10 | 11.2%(+27.2)#390 |
| 11. | Quinton | 34.6% | 12.7%(+21.9)#11 | 11.2%(+23.4)#517 |
| 12. | Delmont | 34.5% | 12.7%(+21.8)#12 | 11.2%(+23.3)#520 |
| 13. | Bridgeport | 33.3% | 12.7%(+20.6)#13 | 11.2%(+22.1)#560 |
| 14. | Kingston | 31.7% | 12.7%(+19.0)#14 | 11.2%(+20.5)#649 |
| 15. | Regency At Monroe | 31.7% | 12.7%(+19.0)#15 | 11.2%(+20.5)#651 |
| 16. | Renaissance At Monroe | 31.5% | 12.7%(+18.8)#16 | 11.2%(+20.3)#661 |
| 17. | Tuckahoe | 30.8% | 12.7%(+18.1)#17 | 11.2%(+19.6)#700 |
| 18. | Hopewell Borough | 29.1% | 12.7%(+16.4)#18 | 11.2%(+17.9)#822 |
| 19. | Princeton | 29.0% | 12.7%(+16.3)#19 | 11.2%(+17.8)#824 |
| 20. | Lopatcong Overlook | 28.6% | 12.7%(+15.9)#20 | 11.2%(+17.4)#852 |
| 21. | Lakewood | 27.6% | 12.7%(+14.9)#21 | 11.2%(+16.4)#940 |
| 22. | Rocky Hill Borough | 27.0% | 12.7%(+14.3)#22 | 11.2%(+15.8)#1,005 |
| 23. | Highland Park Borough | 27.0% | 12.7%(+14.3)#23 | 11.2%(+15.8)#1,010 |
| 24. | The College Of New Jersey | 26.9% | 12.7%(+14.2)#24 | 11.2%(+15.7)#1,017 |
| 25. | Upper Montclair | 26.8% | 12.7%(+14.1)#25 | 11.2%(+15.6)#1,025 |
| 26. | Lambertville | 26.5% | 12.7%(+13.8)#26 | 11.2%(+15.3)#1,057 |
| 27. | Brielle Borough | 26.4% | 12.7%(+13.7)#27 | 11.2%(+15.2)#1,065 |
| 28. | Juliustown | 25.8% | 12.7%(+13.1)#28 | 11.2%(+14.6)#1,125 |
| 29. | Loch Arbour | 25.5% | 12.7%(+12.8)#29 | 11.2%(+14.3)#1,149 |
| 30. | Goshen | 25.1% | 12.7%(+12.4)#30 | 11.2%(+13.9)#1,195 |
| 31. | Shark River Hills | 24.9% | 12.7%(+12.2)#31 | 11.2%(+13.7)#1,249 |
| 32. | Surf City Borough | 24.9% | 12.7%(+12.2)#32 | 11.2%(+13.7)#1,251 |
| 33. | Pennington Borough | 24.9% | 12.7%(+12.2)#33 | 11.2%(+13.7)#1,254 |
| 34. | Pottersville | 24.8% | 12.7%(+12.1)#34 | 11.2%(+13.6)#1,263 |
| 35. | Barnegat Light Borough | 24.8% | 12.7%(+12.1)#35 | 11.2%(+13.5)#1,271 |
| 36. | Alloway | 24.4% | 12.7%(+11.7)#36 | 11.2%(+13.2)#1,318 |
| 37. | Mickleton | 24.2% | 12.7%(+11.5)#37 | 11.2%(+13.0)#1,352 |
| 38. | Glen Rock Borough | 23.9% | 12.7%(+11.2)#38 | 11.2%(+12.7)#1,411 |
| 39. | Newfield Borough | 23.8% | 12.7%(+11.1)#39 | 11.2%(+12.6)#1,422 |
| 40. | Interlaken Borough | 23.8% | 12.7%(+11.1)#40 | 11.2%(+12.5)#1,446 |
| 41. | Watsessing | 23.6% | 12.7%(+10.9)#41 | 11.2%(+12.4)#1,465 |
| 42. | Mount Royal | 23.5% | 12.7%(+10.8)#42 | 11.2%(+12.3)#1,493 |
| 43. | Dover Beaches North | 23.4% | 12.7%(+10.7)#43 | 11.2%(+12.2)#1,515 |
| 44. | Demarest Borough | 23.4% | 12.7%(+10.7)#44 | 11.2%(+12.2)#1,526 |
| 45. | Panther Valley | 23.2% | 12.7%(+10.5)#45 | 11.2%(+12.0)#1,559 |
| 46. | Metuchen Borough | 23.1% | 12.7%(+10.4)#46 | 11.2%(+11.8)#1,594 |
| 47. | Island Heights Borough | 23.0% | 12.7%(+10.3)#47 | 11.2%(+11.7)#1,610 |
| 48. | East Millstone | 22.9% | 12.7%(+10.2)#48 | 11.2%(+11.7)#1,619 |
| 49. | Cranford | 22.9% | 12.7%(+10.2)#49 | 11.2%(+11.7)#1,622 |
| 50. | Rio Grande | 22.6% | 12.7%(+9.87)#50 | 11.2%(+11.4)#1,692 |
| 51. | Marshallville | 22.6% | 12.7%(+9.85)#51 | 11.2%(+11.3)#1,696 |
| 52. | Little Silver Borough | 22.3% | 12.7%(+9.63)#52 | 11.2%(+11.1)#1,749 |
| 53. | Beach Haven Borough | 22.3% | 12.7%(+9.61)#53 | 11.2%(+11.1)#1,752 |
| 54. | Glen Ridge Borough | 22.3% | 12.7%(+9.56)#54 | 11.2%(+11.0)#1,760 |
| 55. | Dorothy | 22.2% | 12.7%(+9.49)#55 | 11.2%(+11.0)#1,790 |
| 56. | Brookside | 22.0% | 12.7%(+9.32)#56 | 11.2%(+10.8)#1,818 |
| 57. | Lawrenceville | 22.0% | 12.7%(+9.29)#57 | 11.2%(+10.8)#1,825 |
| 58. | Mcguire Afb | 22.0% | 12.7%(+9.27)#58 | 11.2%(+10.8)#1,830 |
| 59. | Springdale | 22.0% | 12.7%(+9.26)#59 | 11.2%(+10.7)#1,831 |
| 60. | Carlstadt Borough | 21.9% | 12.7%(+9.25)#60 | 11.2%(+10.7)#1,836 |
| 61. | Packanack Lake | 21.7% | 12.7%(+8.99)#61 | 11.2%(+10.5)#1,890 |
| 62. | Haddonfield Borough | 21.7% | 12.7%(+8.98)#62 | 11.2%(+10.5)#1,894 |
| 63. | Wanamassa | 21.6% | 12.7%(+8.94)#63 | 11.2%(+10.4)#1,902 |
| 64. | West Belmar | 21.6% | 12.7%(+8.91)#64 | 11.2%(+10.4)#1,910 |
| 65. | West Long Branch Borough | 21.6% | 12.7%(+8.87)#65 | 11.2%(+10.4)#1,922 |
| 66. | Woodstown Borough | 21.5% | 12.7%(+8.77)#66 | 11.2%(+10.3)#1,942 |
| 67. | Milmay | 21.4% | 12.7%(+8.65)#67 | 11.2%(+10.1)#1,970 |
| 68. | North Caldwell Borough | 21.3% | 12.7%(+8.55)#68 | 11.2%(+10.0)#1,994 |
| 69. | Manasquan Borough | 21.1% | 12.7%(+8.41)#69 | 11.2%(+9.89)#2,031 |
| 70. | Belvidere | 21.1% | 12.7%(+8.37)#70 | 11.2%(+9.86)#2,037 |
| 71. | Leisure Knoll | 21.0% | 12.7%(+8.34)#71 | 11.2%(+9.83)#2,054 |
| 72. | Lavallette Borough | 21.0% | 12.7%(+8.30)#72 | 11.2%(+9.79)#2,063 |
| 73. | Skillman | 21.0% | 12.7%(+8.29)#73 | 11.2%(+9.78)#2,065 |
| 74. | Waretown | 20.9% | 12.7%(+8.24)#74 | 11.2%(+9.73)#2,082 |
| 75. | Lamington | 20.9% | 12.7%(+8.23)#75 | 11.2%(+9.72)#2,085 |
| 76. | Montclair State University | 20.9% | 12.7%(+8.18)#76 | 11.2%(+9.67)#2,096 |
| 77. | Collingswood Borough | 20.8% | 12.7%(+8.08)#77 | 11.2%(+9.57)#2,123 |
| 78. | New Vernon | 20.7% | 12.7%(+7.98)#78 | 11.2%(+9.46)#2,152 |
| 79. | Delaware Park | 20.7% | 12.7%(+7.96)#79 | 11.2%(+9.45)#2,155 |
| 80. | Kingston Estates | 20.6% | 12.7%(+7.95)#80 | 11.2%(+9.43)#2,160 |
| 81. | Woodbine Borough | 20.5% | 12.7%(+7.84)#81 | 11.2%(+9.32)#2,191 |
| 82. | Cedar Knolls | 20.5% | 12.7%(+7.82)#82 | 11.2%(+9.30)#2,199 |
| 83. | Millington | 20.4% | 12.7%(+7.72)#83 | 11.2%(+9.21)#2,239 |
| 84. | Blawenburg | 20.2% | 12.7%(+7.50)#84 | 11.2%(+8.99)#2,321 |
| 85. | Florham Park Borough | 20.2% | 12.7%(+7.46)#85 | 11.2%(+8.95)#2,339 |
| 86. | Pitman Borough | 20.0% | 12.7%(+7.35)#86 | 11.2%(+8.83)#2,370 |
| 87. | Midland Park Borough | 20.0% | 12.7%(+7.33)#87 | 11.2%(+8.82)#2,372 |
| 88. | Morris Plains Borough | 20.0% | 12.7%(+7.33)#88 | 11.2%(+8.82)#2,374 |
| 89. | Sheppards Mill | 20.0% | 12.7%(+7.30)#89 | 11.2%(+8.79)#2,412 |
| 90. | Tavistock Borough | 20.0% | 12.7%(+7.30)#90 | 11.2%(+8.79)#2,424 |
| 91. | Barclay | 19.9% | 12.7%(+7.18)#91 | 11.2%(+8.66)#2,456 |
| 92. | Haworth Borough | 19.8% | 12.7%(+7.12)#92 | 11.2%(+8.61)#2,471 |
| 93. | Weston | 19.8% | 12.7%(+7.11)#93 | 11.2%(+8.59)#2,480 |
| 94. | Madison Borough | 19.8% | 12.7%(+7.08)#94 | 11.2%(+8.57)#2,485 |
| 95. | Pine Beach Borough | 19.7% | 12.7%(+7.00)#95 | 11.2%(+8.49)#2,516 |
| 96. | Ho Ho Kus Borough | 19.7% | 12.7%(+6.98)#96 | 11.2%(+8.47)#2,521 |
| 97. | Wenonah Borough | 19.6% | 12.7%(+6.94)#97 | 11.2%(+8.42)#2,538 |
| 98. | Longport Borough | 19.6% | 12.7%(+6.93)#98 | 11.2%(+8.42)#2,539 |
| 99. | Mercerville | 19.6% | 12.7%(+6.91)#99 | 11.2%(+8.40)#2,553 |
| 100. | Newfoundland | 19.6% | 12.7%(+6.87)#100 | 11.2%(+8.36)#2,566 |
Common Questions
What are the Top 10 Cities with the Highest Percentage of Population Employed in Community & Social Service in New Jersey?
Top 10 Cities with the Highest Percentage of Population Employed in Community & Social Service in New Jersey are:
#1
82.2%
#2
81.8%
#3
47.7%
#4
34.6%
#5
31.7%
#6
29.0%
#7
28.6%
#8
27.6%
#9
26.8%
#10
26.5%
What city has the Highest Percentage of Population Employed in Community & Social Service in New Jersey?
Strathmere has the Highest Percentage of Population Employed in Community & Social Service in New Jersey with 82.2%.
What is the Percentage of Population Employed in Community & Social Service in the State of New Jersey?
Percentage of Population Employed in Community & Social Service in New Jersey is 12.7%.
What is the Percentage of Population Employed in Community & Social Service in the United States?
Percentage of Population Employed in Community & Social Service in the United States is 11.2%.