Cities with the Lowest Poverty Level Among Single Females in New Jersey
RELATED REPORTS & OPTIONS
Lowest Poverty | Single Female
New Jersey
Compare Cities
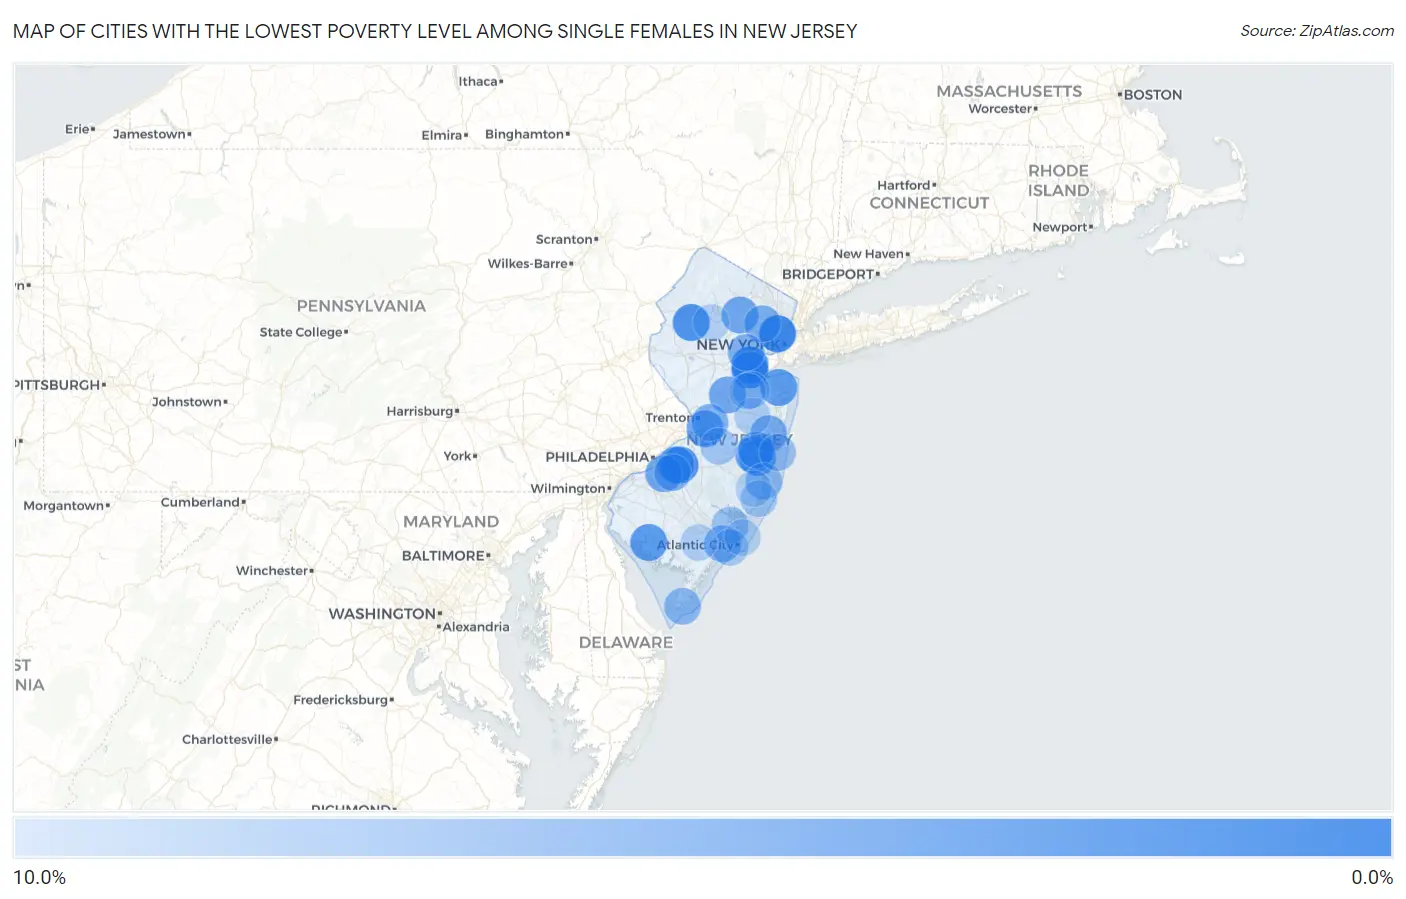
Map of Cities with the Lowest Poverty Level Among Single Females in New Jersey
10.0%
0.0%
Cities with the Lowest Poverty Level Among Single Females in New Jersey
| City | Single Female Poverty | vs State | vs National | |
| 1. | Paramus Borough | 1.1% | 19.6%(-18.5)#1 | 24.1%(-23.0)#24 |
| 2. | Secaucus | 1.5% | 19.6%(-18.2)#2 | 24.1%(-22.6)#42 |
| 3. | Pitman Borough | 1.6% | 19.6%(-18.1)#3 | 24.1%(-22.5)#48 |
| 4. | Bloomsbury Borough | 1.6% | 19.6%(-18.0)#4 | 24.1%(-22.4)#53 |
| 5. | Lake Hiawatha | 1.8% | 19.6%(-17.9)#5 | 24.1%(-22.3)#67 |
| 6. | Ridgefield Borough | 1.8% | 19.6%(-17.8)#6 | 24.1%(-22.3)#73 |
| 7. | Highland Park Borough | 1.9% | 19.6%(-17.8)#7 | 24.1%(-22.2)#77 |
| 8. | Iselin | 2.0% | 19.6%(-17.6)#8 | 24.1%(-22.0)#96 |
| 9. | Marlton | 2.2% | 19.6%(-17.4)#9 | 24.1%(-21.8)#122 |
| 10. | Hillsborough | 2.3% | 19.6%(-17.4)#10 | 24.1%(-21.8)#126 |
| 11. | Hackettstown | 2.4% | 19.6%(-17.2)#11 | 24.1%(-21.6)#141 |
| 12. | Hillsdale Borough | 2.7% | 19.6%(-16.9)#12 | 24.1%(-21.4)#178 |
| 13. | Franklin Borough | 2.7% | 19.6%(-16.9)#13 | 24.1%(-21.3)#184 |
| 14. | Fords | 2.8% | 19.6%(-16.8)#14 | 24.1%(-21.3)#192 |
| 15. | Oaklyn Borough | 2.9% | 19.6%(-16.7)#15 | 24.1%(-21.2)#215 |
| 16. | Chesilhurst Borough | 3.0% | 19.6%(-16.6)#16 | 24.1%(-21.1)#232 |
| 17. | Somerville Borough | 3.0% | 19.6%(-16.6)#17 | 24.1%(-21.1)#234 |
| 18. | Lincoln Park Borough | 3.0% | 19.6%(-16.6)#18 | 24.1%(-21.0)#244 |
| 19. | Glen Gardner Borough | 3.1% | 19.6%(-16.5)#19 | 24.1%(-21.0)#255 |
| 20. | Fairton | 3.1% | 19.6%(-16.5)#20 | 24.1%(-21.0)#256 |
| 21. | Hawthorne Borough | 3.2% | 19.6%(-16.4)#21 | 24.1%(-20.9)#270 |
| 22. | Point Pleasant Borough | 3.2% | 19.6%(-16.4)#22 | 24.1%(-20.9)#274 |
| 23. | Audubon Borough | 3.3% | 19.6%(-16.4)#23 | 24.1%(-20.8)#284 |
| 24. | New Providence Borough | 3.4% | 19.6%(-16.2)#24 | 24.1%(-20.7)#311 |
| 25. | Allentown Borough | 3.4% | 19.6%(-16.2)#25 | 24.1%(-20.7)#312 |
| 26. | Leonardo | 3.5% | 19.6%(-16.2)#26 | 24.1%(-20.6)#326 |
| 27. | Holiday City South | 3.6% | 19.6%(-16.1)#27 | 24.1%(-20.5)#349 |
| 28. | Greentree | 3.6% | 19.6%(-16.0)#28 | 24.1%(-20.5)#361 |
| 29. | Holiday City Berkeley | 3.8% | 19.6%(-15.8)#29 | 24.1%(-20.2)#401 |
| 30. | Bordentown | 3.8% | 19.6%(-15.8)#30 | 24.1%(-20.2)#403 |
| 31. | Mount Arlington Borough | 3.8% | 19.6%(-15.8)#31 | 24.1%(-20.2)#410 |
| 32. | Kinnelon Borough | 3.9% | 19.6%(-15.7)#32 | 24.1%(-20.2)#429 |
| 33. | Pennington Borough | 4.2% | 19.6%(-15.5)#33 | 24.1%(-19.9)#474 |
| 34. | Glendora | 4.3% | 19.6%(-15.4)#34 | 24.1%(-19.8)#495 |
| 35. | Dayton | 4.3% | 19.6%(-15.4)#35 | 24.1%(-19.8)#497 |
| 36. | Boonton | 4.4% | 19.6%(-15.3)#36 | 24.1%(-19.7)#529 |
| 37. | Haddonfield Borough | 4.4% | 19.6%(-15.3)#37 | 24.1%(-19.7)#530 |
| 38. | Rockaway Borough | 4.4% | 19.6%(-15.2)#38 | 24.1%(-19.7)#537 |
| 39. | Franklin Lakes Borough | 4.5% | 19.6%(-15.2)#39 | 24.1%(-19.6)#549 |
| 40. | Bridgewater Center | 4.5% | 19.6%(-15.1)#40 | 24.1%(-19.6)#555 |
| 41. | Packanack Lake | 4.5% | 19.6%(-15.1)#41 | 24.1%(-19.6)#558 |
| 42. | Ramtown | 4.7% | 19.6%(-14.9)#42 | 24.1%(-19.3)#620 |
| 43. | Pine Lake Park | 4.8% | 19.6%(-14.8)#43 | 24.1%(-19.2)#659 |
| 44. | Keyport Borough | 4.9% | 19.6%(-14.8)#44 | 24.1%(-19.2)#666 |
| 45. | Caldwell Borough | 5.0% | 19.6%(-14.7)#45 | 24.1%(-19.1)#688 |
| 46. | Upper Montclair | 5.0% | 19.6%(-14.6)#46 | 24.1%(-19.1)#694 |
| 47. | Westfield | 5.2% | 19.6%(-14.5)#47 | 24.1%(-18.9)#752 |
| 48. | Stratford Borough | 5.2% | 19.6%(-14.4)#48 | 24.1%(-18.9)#762 |
| 49. | Parsippany | 5.3% | 19.6%(-14.4)#49 | 24.1%(-18.8)#789 |
| 50. | Helmetta Borough | 5.3% | 19.6%(-14.3)#50 | 24.1%(-18.8)#791 |
| 51. | Yardville | 5.3% | 19.6%(-14.3)#51 | 24.1%(-18.8)#797 |
| 52. | Echelon | 5.4% | 19.6%(-14.2)#52 | 24.1%(-18.7)#827 |
| 53. | Northfield | 5.4% | 19.6%(-14.2)#53 | 24.1%(-18.7)#828 |
| 54. | Great Notch | 5.5% | 19.6%(-14.1)#54 | 24.1%(-18.6)#841 |
| 55. | Haworth Borough | 5.6% | 19.6%(-14.1)#55 | 24.1%(-18.5)#854 |
| 56. | Cape May | 5.8% | 19.6%(-13.9)#56 | 24.1%(-18.3)#925 |
| 57. | Buena Borough | 5.8% | 19.6%(-13.9)#57 | 24.1%(-18.3)#930 |
| 58. | Roselle Park Borough | 5.8% | 19.6%(-13.8)#58 | 24.1%(-18.3)#937 |
| 59. | The Hills | 5.9% | 19.6%(-13.8)#59 | 24.1%(-18.2)#946 |
| 60. | Northvale Borough | 5.9% | 19.6%(-13.7)#60 | 24.1%(-18.2)#954 |
| 61. | Waretown | 6.1% | 19.6%(-13.5)#61 | 24.1%(-18.0)#1,038 |
| 62. | Woodbury Heights Borough | 6.1% | 19.6%(-13.5)#62 | 24.1%(-18.0)#1,040 |
| 63. | Atlantic Highlands Borough | 6.1% | 19.6%(-13.5)#63 | 24.1%(-17.9)#1,047 |
| 64. | Kenilworth Borough | 6.2% | 19.6%(-13.5)#64 | 24.1%(-17.9)#1,057 |
| 65. | Fanwood Borough | 6.2% | 19.6%(-13.4)#65 | 24.1%(-17.9)#1,065 |
| 66. | Bloomingdale Borough | 6.2% | 19.6%(-13.4)#66 | 24.1%(-17.8)#1,076 |
| 67. | Lebanon Borough | 6.2% | 19.6%(-13.4)#67 | 24.1%(-17.8)#1,080 |
| 68. | Westwood Borough | 6.3% | 19.6%(-13.3)#68 | 24.1%(-17.8)#1,108 |
| 69. | Hi Nella Borough | 6.3% | 19.6%(-13.3)#69 | 24.1%(-17.8)#1,117 |
| 70. | Dover Beaches North | 6.5% | 19.6%(-13.2)#70 | 24.1%(-17.6)#1,147 |
| 71. | Folsom Borough | 6.6% | 19.6%(-13.1)#71 | 24.1%(-17.5)#1,180 |
| 72. | Bogota Borough | 6.6% | 19.6%(-13.0)#72 | 24.1%(-17.5)#1,187 |
| 73. | Smithville | 6.7% | 19.6%(-12.9)#73 | 24.1%(-17.4)#1,251 |
| 74. | Runnemede Borough | 6.8% | 19.6%(-12.9)#74 | 24.1%(-17.3)#1,258 |
| 75. | Brownville | 6.8% | 19.6%(-12.8)#75 | 24.1%(-17.3)#1,269 |
| 76. | Tenafly Borough | 6.9% | 19.6%(-12.7)#76 | 24.1%(-17.2)#1,290 |
| 77. | Park Ridge Borough | 6.9% | 19.6%(-12.7)#77 | 24.1%(-17.2)#1,307 |
| 78. | Mcguire Afb | 7.0% | 19.6%(-12.7)#78 | 24.1%(-17.1)#1,314 |
| 79. | Sayreville Borough | 7.1% | 19.6%(-12.5)#79 | 24.1%(-16.9)#1,353 |
| 80. | Manasquan Borough | 7.1% | 19.6%(-12.5)#80 | 24.1%(-16.9)#1,356 |
| 81. | Beach Haven West | 7.1% | 19.6%(-12.5)#81 | 24.1%(-16.9)#1,359 |
| 82. | Clayton Borough | 7.2% | 19.6%(-12.5)#82 | 24.1%(-16.9)#1,403 |
| 83. | Roseland Borough | 7.2% | 19.6%(-12.4)#83 | 24.1%(-16.8)#1,425 |
| 84. | Pompton Plains | 7.3% | 19.6%(-12.3)#84 | 24.1%(-16.7)#1,443 |
| 85. | Ventnor City | 7.3% | 19.6%(-12.3)#85 | 24.1%(-16.7)#1,445 |
| 86. | Ramsey Borough | 7.4% | 19.6%(-12.2)#86 | 24.1%(-16.7)#1,460 |
| 87. | Haledon Borough | 7.4% | 19.6%(-12.2)#87 | 24.1%(-16.6)#1,484 |
| 88. | Paulsboro Borough | 7.4% | 19.6%(-12.2)#88 | 24.1%(-16.6)#1,488 |
| 89. | Cresskill Borough | 7.5% | 19.6%(-12.1)#89 | 24.1%(-16.6)#1,497 |
| 90. | Emerson Borough | 7.5% | 19.6%(-12.1)#90 | 24.1%(-16.6)#1,513 |
| 91. | West Freehold | 7.7% | 19.6%(-11.9)#91 | 24.1%(-16.4)#1,605 |
| 92. | Peapack And Gladstone Borough | 7.8% | 19.6%(-11.9)#92 | 24.1%(-16.3)#1,620 |
| 93. | Old Bridge | 7.8% | 19.6%(-11.8)#93 | 24.1%(-16.3)#1,625 |
| 94. | Estell Manor | 7.9% | 19.6%(-11.7)#94 | 24.1%(-16.2)#1,661 |
| 95. | Brigantine | 8.0% | 19.6%(-11.7)#95 | 24.1%(-16.1)#1,690 |
| 96. | Succasunna | 8.0% | 19.6%(-11.6)#96 | 24.1%(-16.1)#1,698 |
| 97. | Ocean Acres | 8.0% | 19.6%(-11.6)#97 | 24.1%(-16.1)#1,700 |
| 98. | Hasbrouck Heights Borough | 8.1% | 19.6%(-11.6)#98 | 24.1%(-16.0)#1,723 |
| 99. | Norwood Borough | 8.1% | 19.6%(-11.5)#99 | 24.1%(-16.0)#1,738 |
| 100. | Cedar Knolls | 8.1% | 19.6%(-11.5)#100 | 24.1%(-16.0)#1,739 |
Common Questions
What are the Top 10 Cities with the Lowest Poverty Level Among Single Females in New Jersey?
Top 10 Cities with the Lowest Poverty Level Among Single Females in New Jersey are:
#1
1.5%
#2
2.0%
#3
2.2%
#4
2.4%
#5
2.8%
#6
3.1%
#7
3.5%
#8
3.6%
#9
3.6%
#10
3.8%
What city has the Lowest Poverty Level Among Single Females in New Jersey?
Secaucus has the Lowest Poverty Level Among Single Females in New Jersey with 1.5%.
What is the Poverty Level Among Single Females in the State of New Jersey?
Poverty Level Among Single Females in New Jersey is 19.6%.
What is the Poverty Level Among Single Females in the United States?
Poverty Level Among Single Females in the United States is 24.1%.