Cities with the Highest Percentage of South African Population in New Jersey
RELATED REPORTS & OPTIONS
South African
New Jersey
Compare Cities
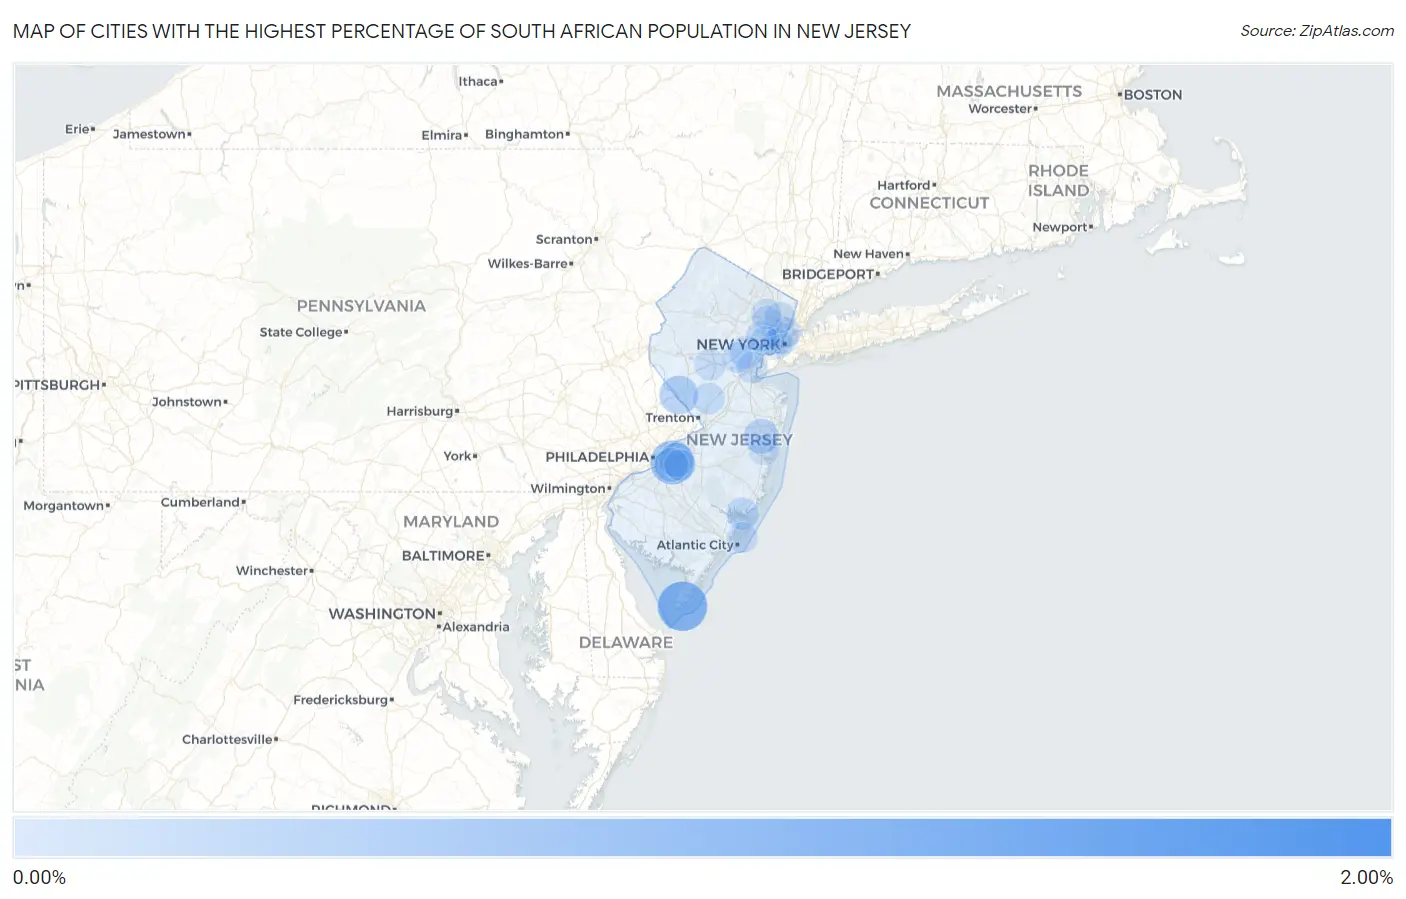
Map of Cities with the Highest Percentage of South African Population in New Jersey
0.00%
2.00%
Cities with the Highest Percentage of South African Population in New Jersey
| City | South African | vs State | vs National | |
| 1. | Demarest Borough | 1.76% | 0.028%(+1.74)#1 | 0.024%(+1.74)#58 |
| 2. | Cranford | 1.27% | 0.028%(+1.25)#2 | 0.024%(+1.25)#81 |
| 3. | Glen Gardner Borough | 1.24% | 0.028%(+1.21)#3 | 0.024%(+1.22)#84 |
| 4. | Bloomsbury Borough | 1.16% | 0.028%(+1.14)#4 | 0.024%(+1.14)#91 |
| 5. | Ringwood Borough | 0.98% | 0.028%(+0.947)#5 | 0.024%(+0.951)#109 |
| 6. | Cape May | 0.96% | 0.028%(+0.931)#6 | 0.024%(+0.935)#111 |
| 7. | Kingston Estates | 0.69% | 0.028%(+0.658)#7 | 0.024%(+0.662)#164 |
| 8. | Mountain Lakes Borough | 0.53% | 0.028%(+0.506)#8 | 0.024%(+0.509)#203 |
| 9. | Edgewater Borough | 0.49% | 0.028%(+0.465)#9 | 0.024%(+0.469)#216 |
| 10. | Madison Borough | 0.49% | 0.028%(+0.463)#10 | 0.024%(+0.466)#220 |
| 11. | Peapack And Gladstone Borough | 0.47% | 0.028%(+0.441)#11 | 0.024%(+0.445)#229 |
| 12. | Lambertville | 0.41% | 0.028%(+0.384)#12 | 0.024%(+0.388)#261 |
| 13. | Chatham Borough | 0.34% | 0.028%(+0.309)#13 | 0.024%(+0.313)#302 |
| 14. | The Hills | 0.32% | 0.028%(+0.292)#14 | 0.024%(+0.296)#314 |
| 15. | Monmouth Beach Borough | 0.31% | 0.028%(+0.285)#15 | 0.024%(+0.289)#320 |
| 16. | Leonia Borough | 0.25% | 0.028%(+0.220)#16 | 0.024%(+0.224)#386 |
| 17. | Lakewood | 0.23% | 0.028%(+0.200)#17 | 0.024%(+0.204)#414 |
| 18. | Ramblewood | 0.21% | 0.028%(+0.178)#18 | 0.024%(+0.182)#444 |
| 19. | Pompton Lakes Borough | 0.19% | 0.028%(+0.162)#19 | 0.024%(+0.166)#469 |
| 20. | Barclay | 0.18% | 0.028%(+0.150)#20 | 0.024%(+0.154)#496 |
| 21. | Ramsey Borough | 0.18% | 0.028%(+0.149)#21 | 0.024%(+0.152)#497 |
| 22. | Bernardsville Borough | 0.16% | 0.028%(+0.137)#22 | 0.024%(+0.141)#513 |
| 23. | Tenafly Borough | 0.14% | 0.028%(+0.116)#23 | 0.024%(+0.120)#560 |
| 24. | Glen Rock Borough | 0.14% | 0.028%(+0.113)#24 | 0.024%(+0.117)#568 |
| 25. | Westfield | 0.14% | 0.028%(+0.108)#25 | 0.024%(+0.112)#576 |
| 26. | Hopatcong Borough | 0.13% | 0.028%(+0.104)#26 | 0.024%(+0.108)#589 |
| 27. | Neshanic Station | 0.13% | 0.028%(+0.104)#27 | 0.024%(+0.108)#590 |
| 28. | Hillsborough | 0.12% | 0.028%(+0.091)#28 | 0.024%(+0.095)#618 |
| 29. | Mystic Island | 0.12% | 0.028%(+0.090)#29 | 0.024%(+0.094)#623 |
| 30. | Califon Borough | 0.11% | 0.028%(+0.079)#30 | 0.024%(+0.083)#646 |
| 31. | Princeton | 0.085% | 0.028%(+0.058)#31 | 0.024%(+0.061)#724 |
| 32. | Woodbridge | 0.076% | 0.028%(+0.049)#32 | 0.024%(+0.052)#768 |
| 33. | South Plainfield Borough | 0.074% | 0.028%(+0.046)#33 | 0.024%(+0.050)#776 |
| 34. | Bradley Gardens | 0.070% | 0.028%(+0.042)#34 | 0.024%(+0.046)#796 |
| 35. | Haddonfield Borough | 0.064% | 0.028%(+0.036)#35 | 0.024%(+0.040)#821 |
| 36. | Hoboken | 0.058% | 0.028%(+0.030)#36 | 0.024%(+0.034)#861 |
| 37. | Marlton | 0.058% | 0.028%(+0.030)#37 | 0.024%(+0.034)#863 |
| 38. | West New York | 0.057% | 0.028%(+0.029)#38 | 0.024%(+0.033)#865 |
| 39. | Brigantine | 0.039% | 0.028%(+0.011)#39 | 0.024%(+0.015)#1,003 |
| 40. | Hackensack | 0.035% | 0.028%(+0.007)#40 | 0.024%(+0.011)#1,036 |
| 41. | East Orange | 0.025% | 0.028%(-0.003)#41 | 0.024%(+0.001)#1,128 |
| 42. | Jersey City | 0.023% | 0.028%(-0.005)#42 | 0.024%(-0.001)#1,152 |
| 43. | Plainfield | 0.020% | 0.028%(-0.008)#43 | 0.024%(-0.004)#1,183 |
| 44. | Clifton | 0.015% | 0.028%(-0.013)#44 | 0.024%(-0.009)#1,254 |
| 45. | Toms River | 0.0097% | 0.028%(-0.018)#45 | 0.024%(-0.014)#1,320 |
| 46. | Paterson | 0.0082% | 0.028%(-0.020)#46 | 0.024%(-0.016)#1,338 |
| 47. | Newark | 0.0039% | 0.028%(-0.024)#47 | 0.024%(-0.020)#1,372 |
Common Questions
What are the Top 10 Cities with the Highest Percentage of South African Population in New Jersey?
Top 10 Cities with the Highest Percentage of South African Population in New Jersey are:
#1
0.96%
#2
0.69%
#3
0.41%
#4
0.23%
#5
0.21%
#6
0.18%
#7
0.14%
#8
0.12%
#9
0.085%
#10
0.076%
What city has the Highest Percentage of South African Population in New Jersey?
Cape May has the Highest Percentage of South African Population in New Jersey with 0.96%.
What is the Percentage of South African Population in the State of New Jersey?
Percentage of South African Population in New Jersey is 0.028%.
What is the Percentage of South African Population in the United States?
Percentage of South African Population in the United States is 0.024%.