Madison borough, NJ Map & Demographics
Madison borough Overview
$82,074
PER CAPITA INCOME
$201,689
AVG FAMILY INCOME
$163,567
AVG HOUSEHOLD INCOME
56.6%
WAGE / INCOME GAP [ % ]
43.4¢/ $1
WAGE / INCOME GAP [ $ ]
0.49
INEQUALITY / GINI INDEX
16,521
TOTAL POPULATION
8,114
MALE POPULATION
8,407
FEMALE POPULATION
96.51
MALES / 100 FEMALES
103.61
FEMALES / 100 MALES
38.6
MEDIAN AGE
3.3
AVG FAMILY SIZE
2.7
AVG HOUSEHOLD SIZE
9,202
LABOR FORCE [ PEOPLE ]
69.7%
PERCENT IN LABOR FORCE
6.9%
UNEMPLOYMENT RATE
Income in Madison borough
Income Overview in Madison borough
Per Capita Income in Madison borough is $82,074, while median incomes of families and households are $201,689 and $163,567 respectively.
| Characteristic | Number | Measure |
| Per Capita Income | 16,521 | $82,074 |
| Median Family Income | 3,839 | $201,689 |
| Mean Family Income | 3,839 | $290,078 |
| Median Household Income | 5,526 | $163,567 |
| Mean Household Income | 5,526 | $238,765 |
| Income Deficit | 3,839 | $0 |
| Wage / Income Gap (%) | 16,521 | 56.64% |
| Wage / Income Gap ($) | 16,521 | 43.36¢ per $1 |
| Gini / Inequality Index | 16,521 | 0.49 |
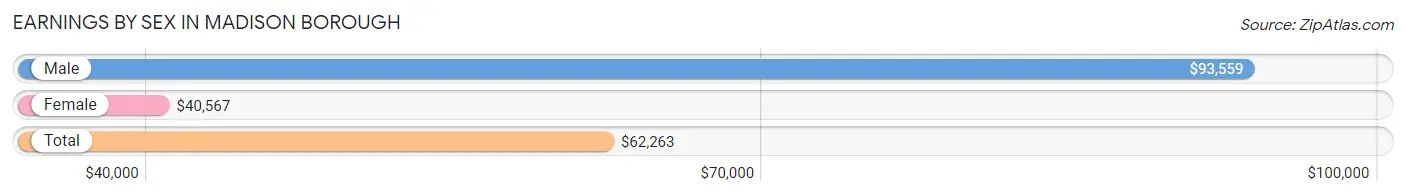
Earnings by Sex in Madison borough
Average Earnings in Madison borough are $62,263, $93,559 for men and $40,567 for women, a difference of 56.6%.
| Sex | Number | Average Earnings |
| Male | 5,186 (53.2%) | $93,559 |
| Female | 4,561 (46.8%) | $40,567 |
| Total | 9,747 (100.0%) | $62,263 |
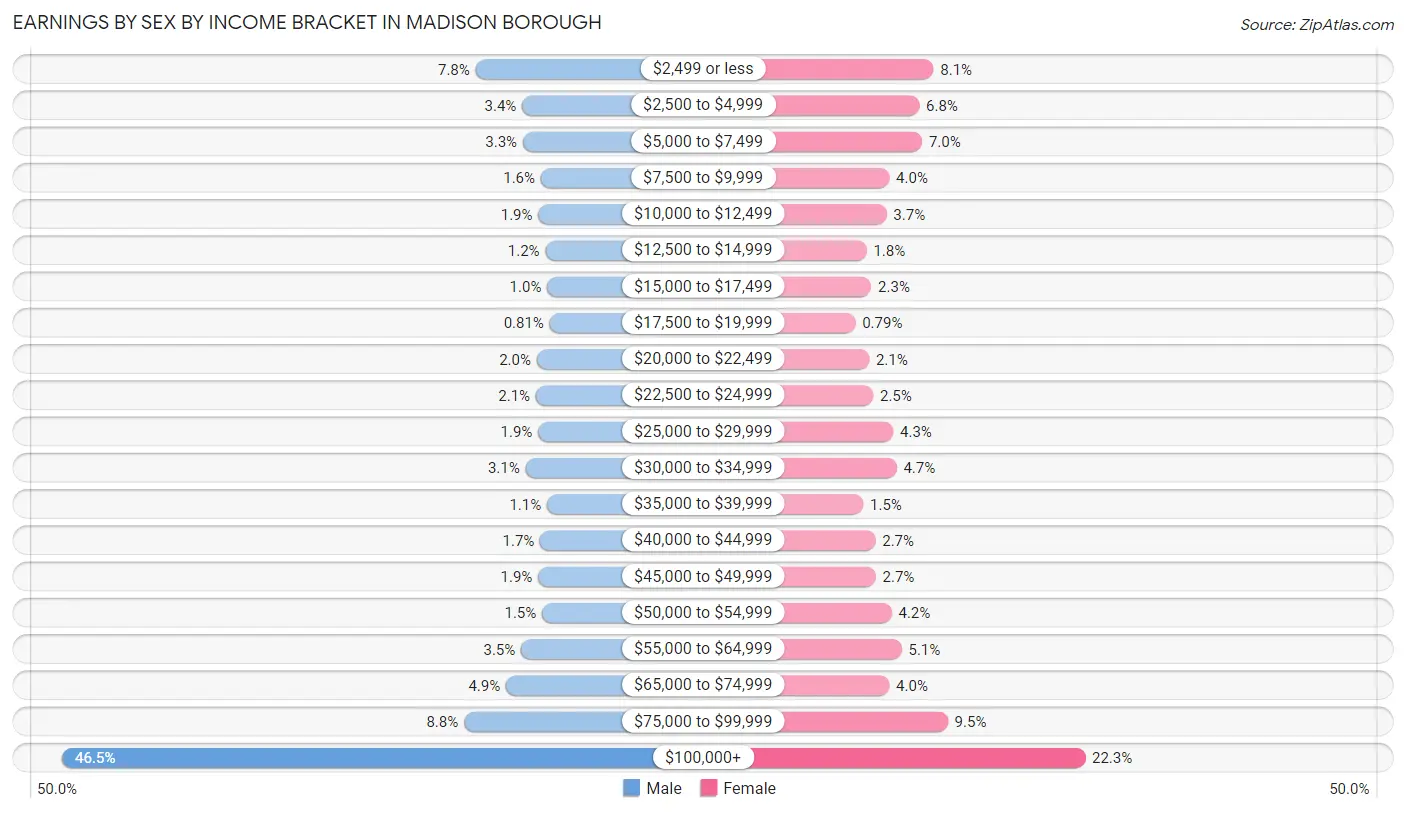
Earnings by Sex by Income Bracket in Madison borough
The most common earnings brackets in Madison borough are $100,000+ for men (2,411 | 46.5%) and $100,000+ for women (1,018 | 22.3%).
| Income | Male | Female |
| $2,499 or less | 402 (7.7%) | 370 (8.1%) |
| $2,500 to $4,999 | 176 (3.4%) | 309 (6.8%) |
| $5,000 to $7,499 | 172 (3.3%) | 321 (7.0%) |
| $7,500 to $9,999 | 85 (1.6%) | 181 (4.0%) |
| $10,000 to $12,499 | 97 (1.9%) | 169 (3.7%) |
| $12,500 to $14,999 | 63 (1.2%) | 84 (1.8%) |
| $15,000 to $17,499 | 54 (1.0%) | 104 (2.3%) |
| $17,500 to $19,999 | 42 (0.8%) | 36 (0.8%) |
| $20,000 to $22,499 | 105 (2.0%) | 95 (2.1%) |
| $22,500 to $24,999 | 109 (2.1%) | 112 (2.5%) |
| $25,000 to $29,999 | 98 (1.9%) | 198 (4.3%) |
| $30,000 to $34,999 | 159 (3.1%) | 212 (4.6%) |
| $35,000 to $39,999 | 55 (1.1%) | 70 (1.5%) |
| $40,000 to $44,999 | 88 (1.7%) | 122 (2.7%) |
| $45,000 to $49,999 | 98 (1.9%) | 123 (2.7%) |
| $50,000 to $54,999 | 79 (1.5%) | 191 (4.2%) |
| $55,000 to $64,999 | 181 (3.5%) | 234 (5.1%) |
| $65,000 to $74,999 | 254 (4.9%) | 181 (4.0%) |
| $75,000 to $99,999 | 458 (8.8%) | 431 (9.5%) |
| $100,000+ | 2,411 (46.5%) | 1,018 (22.3%) |
| Total | 5,186 (100.0%) | 4,561 (100.0%) |
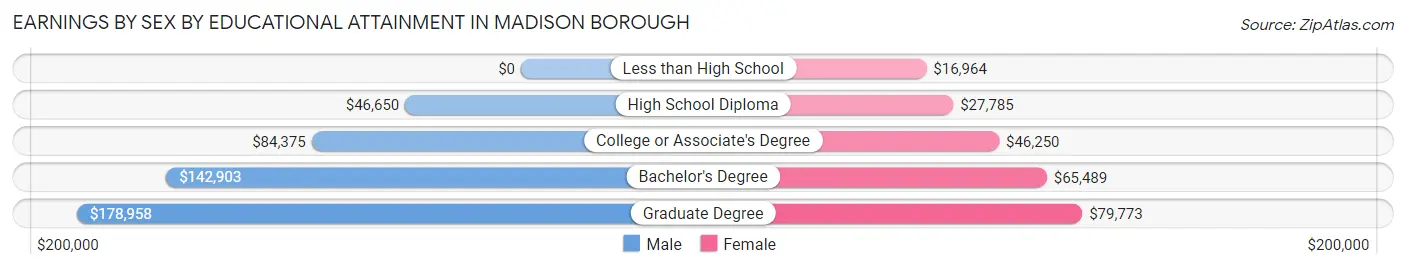
Earnings by Sex by Educational Attainment in Madison borough
Average earnings in Madison borough are $113,760 for men and $58,060 for women, a difference of 49.0%. Men with an educational attainment of graduate degree enjoy the highest average annual earnings of $178,958, while those with high school diploma education earn the least with $46,650. Women with an educational attainment of graduate degree earn the most with the average annual earnings of $79,773, while those with less than high school education have the smallest earnings of $16,964.
| Educational Attainment | Male Income | Female Income |
| Less than High School | - | - |
| High School Diploma | $46,650 | $27,785 |
| College or Associate's Degree | $84,375 | $46,250 |
| Bachelor's Degree | $142,903 | $65,489 |
| Graduate Degree | $178,958 | $79,773 |
| Total | $113,760 | $58,060 |
Family Income in Madison borough
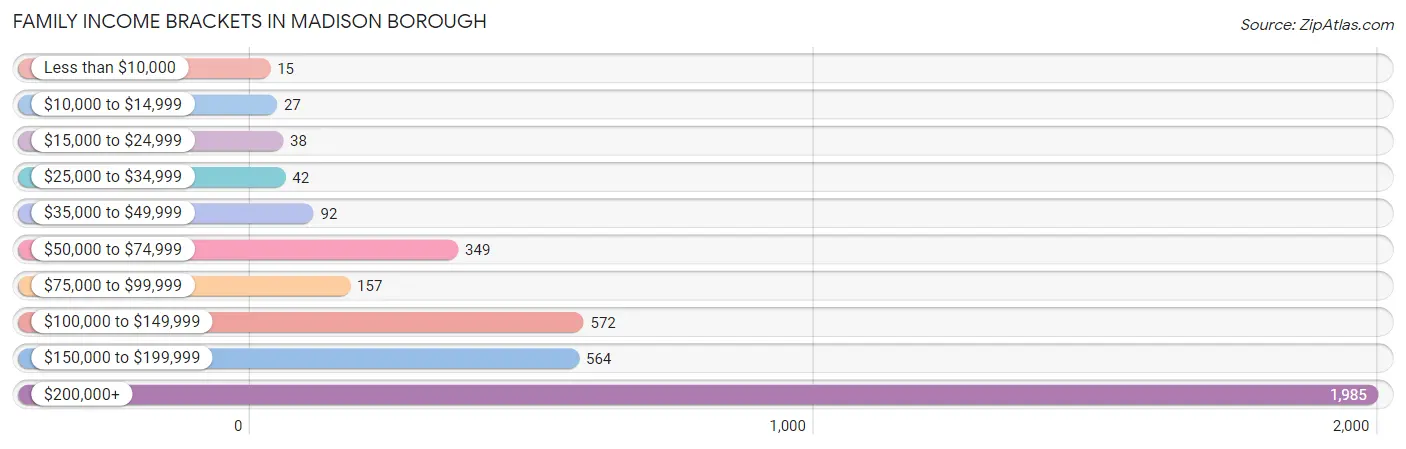
Family Income Brackets in Madison borough
According to the Madison borough family income data, there are 1,985 families falling into the $200,000+ income range, which is the most common income bracket and makes up 51.7% of all families. Conversely, the less than $10,000 income bracket is the least frequent group with only 15 families (0.4%) belonging to this category.
| Income Bracket | # Families | % Families |
| Less than $10,000 | 15 | 0.4% |
| $10,000 to $14,999 | 27 | 0.7% |
| $15,000 to $24,999 | 38 | 1.0% |
| $25,000 to $34,999 | 42 | 1.1% |
| $35,000 to $49,999 | 92 | 2.4% |
| $50,000 to $74,999 | 349 | 9.1% |
| $75,000 to $99,999 | 157 | 4.1% |
| $100,000 to $149,999 | 572 | 14.9% |
| $150,000 to $199,999 | 564 | 14.7% |
| $200,000+ | 1,985 | 51.7% |
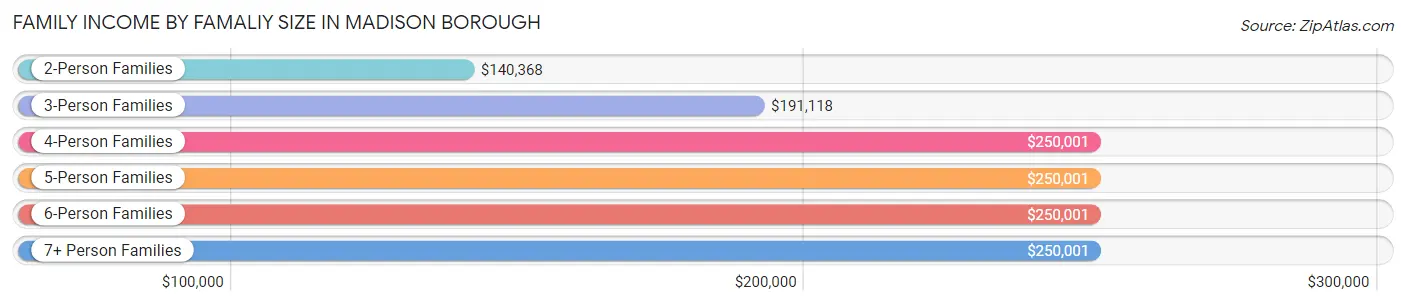
Family Income by Famaliy Size in Madison borough
4-person families (907 | 23.6%) account for the highest median family income in Madison borough with $250,001 per family, while 2-person families (1,433 | 37.3%) have the highest median income of $70,184 per family member.
| Income Bracket | # Families | Median Income |
| 2-Person Families | 1,433 (37.3%) | $140,368 |
| 3-Person Families | 987 (25.7%) | $191,118 |
| 4-Person Families | 907 (23.6%) | $250,001 |
| 5-Person Families | 447 (11.6%) | $250,001 |
| 6-Person Families | 35 (0.9%) | $250,001 |
| 7+ Person Families | 30 (0.8%) | $250,001 |
| Total | 3,839 (100.0%) | $201,689 |
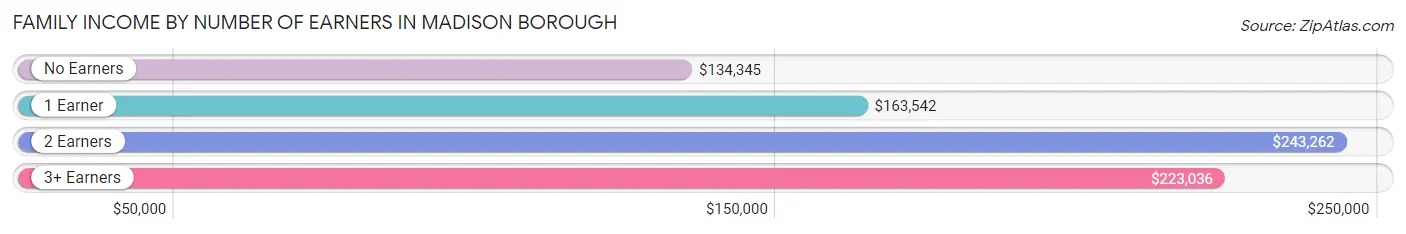
Family Income by Number of Earners in Madison borough
The median family income in Madison borough is $201,689, with families comprising 2 earners (1,881) having the highest median family income of $243,262, while families with no earners (387) have the lowest median family income of $134,345, accounting for 49.0% and 10.1% of families, respectively.
| Number of Earners | # Families | Median Income |
| No Earners | 387 (10.1%) | $134,345 |
| 1 Earner | 1,014 (26.4%) | $163,542 |
| 2 Earners | 1,881 (49.0%) | $243,262 |
| 3+ Earners | 557 (14.5%) | $223,036 |
| Total | 3,839 (100.0%) | $201,689 |
Household Income in Madison borough
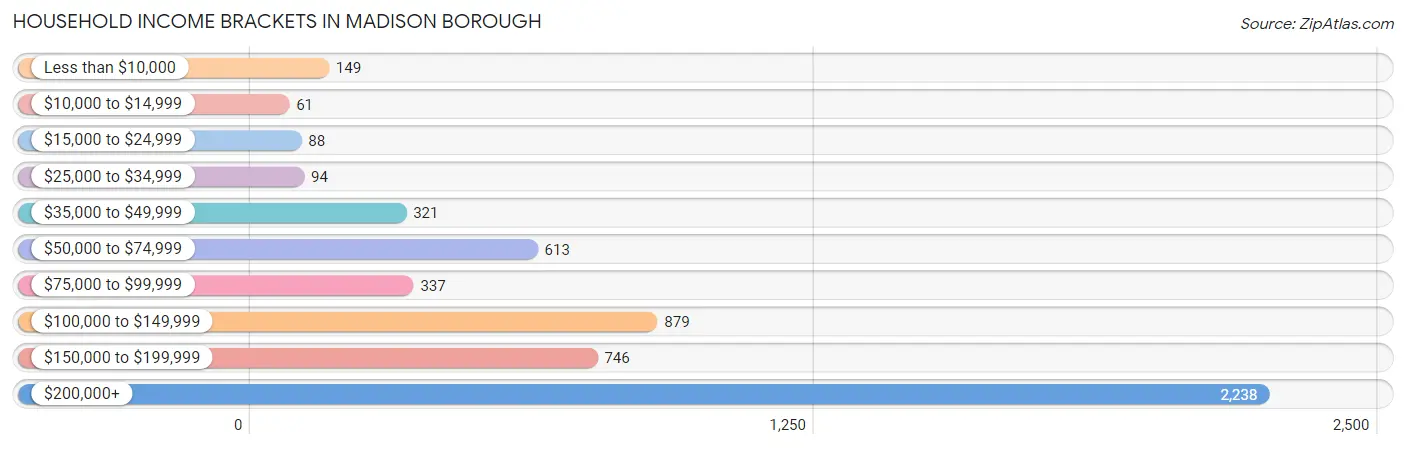
Household Income Brackets in Madison borough
With 2,238 households falling in the category, the $200,000+ income range is the most frequent in Madison borough, accounting for 40.5% of all households. In contrast, only 61 households (1.1%) fall into the $10,000 to $14,999 income bracket, making it the least populous group.
| Income Bracket | # Households | % Households |
| Less than $10,000 | 149 | 2.7% |
| $10,000 to $14,999 | 61 | 1.1% |
| $15,000 to $24,999 | 88 | 1.6% |
| $25,000 to $34,999 | 94 | 1.7% |
| $35,000 to $49,999 | 321 | 5.8% |
| $50,000 to $74,999 | 613 | 11.1% |
| $75,000 to $99,999 | 337 | 6.1% |
| $100,000 to $149,999 | 879 | 15.9% |
| $150,000 to $199,999 | 746 | 13.5% |
| $200,000+ | 2,238 | 40.5% |
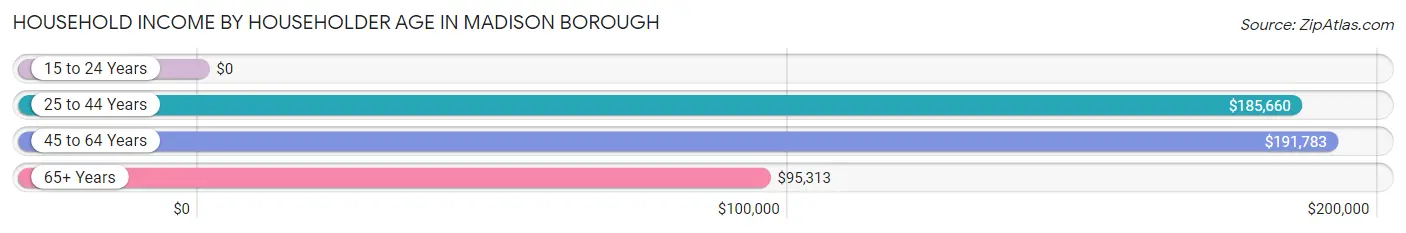
Household Income by Householder Age in Madison borough
The median household income in Madison borough is $163,567, with the highest median household income of $191,783 found in the 45 to 64 years age bracket for the primary householder. A total of 2,535 households (45.9%) fall into this category. Meanwhile, the 15 to 24 years age bracket for the primary householder has the lowest median household income of $0, with 72 households (1.3%) in this group.
| Income Bracket | # Households | Median Income |
| 15 to 24 Years | 72 (1.3%) | $0 |
| 25 to 44 Years | 1,579 (28.6%) | $185,660 |
| 45 to 64 Years | 2,535 (45.9%) | $191,783 |
| 65+ Years | 1,340 (24.2%) | $95,313 |
| Total | 5,526 (100.0%) | $163,567 |
Poverty in Madison borough
Income Below Poverty by Sex and Age in Madison borough
With 1.6% poverty level for males and 5.3% for females among the residents of Madison borough, 5 year old males and 75 year old and over females are the most vulnerable to poverty, with 8 males (8.3%) and 75 females (13.4%) in their respective age groups living below the poverty level.
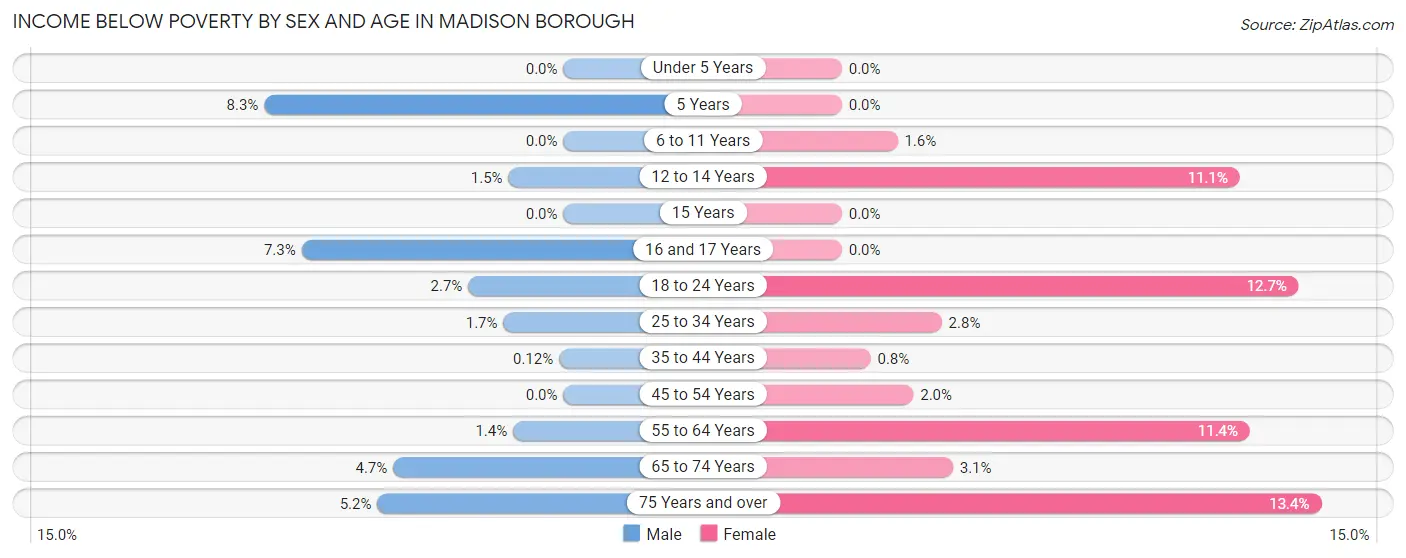
| Age Bracket | Male | Female |
| Under 5 Years | 0 (0.0%) | 0 (0.0%) |
| 5 Years | 8 (8.3%) | 0 (0.0%) |
| 6 to 11 Years | 0 (0.0%) | 8 (1.5%) |
| 12 to 14 Years | 5 (1.5%) | 44 (11.1%) |
| 15 Years | 0 (0.0%) | 0 (0.0%) |
| 16 and 17 Years | 18 (7.3%) | 0 (0.0%) |
| 18 to 24 Years | 13 (2.6%) | 64 (12.7%) |
| 25 to 34 Years | 15 (1.7%) | 23 (2.8%) |
| 35 to 44 Years | 1 (0.1%) | 8 (0.8%) |
| 45 to 54 Years | 0 (0.0%) | 22 (2.0%) |
| 55 to 64 Years | 15 (1.4%) | 141 (11.4%) |
| 65 to 74 Years | 29 (4.7%) | 19 (3.1%) |
| 75 Years and over | 17 (5.2%) | 75 (13.4%) |
| Total | 121 (1.6%) | 404 (5.3%) |
Income Above Poverty by Sex and Age in Madison borough
According to the poverty statistics in Madison borough, males aged under 5 years and females aged under 5 years are the age groups that are most secure financially, with 100.0% of males and 100.0% of females in these age groups living above the poverty line.
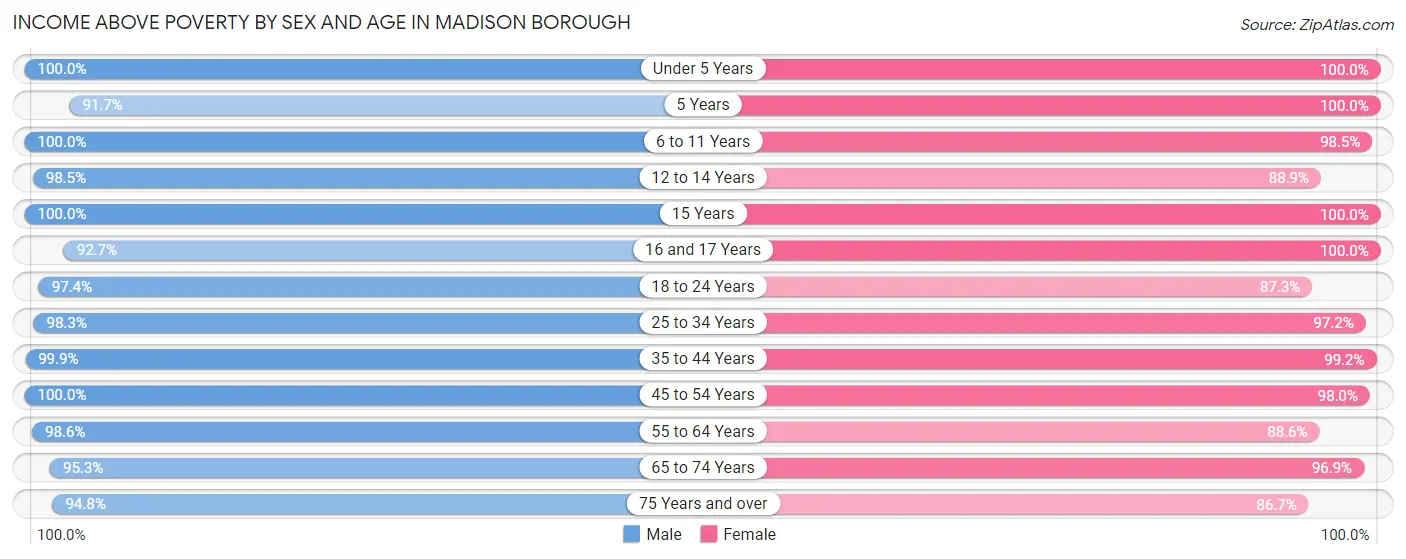
| Age Bracket | Male | Female |
| Under 5 Years | 456 (100.0%) | 439 (100.0%) |
| 5 Years | 88 (91.7%) | 105 (100.0%) |
| 6 to 11 Years | 712 (100.0%) | 508 (98.5%) |
| 12 to 14 Years | 321 (98.5%) | 353 (88.9%) |
| 15 Years | 142 (100.0%) | 85 (100.0%) |
| 16 and 17 Years | 229 (92.7%) | 155 (100.0%) |
| 18 to 24 Years | 477 (97.4%) | 439 (87.3%) |
| 25 to 34 Years | 884 (98.3%) | 804 (97.2%) |
| 35 to 44 Years | 847 (99.9%) | 988 (99.2%) |
| 45 to 54 Years | 1,218 (100.0%) | 1,084 (98.0%) |
| 55 to 64 Years | 1,060 (98.6%) | 1,100 (88.6%) |
| 65 to 74 Years | 583 (95.3%) | 596 (96.9%) |
| 75 Years and over | 311 (94.8%) | 487 (86.7%) |
| Total | 7,328 (98.4%) | 7,143 (94.7%) |
Income Below Poverty Among Married-Couple Families in Madison borough
The poverty statistics for married-couple families in Madison borough show that 0.7% or 23 of the total 3,294 families live below the poverty line. Families with 1 or 2 children have the highest poverty rate of 1.8%, comprising of 23 families. On the other hand, families with no children have the lowest poverty rate of 0.0%, which includes 0 families.
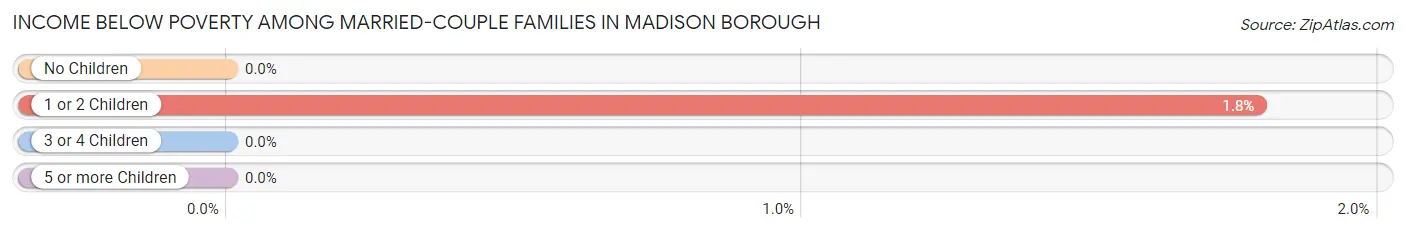
| Children | Above Poverty | Below Poverty |
| No Children | 1,644 (100.0%) | 0 (0.0%) |
| 1 or 2 Children | 1,261 (98.2%) | 23 (1.8%) |
| 3 or 4 Children | 358 (100.0%) | 0 (0.0%) |
| 5 or more Children | 8 (100.0%) | 0 (0.0%) |
| Total | 3,271 (99.3%) | 23 (0.7%) |
Income Below Poverty Among Single-Parent Households in Madison borough
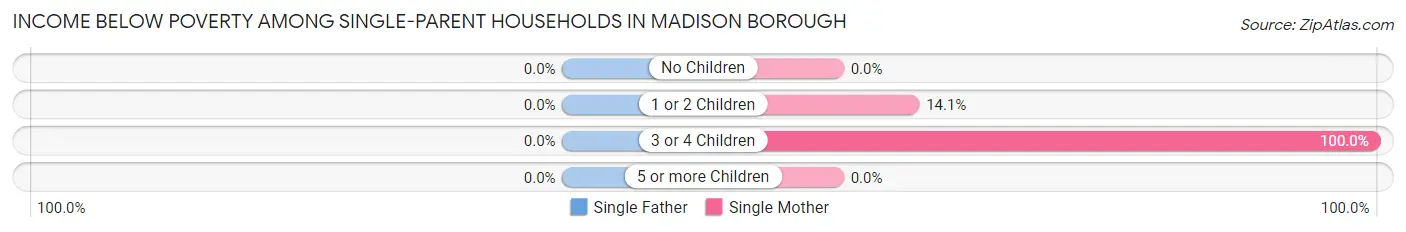
| Children | Single Father | Single Mother |
| No Children | 0 (0.0%) | 0 (0.0%) |
| 1 or 2 Children | 0 (0.0%) | 28 (14.1%) |
| 3 or 4 Children | 0 (0.0%) | 5 (100.0%) |
| 5 or more Children | 0 (0.0%) | 0 (0.0%) |
| Total | 0 (0.0%) | 33 (8.6%) |
Income Below Poverty Among Married-Couple vs Single-Parent Households in Madison borough
The poverty data for Madison borough shows that 23 of the married-couple family households (0.7%) and 33 of the single-parent households (6.1%) are living below the poverty level. Within the married-couple family households, those with 1 or 2 children have the highest poverty rate, with 23 households (1.8%) falling below the poverty line. Among the single-parent households, those with 3 or 4 children have the highest poverty rate, with 5 household (100.0%) living below poverty.
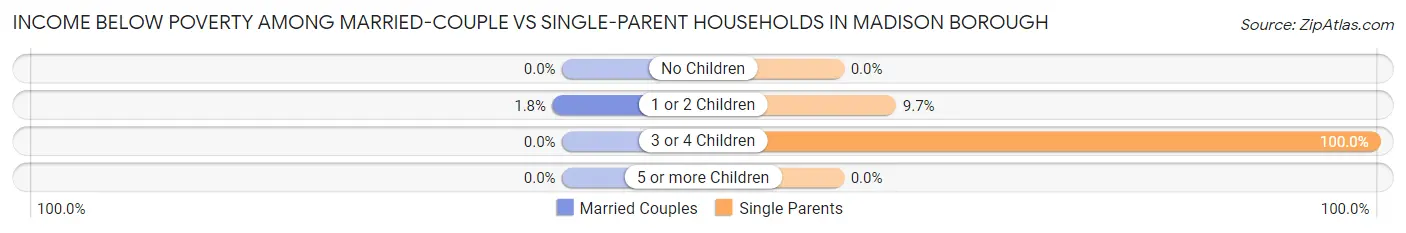
| Children | Married-Couple Families | Single-Parent Households |
| No Children | 0 (0.0%) | 0 (0.0%) |
| 1 or 2 Children | 23 (1.8%) | 28 (9.7%) |
| 3 or 4 Children | 0 (0.0%) | 5 (100.0%) |
| 5 or more Children | 0 (0.0%) | 0 (0.0%) |
| Total | 23 (0.7%) | 33 (6.1%) |
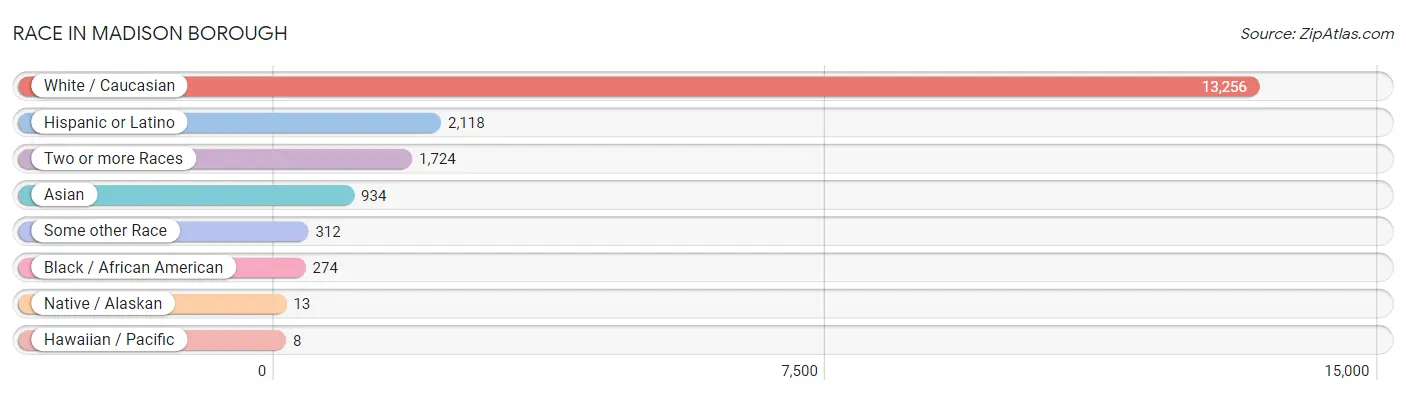
Race in Madison borough
The most populous races in Madison borough are White / Caucasian (13,256 | 80.2%), Hispanic or Latino (2,118 | 12.8%), and Two or more Races (1,724 | 10.4%).
| Race | # Population | % Population |
| Asian | 934 | 5.7% |
| Black / African American | 274 | 1.7% |
| Hawaiian / Pacific | 8 | 0.1% |
| Hispanic or Latino | 2,118 | 12.8% |
| Native / Alaskan | 13 | 0.1% |
| White / Caucasian | 13,256 | 80.2% |
| Two or more Races | 1,724 | 10.4% |
| Some other Race | 312 | 1.9% |
| Total | 16,521 | 100.0% |
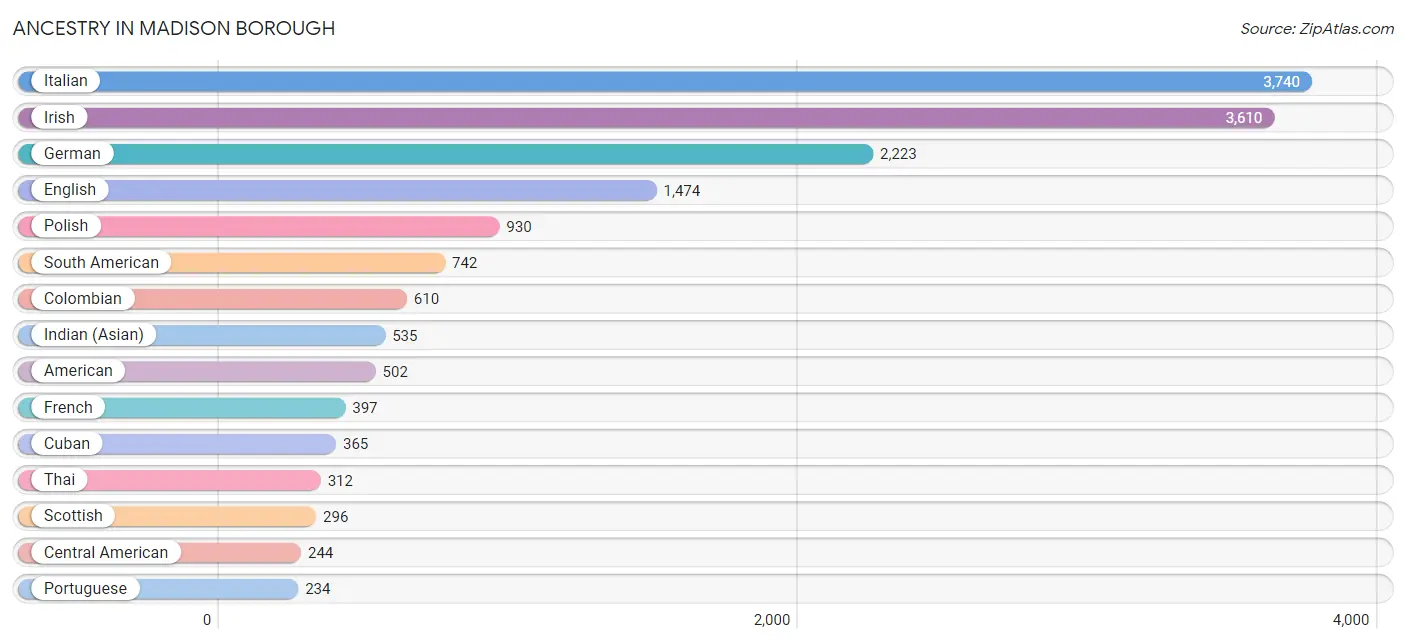
Ancestry in Madison borough
The most populous ancestries reported in Madison borough are Italian (3,740 | 22.6%), Irish (3,610 | 21.8%), German (2,223 | 13.5%), English (1,474 | 8.9%), and Polish (930 | 5.6%), together accounting for 72.5% of all Madison borough residents.
| Ancestry | # Population | % Population |
| African | 4 | 0.0% |
| American | 502 | 3.0% |
| Arab | 159 | 1.0% |
| Argentinean | 64 | 0.4% |
| Armenian | 42 | 0.3% |
| Austrian | 48 | 0.3% |
| Belgian | 5 | 0.0% |
| Bhutanese | 76 | 0.5% |
| Brazilian | 9 | 0.1% |
| British | 71 | 0.4% |
| Burmese | 198 | 1.2% |
| Canadian | 6 | 0.0% |
| Central American | 244 | 1.5% |
| Cherokee | 11 | 0.1% |
| Chilean | 4 | 0.0% |
| Colombian | 610 | 3.7% |
| Costa Rican | 112 | 0.7% |
| Croatian | 30 | 0.2% |
| Cuban | 365 | 2.2% |
| Czech | 26 | 0.2% |
| Czechoslovakian | 10 | 0.1% |
| Danish | 62 | 0.4% |
| Dominican | 87 | 0.5% |
| Dutch | 110 | 0.7% |
| Eastern European | 113 | 0.7% |
| Ecuadorian | 2 | 0.0% |
| Egyptian | 17 | 0.1% |
| English | 1,474 | 8.9% |
| European | 211 | 1.3% |
| Filipino | 13 | 0.1% |
| Finnish | 1 | 0.0% |
| French | 397 | 2.4% |
| French Canadian | 50 | 0.3% |
| German | 2,223 | 13.5% |
| Greek | 176 | 1.1% |
| Haitian | 15 | 0.1% |
| Honduran | 18 | 0.1% |
| Hungarian | 132 | 0.8% |
| Indian (Asian) | 535 | 3.2% |
| Iranian | 8 | 0.1% |
| Irish | 3,610 | 21.8% |
| Italian | 3,740 | 22.6% |
| Jamaican | 68 | 0.4% |
| Korean | 131 | 0.8% |
| Latvian | 13 | 0.1% |
| Lebanese | 26 | 0.2% |
| Lithuanian | 170 | 1.0% |
| Malaysian | 5 | 0.0% |
| Mexican | 224 | 1.4% |
| Mongolian | 4 | 0.0% |
| Native Hawaiian | 119 | 0.7% |
| Norwegian | 101 | 0.6% |
| Pakistani | 20 | 0.1% |
| Palestinian | 105 | 0.6% |
| Peruvian | 45 | 0.3% |
| Polish | 930 | 5.6% |
| Portuguese | 234 | 1.4% |
| Puerto Rican | 135 | 0.8% |
| Russian | 203 | 1.2% |
| Salvadoran | 114 | 0.7% |
| Scandinavian | 34 | 0.2% |
| Scotch-Irish | 192 | 1.2% |
| Scottish | 296 | 1.8% |
| Slovak | 21 | 0.1% |
| South African | 81 | 0.5% |
| South American | 742 | 4.5% |
| South American Indian | 13 | 0.1% |
| Spaniard | 123 | 0.7% |
| Spanish | 83 | 0.5% |
| Sri Lankan | 101 | 0.6% |
| Subsaharan African | 85 | 0.5% |
| Swedish | 88 | 0.5% |
| Swiss | 88 | 0.5% |
| Syrian | 56 | 0.3% |
| Thai | 312 | 1.9% |
| Turkish | 75 | 0.4% |
| Ukrainian | 155 | 0.9% |
| Venezuelan | 13 | 0.1% |
| Welsh | 58 | 0.4% | View All 79 Rows |
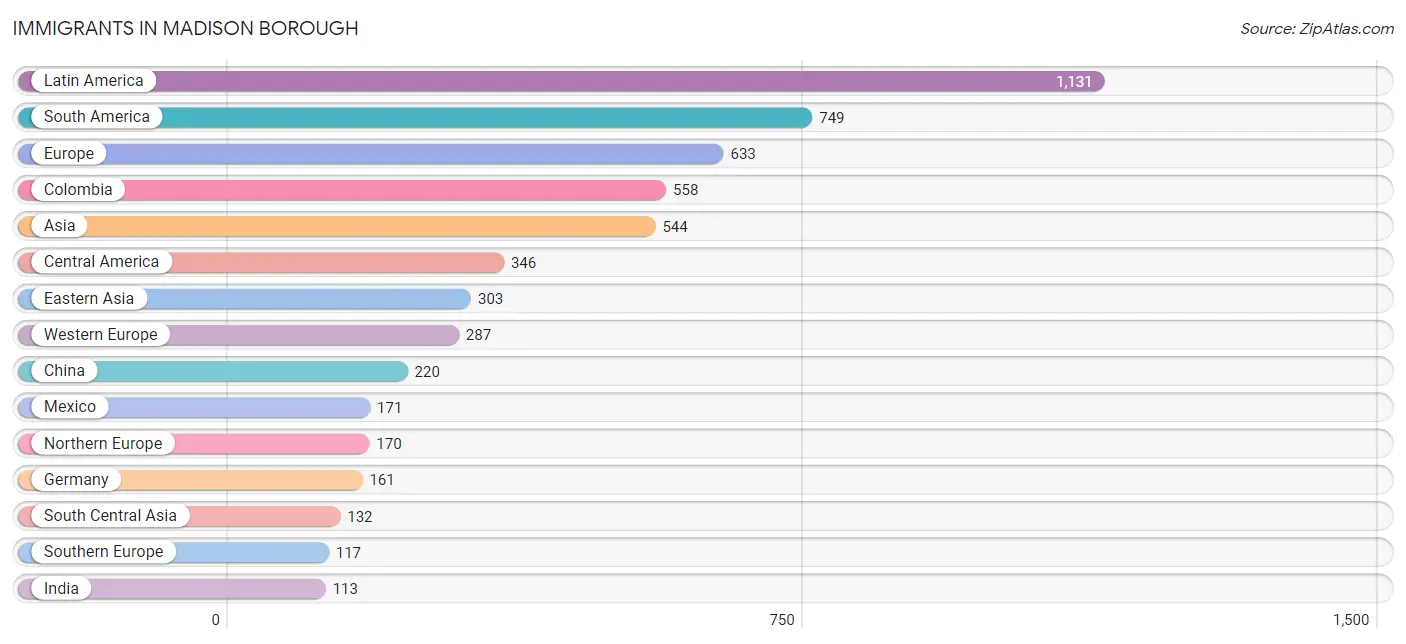
Immigrants in Madison borough
The most numerous immigrant groups reported in Madison borough came from Latin America (1,131 | 6.9%), South America (749 | 4.5%), Europe (633 | 3.8%), Colombia (558 | 3.4%), and Asia (544 | 3.3%), together accounting for 21.9% of all Madison borough residents.
| Immigration Origin | # Population | % Population |
| Africa | 82 | 0.5% |
| Argentina | 43 | 0.3% |
| Asia | 544 | 3.3% |
| Australia | 60 | 0.4% |
| Brazil | 88 | 0.5% |
| Canada | 42 | 0.3% |
| Caribbean | 36 | 0.2% |
| Central America | 346 | 2.1% |
| Chile | 17 | 0.1% |
| China | 220 | 1.3% |
| Colombia | 558 | 3.4% |
| Costa Rica | 94 | 0.6% |
| Cuba | 18 | 0.1% |
| Dominica | 13 | 0.1% |
| Eastern Africa | 19 | 0.1% |
| Eastern Asia | 303 | 1.8% |
| Eastern Europe | 59 | 0.4% |
| Egypt | 17 | 0.1% |
| El Salvador | 25 | 0.2% |
| England | 51 | 0.3% |
| Europe | 633 | 3.8% |
| France | 79 | 0.5% |
| Germany | 161 | 1.0% |
| Haiti | 5 | 0.0% |
| Honduras | 47 | 0.3% |
| Hong Kong | 32 | 0.2% |
| India | 113 | 0.7% |
| Ireland | 32 | 0.2% |
| Italy | 49 | 0.3% |
| Korea | 83 | 0.5% |
| Latin America | 1,131 | 6.9% |
| Malaysia | 4 | 0.0% |
| Mexico | 171 | 1.0% |
| Northern Africa | 17 | 0.1% |
| Northern Europe | 170 | 1.0% |
| Oceania | 60 | 0.4% |
| Pakistan | 3 | 0.0% |
| Panama | 9 | 0.1% |
| Peru | 12 | 0.1% |
| Philippines | 5 | 0.0% |
| Poland | 22 | 0.1% |
| Portugal | 47 | 0.3% |
| Russia | 29 | 0.2% |
| South Africa | 46 | 0.3% |
| South America | 749 | 4.5% |
| South Central Asia | 132 | 0.8% |
| South Eastern Asia | 17 | 0.1% |
| Southern Europe | 117 | 0.7% |
| Spain | 21 | 0.1% |
| Sweden | 9 | 0.1% |
| Switzerland | 47 | 0.3% |
| Syria | 45 | 0.3% |
| Taiwan | 21 | 0.1% |
| Turkey | 35 | 0.2% |
| Ukraine | 8 | 0.1% |
| Uzbekistan | 16 | 0.1% |
| Venezuela | 31 | 0.2% |
| Vietnam | 8 | 0.1% |
| Western Asia | 92 | 0.6% |
| Western Europe | 287 | 1.7% | View All 60 Rows |
Sex and Age in Madison borough
Sex and Age in Madison borough
The most populous age groups in Madison borough are 20 to 24 Years (741 | 9.1%) for men and 50 to 54 Years (827 | 9.8%) for women.
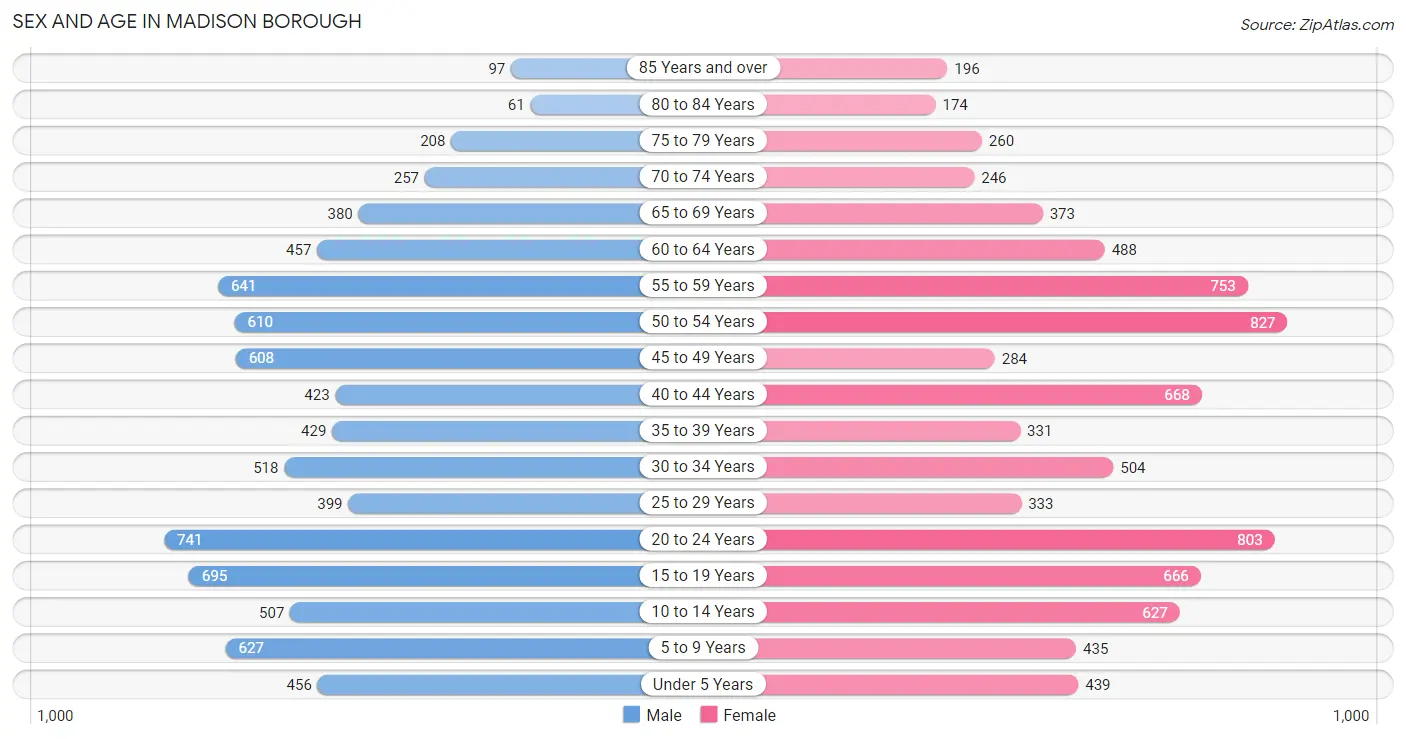
| Age Bracket | Male | Female |
| Under 5 Years | 456 (5.6%) | 439 (5.2%) |
| 5 to 9 Years | 627 (7.7%) | 435 (5.2%) |
| 10 to 14 Years | 507 (6.2%) | 627 (7.5%) |
| 15 to 19 Years | 695 (8.6%) | 666 (7.9%) |
| 20 to 24 Years | 741 (9.1%) | 803 (9.6%) |
| 25 to 29 Years | 399 (4.9%) | 333 (4.0%) |
| 30 to 34 Years | 518 (6.4%) | 504 (6.0%) |
| 35 to 39 Years | 429 (5.3%) | 331 (3.9%) |
| 40 to 44 Years | 423 (5.2%) | 668 (8.0%) |
| 45 to 49 Years | 608 (7.5%) | 284 (3.4%) |
| 50 to 54 Years | 610 (7.5%) | 827 (9.8%) |
| 55 to 59 Years | 641 (7.9%) | 753 (9.0%) |
| 60 to 64 Years | 457 (5.6%) | 488 (5.8%) |
| 65 to 69 Years | 380 (4.7%) | 373 (4.4%) |
| 70 to 74 Years | 257 (3.2%) | 246 (2.9%) |
| 75 to 79 Years | 208 (2.6%) | 260 (3.1%) |
| 80 to 84 Years | 61 (0.7%) | 174 (2.1%) |
| 85 Years and over | 97 (1.2%) | 196 (2.3%) |
| Total | 8,114 (100.0%) | 8,407 (100.0%) |
Families and Households in Madison borough
Median Family Size in Madison borough
The median family size in Madison borough is 3.27 persons per family, with married-couple families (3,294 | 85.8%) accounting for the largest median family size of 3.35 persons per family. On the other hand, single male/father families (162 | 4.2%) represent the smallest median family size with 2.56 persons per family.
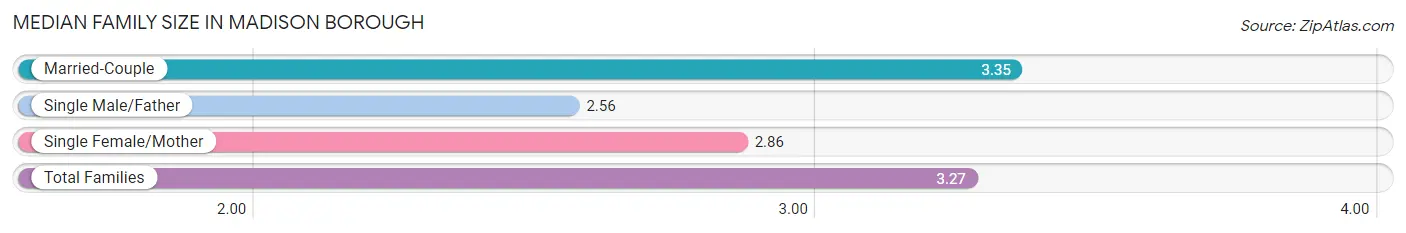
| Family Type | # Families | Family Size |
| Married-Couple | 3,294 (85.8%) | 3.35 |
| Single Male/Father | 162 (4.2%) | 2.56 |
| Single Female/Mother | 383 (10.0%) | 2.86 |
| Total Families | 3,839 (100.0%) | 3.27 |
Median Household Size in Madison borough
The median household size in Madison borough is 2.71 persons per household, with married-couple households (3,294 | 59.6%) accounting for the largest median household size of 3.39 persons per household. non-family households (1,687 | 30.5%) represent the smallest median household size with 1.32 persons per household.
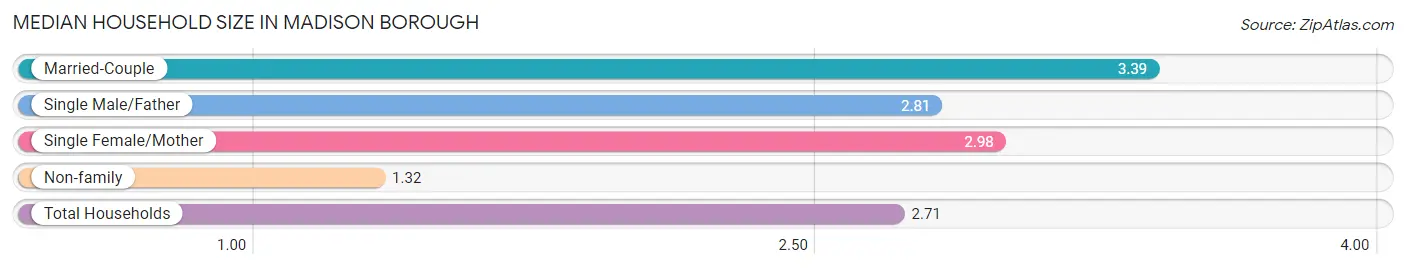
| Household Type | # Households | Household Size |
| Married-Couple | 3,294 (59.6%) | 3.39 |
| Single Male/Father | 162 (2.9%) | 2.81 |
| Single Female/Mother | 383 (6.9%) | 2.98 |
| Non-family | 1,687 (30.5%) | 1.32 |
| Total Households | 5,526 (100.0%) | 2.71 |
Household Size by Marriage Status in Madison borough
Out of a total of 5,526 households in Madison borough, 3,839 (69.5%) are family households, while 1,687 (30.5%) are nonfamily households. The most numerous type of family households are 2-person households, comprising 1,366, and the most common type of nonfamily households are 1-person households, comprising 1,298.
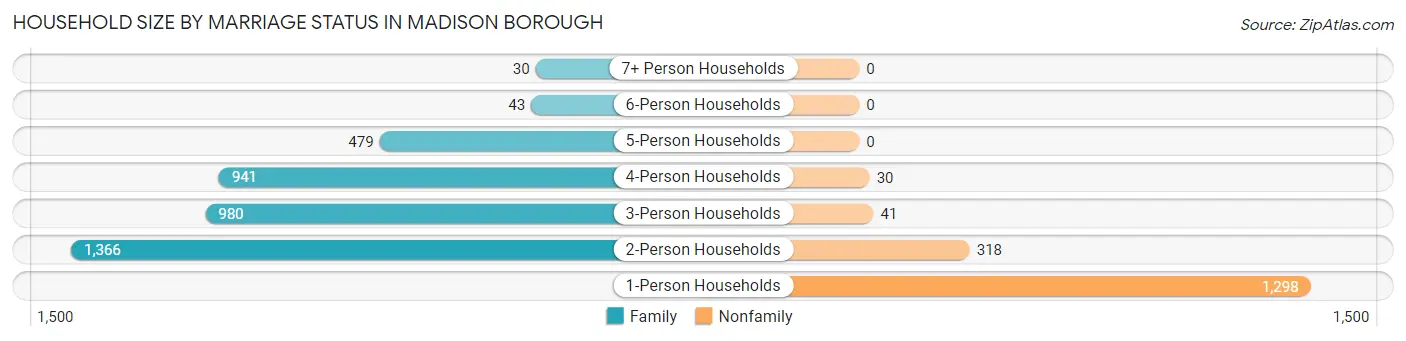
| Household Size | Family Households | Nonfamily Households |
| 1-Person Households | - | 1,298 (23.5%) |
| 2-Person Households | 1,366 (24.7%) | 318 (5.8%) |
| 3-Person Households | 980 (17.7%) | 41 (0.7%) |
| 4-Person Households | 941 (17.0%) | 30 (0.5%) |
| 5-Person Households | 479 (8.7%) | 0 (0.0%) |
| 6-Person Households | 43 (0.8%) | 0 (0.0%) |
| 7+ Person Households | 30 (0.5%) | 0 (0.0%) |
| Total | 3,839 (69.5%) | 1,687 (30.5%) |
Female Fertility in Madison borough
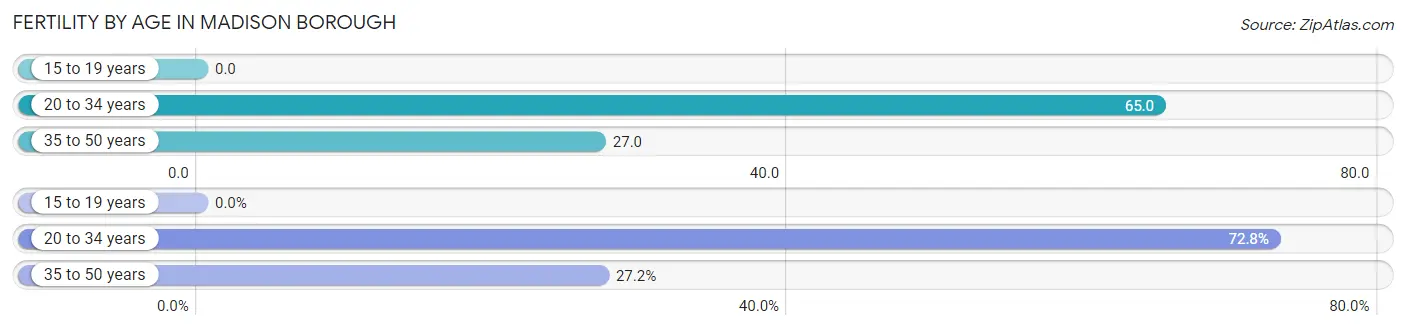
Fertility by Age in Madison borough
Average fertility rate in Madison borough is 39.0 births per 1,000 women. Women in the age bracket of 20 to 34 years have the highest fertility rate with 65.0 births per 1,000 women. Women in the age bracket of 20 to 34 years acount for 72.8% of all women with births.
| Age Bracket | Women with Births | Births / 1,000 Women |
| 15 to 19 years | 0 (0.0%) | 0.0 |
| 20 to 34 years | 107 (72.8%) | 65.0 |
| 35 to 50 years | 40 (27.2%) | 27.0 |
| Total | 147 (100.0%) | 39.0 |
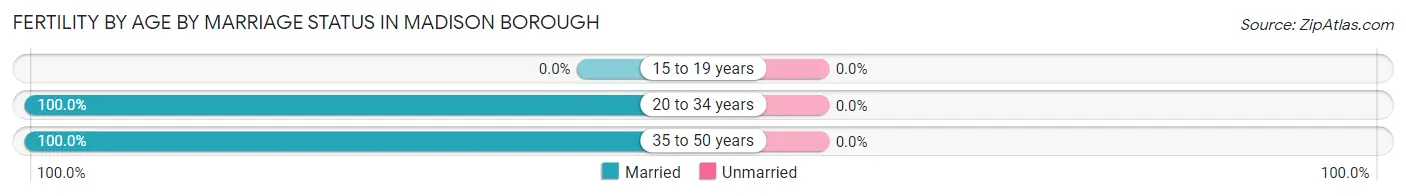
Fertility by Age by Marriage Status in Madison borough
| Age Bracket | Married | Unmarried |
| 15 to 19 years | 0 (0.0%) | 0 (0.0%) |
| 20 to 34 years | 107 (100.0%) | 0 (0.0%) |
| 35 to 50 years | 40 (100.0%) | 0 (0.0%) |
| Total | 147 (100.0%) | 0 (0.0%) |
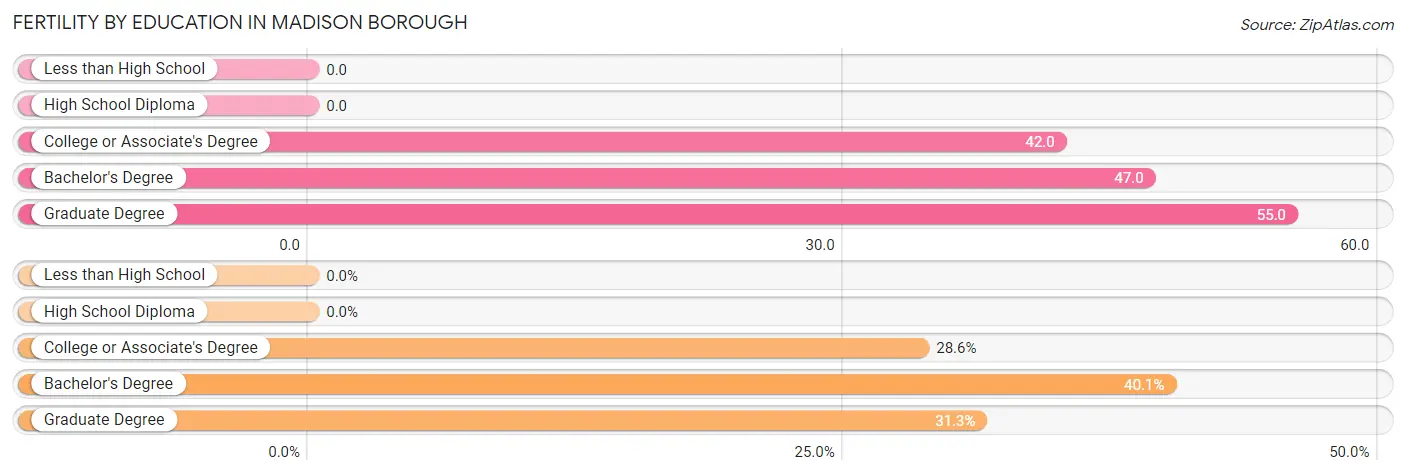
Fertility by Education in Madison borough
| Educational Attainment | Women with Births | Births / 1,000 Women |
| Less than High School | 0 (0.0%) | 0.0 |
| High School Diploma | 0 (0.0%) | 0.0 |
| College or Associate's Degree | 42 (28.6%) | 42.0 |
| Bachelor's Degree | 59 (40.1%) | 47.0 |
| Graduate Degree | 46 (31.3%) | 55.0 |
| Total | 147 (100.0%) | 39.0 |
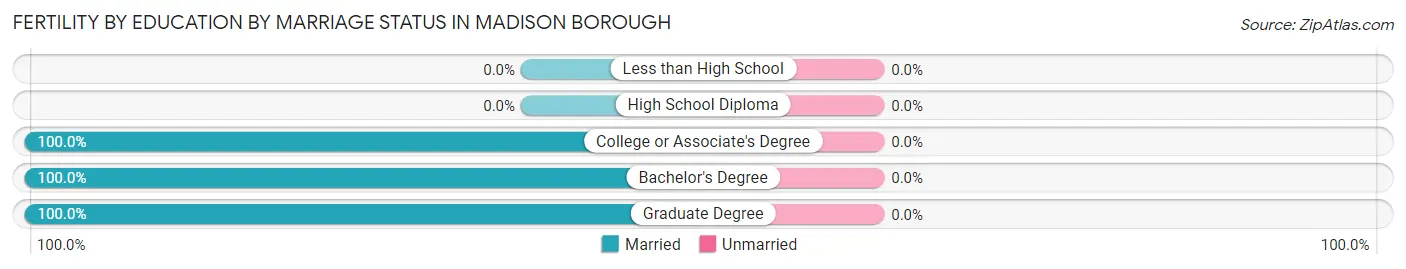
Fertility by Education by Marriage Status in Madison borough
| Educational Attainment | Married | Unmarried |
| Less than High School | 0 (0.0%) | 0 (0.0%) |
| High School Diploma | 0 (0.0%) | 0 (0.0%) |
| College or Associate's Degree | 42 (100.0%) | 0 (0.0%) |
| Bachelor's Degree | 59 (100.0%) | 0 (0.0%) |
| Graduate Degree | 46 (100.0%) | 0 (0.0%) |
| Total | 147 (100.0%) | 0 (0.0%) |
Employment Characteristics in Madison borough
Employment by Class of Employer in Madison borough
Among the 8,391 employed individuals in Madison borough, private company employees (6,192 | 73.8%), not-for-profit organizations (738 | 8.8%), and local government employees (537 | 6.4%) make up the most common classes of employment.
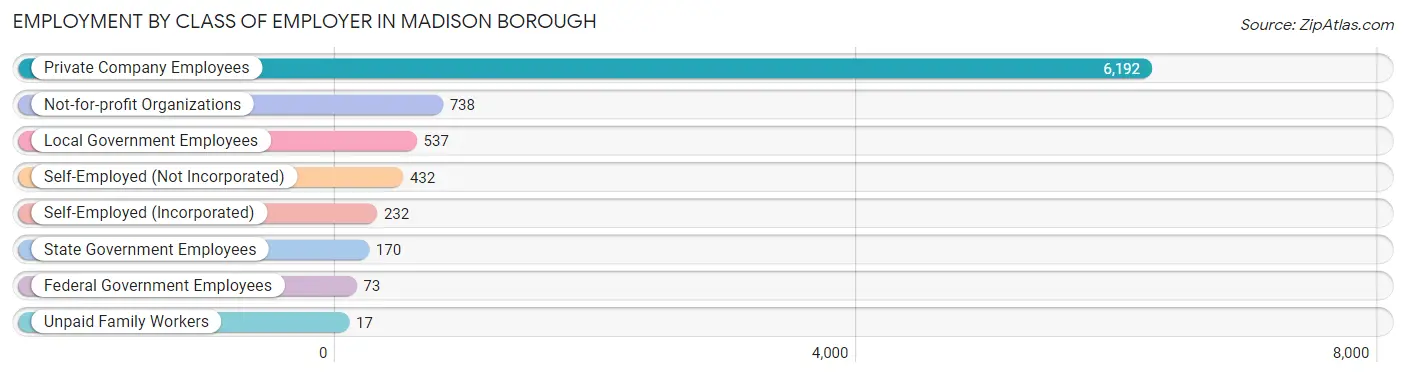
| Employer Class | # Employees | % Employees |
| Private Company Employees | 6,192 | 73.8% |
| Self-Employed (Incorporated) | 232 | 2.8% |
| Self-Employed (Not Incorporated) | 432 | 5.1% |
| Not-for-profit Organizations | 738 | 8.8% |
| Local Government Employees | 537 | 6.4% |
| State Government Employees | 170 | 2.0% |
| Federal Government Employees | 73 | 0.9% |
| Unpaid Family Workers | 17 | 0.2% |
| Total | 8,391 | 100.0% |
Employment Status by Age in Madison borough
According to the labor force statistics for Madison borough, out of the total population over 16 years of age (13,203), 69.7% or 9,202 individuals are in the labor force, with 6.9% or 635 of them unemployed. The age group with the highest labor force participation rate is 25 to 29 years, with 98.2% or 719 individuals in the labor force. Within the labor force, the 20 to 24 years age range has the highest percentage of unemployed individuals, with 17.6% or 196 of them being unemployed.
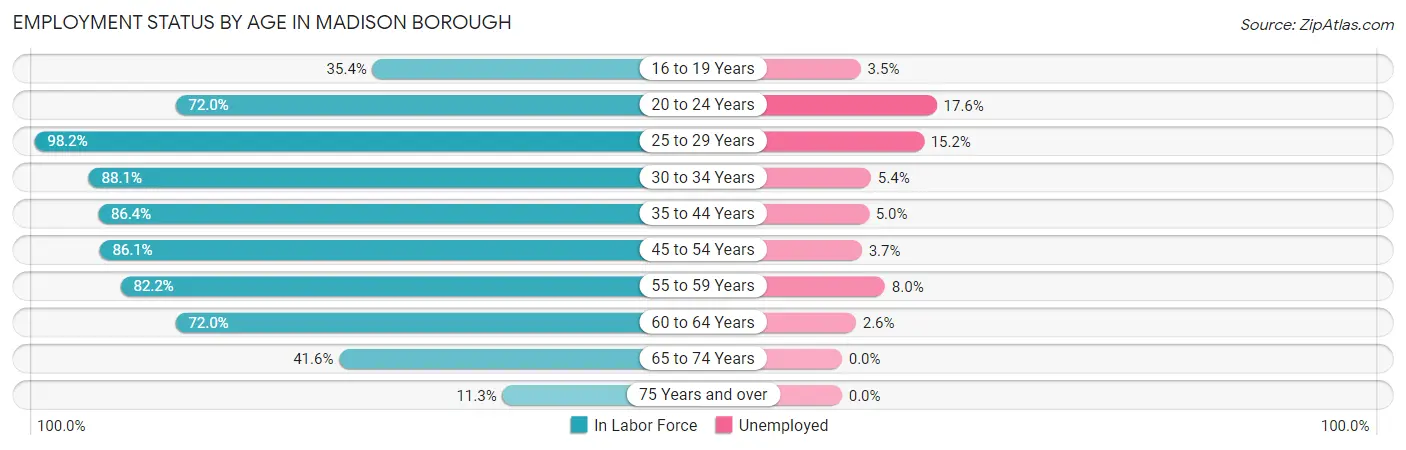
| Age Bracket | In Labor Force | Unemployed |
| 16 to 19 Years | 401 (35.4%) | 14 (3.5%) |
| 20 to 24 Years | 1,112 (72.0%) | 196 (17.6%) |
| 25 to 29 Years | 719 (98.2%) | 109 (15.2%) |
| 30 to 34 Years | 900 (88.1%) | 49 (5.4%) |
| 35 to 44 Years | 1,599 (86.4%) | 80 (5.0%) |
| 45 to 54 Years | 2,005 (86.1%) | 74 (3.7%) |
| 55 to 59 Years | 1,146 (82.2%) | 92 (8.0%) |
| 60 to 64 Years | 680 (72.0%) | 18 (2.6%) |
| 65 to 74 Years | 522 (41.6%) | 0 (0.0%) |
| 75 Years and over | 113 (11.3%) | 0 (0.0%) |
| Total | 9,202 (69.7%) | 635 (6.9%) |
Employment Status by Educational Attainment in Madison borough
According to labor force statistics for Madison borough, 85.2% of individuals (7,049) out of the total population between 25 and 64 years of age (8,273) are in the labor force, with 6.0% or 423 of them being unemployed. The group with the highest labor force participation rate are those with the educational attainment of less than high school, with 88.3% or 158 individuals in the labor force. Within the labor force, individuals with high school diploma education have the highest percentage of unemployment, with 12.7% or 108 of them being unemployed.
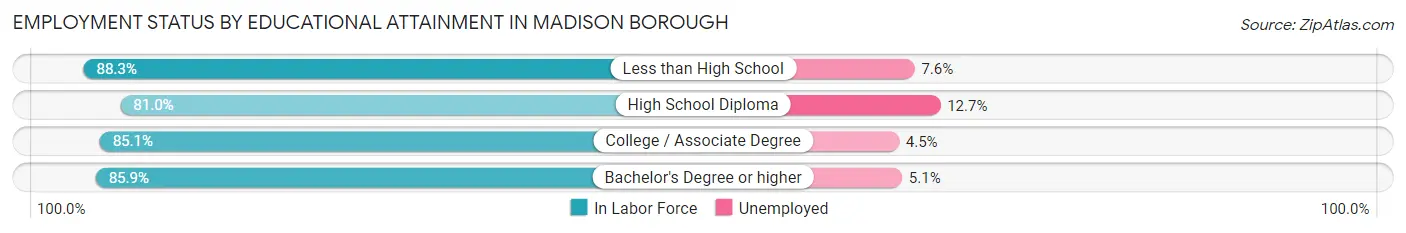
| Educational Attainment | In Labor Force | Unemployed |
| Less than High School | 158 (88.3%) | 14 (7.6%) |
| High School Diploma | 848 (81.0%) | 133 (12.7%) |
| College / Associate Degree | 772 (85.1%) | 41 (4.5%) |
| Bachelor's Degree or higher | 5,274 (85.9%) | 313 (5.1%) |
| Total | 7,049 (85.2%) | 496 (6.0%) |
Employment Occupations by Sex in Madison borough
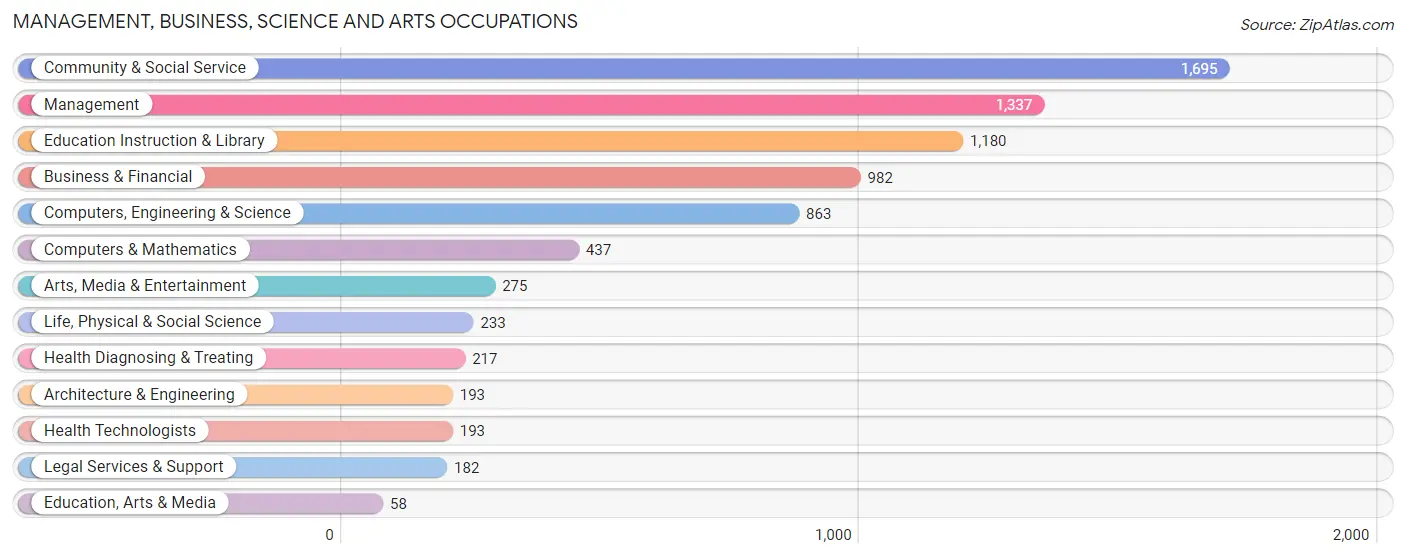
Management, Business, Science and Arts Occupations
The most common Management, Business, Science and Arts occupations in Madison borough are Community & Social Service (1,695 | 19.8%), Management (1,337 | 15.6%), Education Instruction & Library (1,180 | 13.8%), Business & Financial (982 | 11.5%), and Computers, Engineering & Science (863 | 10.1%).
Management, Business, Science and Arts Occupations by Sex
Within the Management, Business, Science and Arts occupations in Madison borough, the most male-oriented occupations are Architecture & Engineering (82.9%), Computers & Mathematics (82.2%), and Computers, Engineering & Science (74.4%), while the most female-oriented occupations are Education Instruction & Library (67.8%), Education, Arts & Media (63.8%), and Community & Social Service (61.8%).
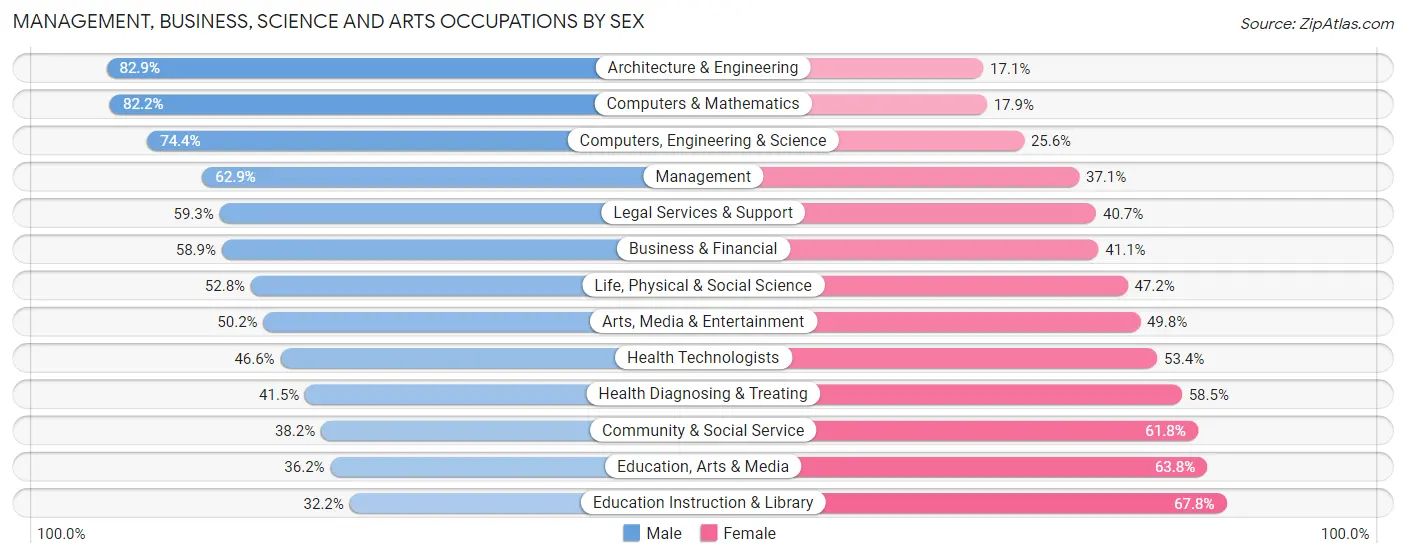
| Occupation | Male | Female |
| Management | 841 (62.9%) | 496 (37.1%) |
| Business & Financial | 578 (58.9%) | 404 (41.1%) |
| Computers, Engineering & Science | 642 (74.4%) | 221 (25.6%) |
| Computers & Mathematics | 359 (82.2%) | 78 (17.8%) |
| Architecture & Engineering | 160 (82.9%) | 33 (17.1%) |
| Life, Physical & Social Science | 123 (52.8%) | 110 (47.2%) |
| Community & Social Service | 647 (38.2%) | 1,048 (61.8%) |
| Education, Arts & Media | 21 (36.2%) | 37 (63.8%) |
| Legal Services & Support | 108 (59.3%) | 74 (40.7%) |
| Education Instruction & Library | 380 (32.2%) | 800 (67.8%) |
| Arts, Media & Entertainment | 138 (50.2%) | 137 (49.8%) |
| Health Diagnosing & Treating | 90 (41.5%) | 127 (58.5%) |
| Health Technologists | 90 (46.6%) | 103 (53.4%) |
| Total (Category) | 2,798 (54.9%) | 2,296 (45.1%) |
| Total (Overall) | 4,619 (53.9%) | 3,950 (46.1%) |
Services Occupations
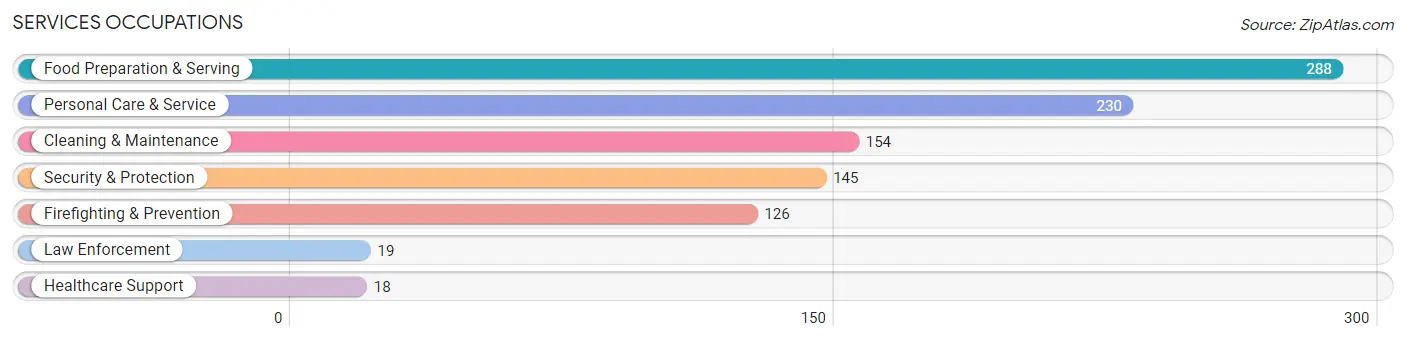
The most common Services occupations in Madison borough are Food Preparation & Serving (288 | 3.4%), Personal Care & Service (230 | 2.7%), Cleaning & Maintenance (154 | 1.8%), Security & Protection (145 | 1.7%), and Firefighting & Prevention (126 | 1.5%).
Services Occupations by Sex
Within the Services occupations in Madison borough, the most male-oriented occupations are Law Enforcement (100.0%), Security & Protection (79.3%), and Firefighting & Prevention (76.2%), while the most female-oriented occupations are Personal Care & Service (78.7%), Healthcare Support (61.1%), and Food Preparation & Serving (36.5%).
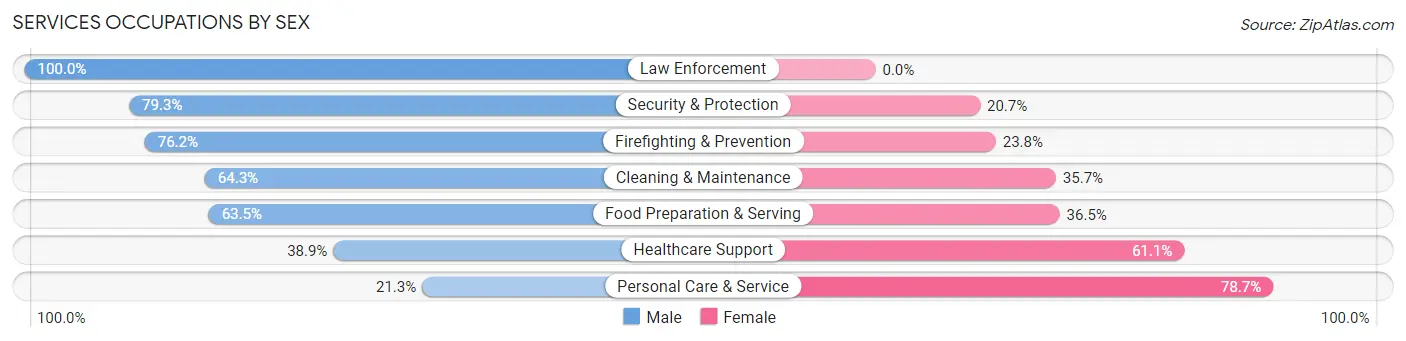
| Occupation | Male | Female |
| Healthcare Support | 7 (38.9%) | 11 (61.1%) |
| Security & Protection | 115 (79.3%) | 30 (20.7%) |
| Firefighting & Prevention | 96 (76.2%) | 30 (23.8%) |
| Law Enforcement | 19 (100.0%) | 0 (0.0%) |
| Food Preparation & Serving | 183 (63.5%) | 105 (36.5%) |
| Cleaning & Maintenance | 99 (64.3%) | 55 (35.7%) |
| Personal Care & Service | 49 (21.3%) | 181 (78.7%) |
| Total (Category) | 453 (54.2%) | 382 (45.8%) |
| Total (Overall) | 4,619 (53.9%) | 3,950 (46.1%) |
Sales and Office Occupations
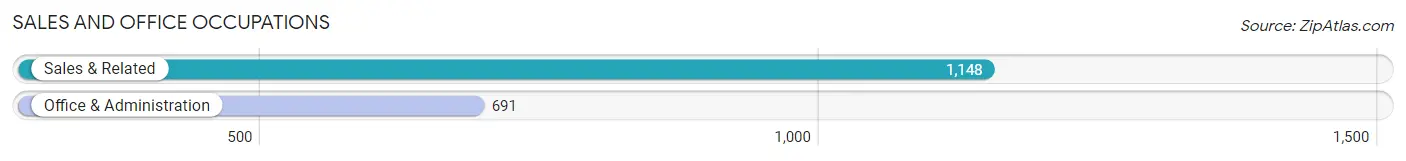
The most common Sales and Office occupations in Madison borough are Sales & Related (1,148 | 13.4%), and Office & Administration (691 | 8.1%).
Sales and Office Occupations by Sex
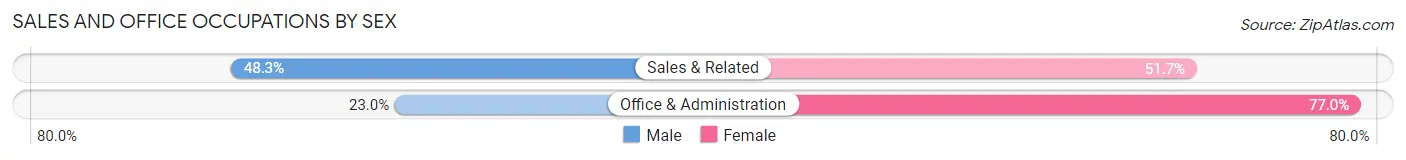
| Occupation | Male | Female |
| Sales & Related | 554 (48.3%) | 594 (51.7%) |
| Office & Administration | 159 (23.0%) | 532 (77.0%) |
| Total (Category) | 713 (38.8%) | 1,126 (61.2%) |
| Total (Overall) | 4,619 (53.9%) | 3,950 (46.1%) |
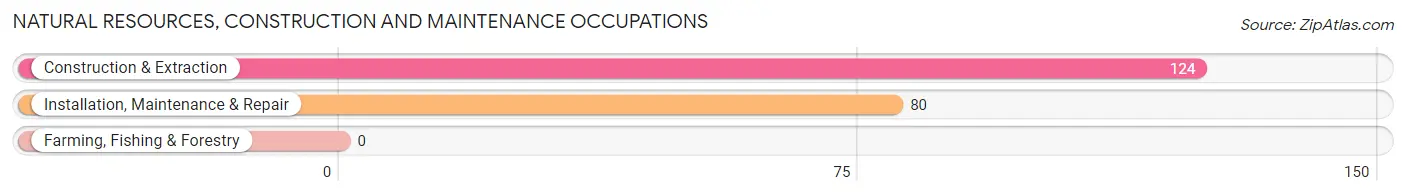
Natural Resources, Construction and Maintenance Occupations
The most common Natural Resources, Construction and Maintenance occupations in Madison borough are Construction & Extraction (124 | 1.5%), and Installation, Maintenance & Repair (80 | 0.9%).
Natural Resources, Construction and Maintenance Occupations by Sex
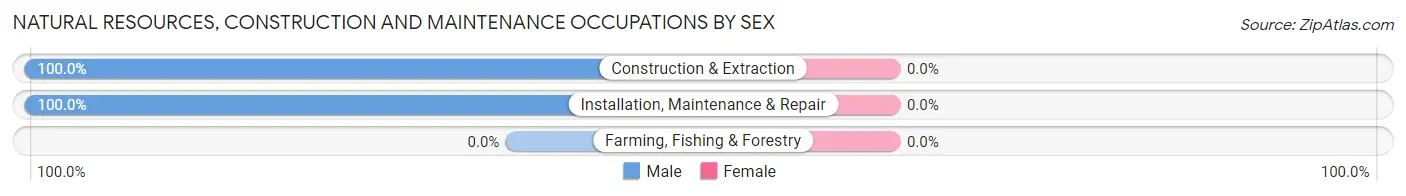
| Occupation | Male | Female |
| Farming, Fishing & Forestry | 0 (0.0%) | 0 (0.0%) |
| Construction & Extraction | 124 (100.0%) | 0 (0.0%) |
| Installation, Maintenance & Repair | 80 (100.0%) | 0 (0.0%) |
| Total (Category) | 204 (100.0%) | 0 (0.0%) |
| Total (Overall) | 4,619 (53.9%) | 3,950 (46.1%) |
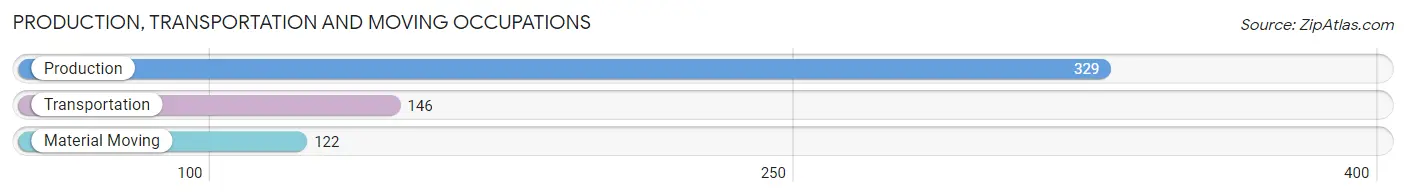
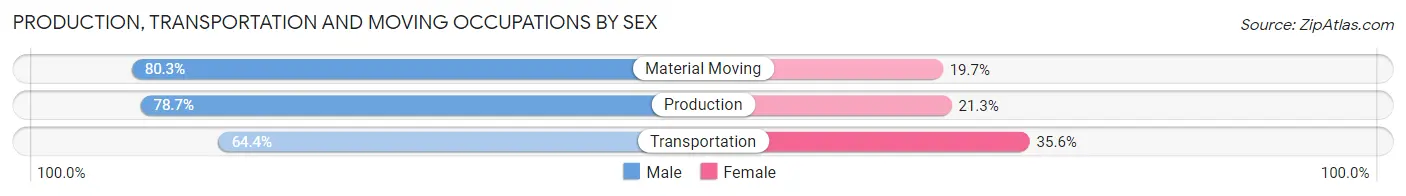
Production, Transportation and Moving Occupations
The most common Production, Transportation and Moving occupations in Madison borough are Production (329 | 3.8%), Transportation (146 | 1.7%), and Material Moving (122 | 1.4%).
Production, Transportation and Moving Occupations by Sex
| Occupation | Male | Female |
| Production | 259 (78.7%) | 70 (21.3%) |
| Transportation | 94 (64.4%) | 52 (35.6%) |
| Material Moving | 98 (80.3%) | 24 (19.7%) |
| Total (Category) | 451 (75.5%) | 146 (24.5%) |
| Total (Overall) | 4,619 (53.9%) | 3,950 (46.1%) |
Employment Industries by Sex in Madison borough
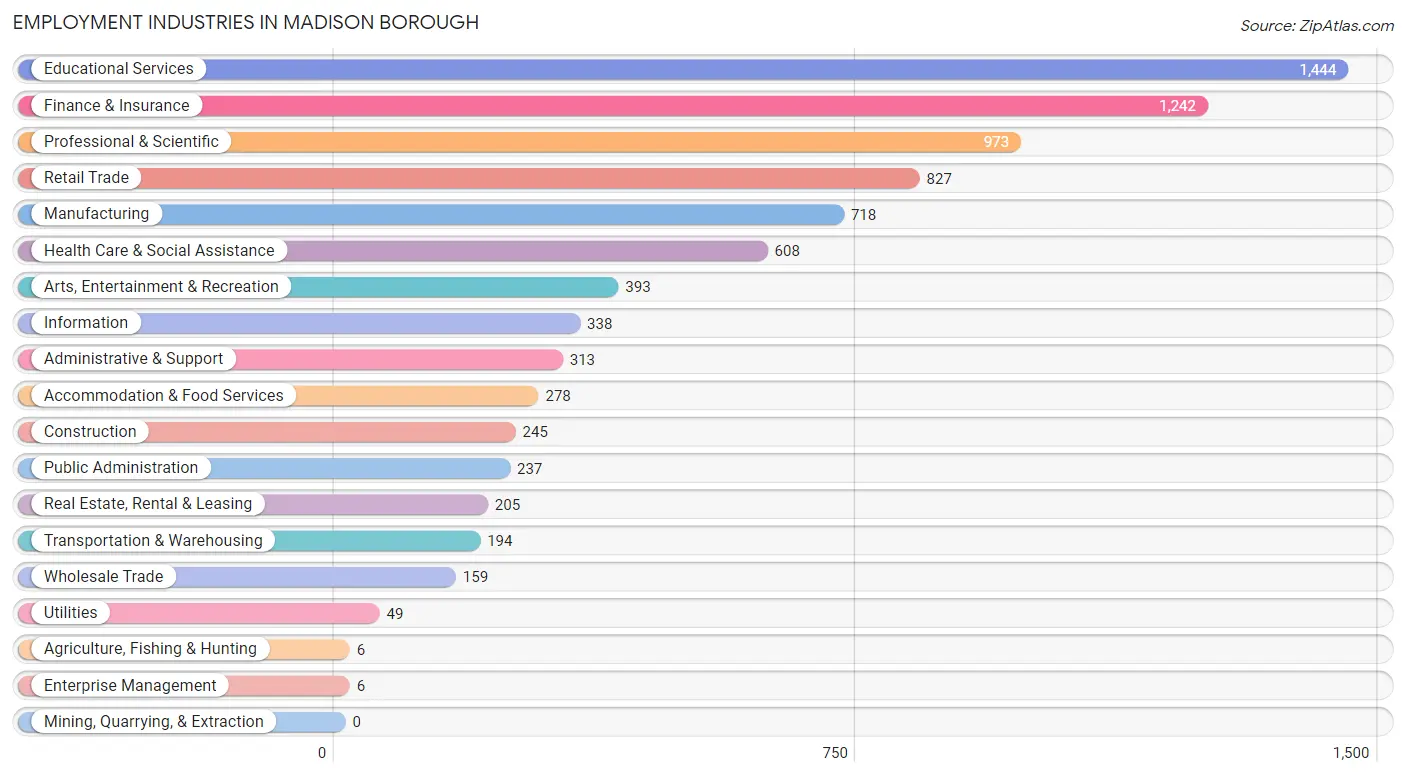
Employment Industries in Madison borough
The major employment industries in Madison borough include Educational Services (1,444 | 16.9%), Finance & Insurance (1,242 | 14.5%), Professional & Scientific (973 | 11.4%), Retail Trade (827 | 9.7%), and Manufacturing (718 | 8.4%).
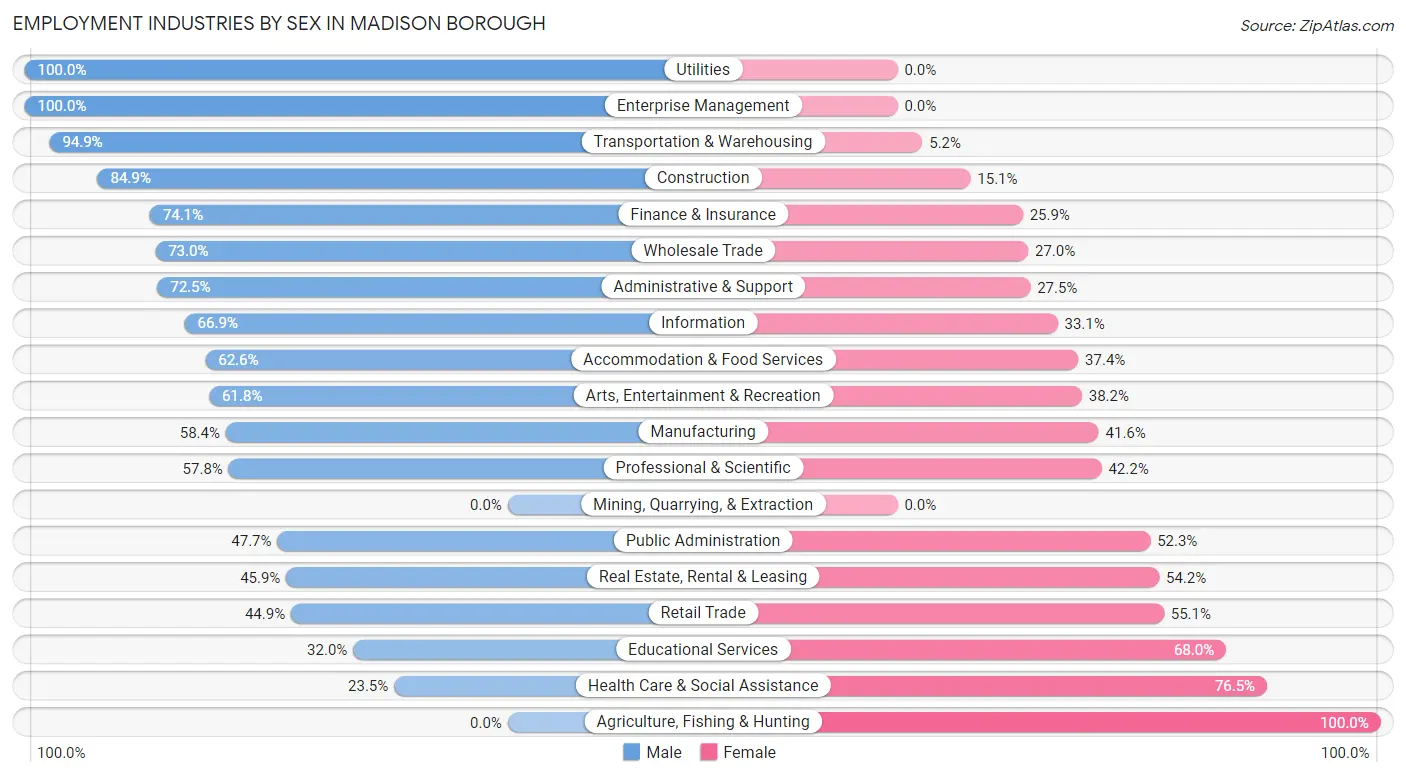
Employment Industries by Sex in Madison borough
The Madison borough industries that see more men than women are Utilities (100.0%), Enterprise Management (100.0%), and Transportation & Warehousing (94.9%), whereas the industries that tend to have a higher number of women are Agriculture, Fishing & Hunting (100.0%), Health Care & Social Assistance (76.5%), and Educational Services (68.0%).
| Industry | Male | Female |
| Agriculture, Fishing & Hunting | 0 (0.0%) | 6 (100.0%) |
| Mining, Quarrying, & Extraction | 0 (0.0%) | 0 (0.0%) |
| Construction | 208 (84.9%) | 37 (15.1%) |
| Manufacturing | 419 (58.4%) | 299 (41.6%) |
| Wholesale Trade | 116 (73.0%) | 43 (27.0%) |
| Retail Trade | 371 (44.9%) | 456 (55.1%) |
| Transportation & Warehousing | 184 (94.9%) | 10 (5.1%) |
| Utilities | 49 (100.0%) | 0 (0.0%) |
| Information | 226 (66.9%) | 112 (33.1%) |
| Finance & Insurance | 920 (74.1%) | 322 (25.9%) |
| Real Estate, Rental & Leasing | 94 (45.9%) | 111 (54.1%) |
| Professional & Scientific | 562 (57.8%) | 411 (42.2%) |
| Enterprise Management | 6 (100.0%) | 0 (0.0%) |
| Administrative & Support | 227 (72.5%) | 86 (27.5%) |
| Educational Services | 462 (32.0%) | 982 (68.0%) |
| Health Care & Social Assistance | 143 (23.5%) | 465 (76.5%) |
| Arts, Entertainment & Recreation | 243 (61.8%) | 150 (38.2%) |
| Accommodation & Food Services | 174 (62.6%) | 104 (37.4%) |
| Public Administration | 113 (47.7%) | 124 (52.3%) |
| Total | 4,619 (53.9%) | 3,950 (46.1%) |
Education in Madison borough
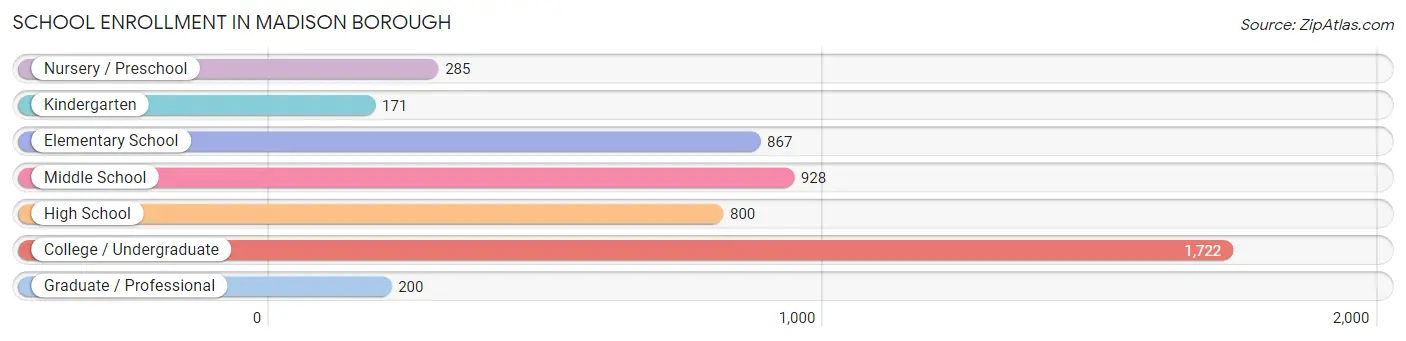
School Enrollment in Madison borough
The most common levels of schooling among the 4,973 students in Madison borough are college / undergraduate (1,722 | 34.6%), middle school (928 | 18.7%), and elementary school (867 | 17.4%).
| School Level | # Students | % Students |
| Nursery / Preschool | 285 | 5.7% |
| Kindergarten | 171 | 3.4% |
| Elementary School | 867 | 17.4% |
| Middle School | 928 | 18.7% |
| High School | 800 | 16.1% |
| College / Undergraduate | 1,722 | 34.6% |
| Graduate / Professional | 200 | 4.0% |
| Total | 4,973 | 100.0% |
School Enrollment by Age by Funding Source in Madison borough
Out of a total of 4,973 students who are enrolled in schools in Madison borough, 2,322 (46.7%) attend a private institution, while the remaining 2,651 (53.3%) are enrolled in public schools. The age group of 3 to 4 year olds has the highest likelihood of being enrolled in private schools, with 202 (89.8% in the age bracket) enrolled. Conversely, the age group of 5 to 9 year old has the lowest likelihood of being enrolled in a private school, with 859 (85.1% in the age bracket) attending a public institution.
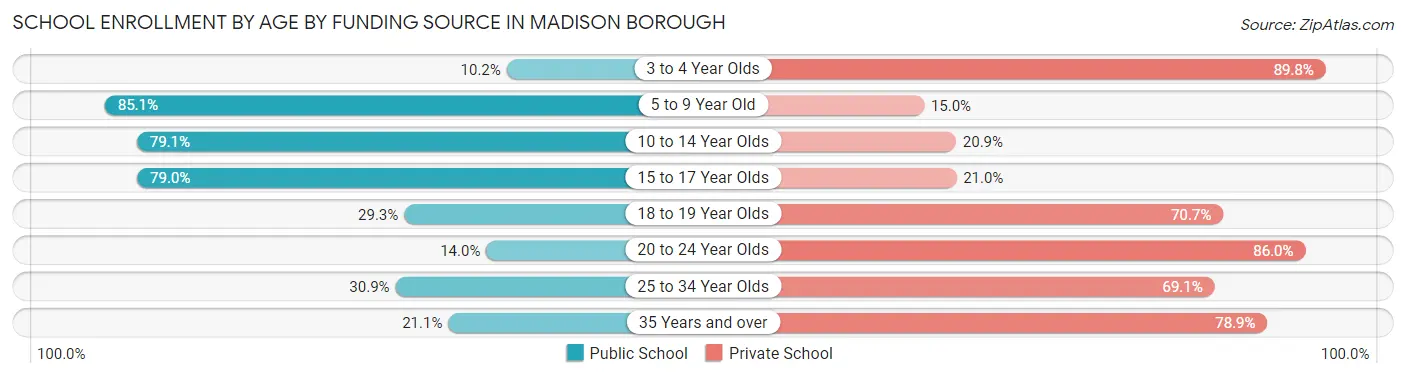
| Age Bracket | Public School | Private School |
| 3 to 4 Year Olds | 23 (10.2%) | 202 (89.8%) |
| 5 to 9 Year Old | 859 (85.1%) | 151 (14.9%) |
| 10 to 14 Year Olds | 897 (79.1%) | 237 (20.9%) |
| 15 to 17 Year Olds | 460 (79.0%) | 122 (21.0%) |
| 18 to 19 Year Olds | 194 (29.3%) | 468 (70.7%) |
| 20 to 24 Year Olds | 159 (14.0%) | 976 (86.0%) |
| 25 to 34 Year Olds | 30 (30.9%) | 67 (69.1%) |
| 35 Years and over | 27 (21.1%) | 101 (78.9%) |
| Total | 2,651 (53.3%) | 2,322 (46.7%) |
Educational Attainment by Field of Study in Madison borough
Business (2,011 | 24.8%), social sciences (1,075 | 13.3%), education (778 | 9.6%), engineering (501 | 6.2%), and visual & performing arts (484 | 6.0%) are the most common fields of study among 8,115 individuals in Madison borough who have obtained a bachelor's degree or higher.
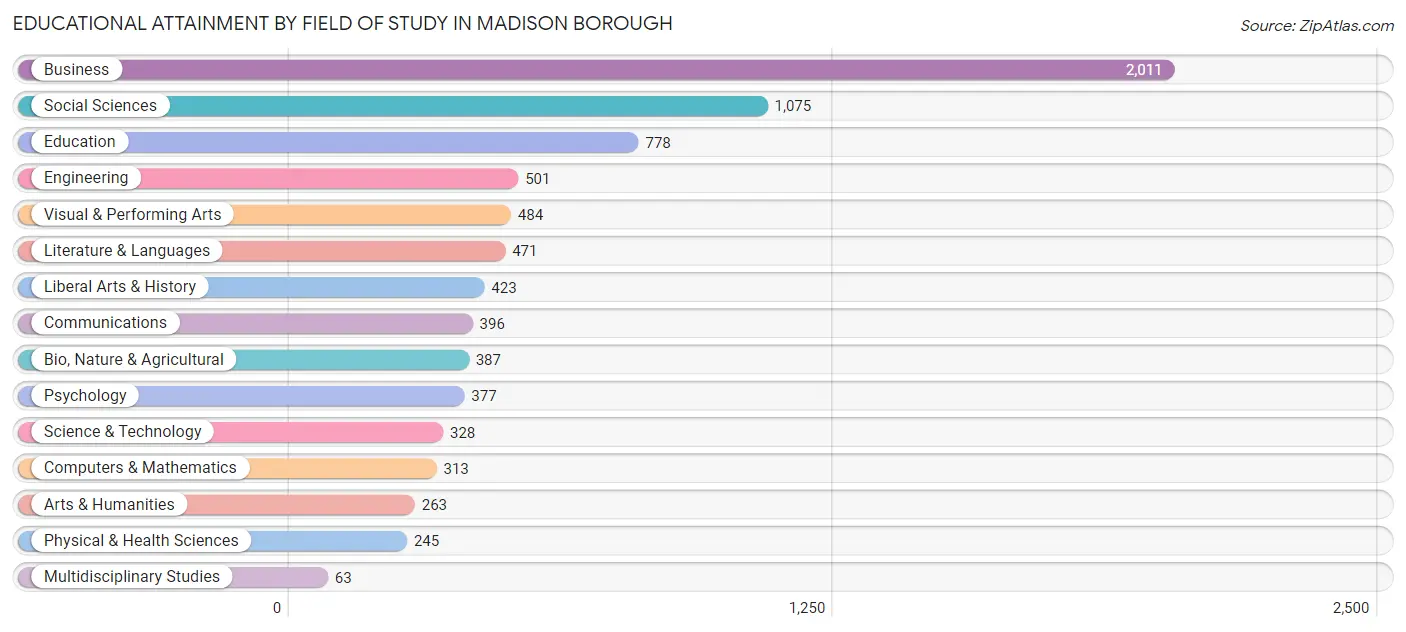
| Field of Study | # Graduates | % Graduates |
| Computers & Mathematics | 313 | 3.9% |
| Bio, Nature & Agricultural | 387 | 4.8% |
| Physical & Health Sciences | 245 | 3.0% |
| Psychology | 377 | 4.6% |
| Social Sciences | 1,075 | 13.3% |
| Engineering | 501 | 6.2% |
| Multidisciplinary Studies | 63 | 0.8% |
| Science & Technology | 328 | 4.0% |
| Business | 2,011 | 24.8% |
| Education | 778 | 9.6% |
| Literature & Languages | 471 | 5.8% |
| Liberal Arts & History | 423 | 5.2% |
| Visual & Performing Arts | 484 | 6.0% |
| Communications | 396 | 4.9% |
| Arts & Humanities | 263 | 3.2% |
| Total | 8,115 | 100.0% |
Transportation & Commute in Madison borough
Vehicle Availability by Sex in Madison borough
The most prevalent vehicle ownership categories in Madison borough are males with 2 vehicles (2,331, accounting for 54.8%) and females with 2 vehicles (1,944, making up 66.8%).
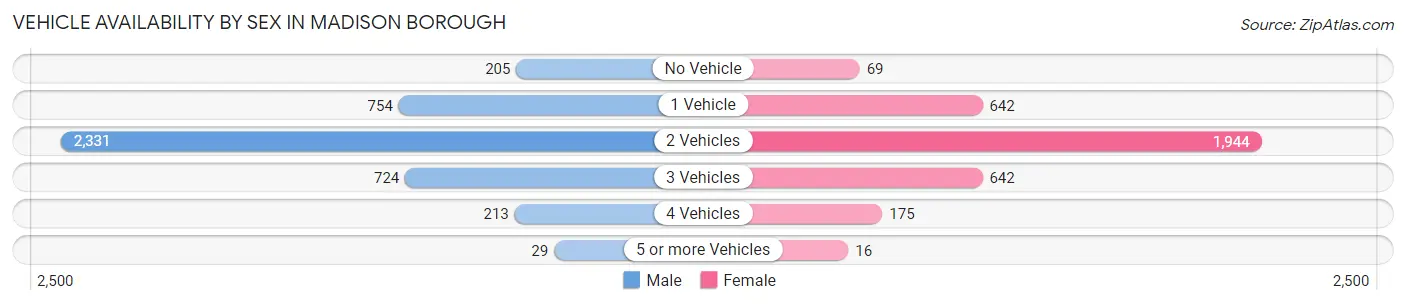
| Vehicles Available | Male | Female |
| No Vehicle | 205 (4.8%) | 69 (2.0%) |
| 1 Vehicle | 754 (17.7%) | 642 (18.4%) |
| 2 Vehicles | 2,331 (54.8%) | 1,944 (55.7%) |
| 3 Vehicles | 724 (17.0%) | 642 (18.4%) |
| 4 Vehicles | 213 (5.0%) | 175 (5.0%) |
| 5 or more Vehicles | 29 (0.7%) | 16 (0.5%) |
| Total | 4,256 (100.0%) | 3,488 (100.0%) |
Commute Time in Madison borough
The most frequently occuring commute durations in Madison borough are 10 to 14 minutes (1,049 commuters, 16.0%), 15 to 19 minutes (987 commuters, 15.1%), and 5 to 9 minutes (894 commuters, 13.7%).
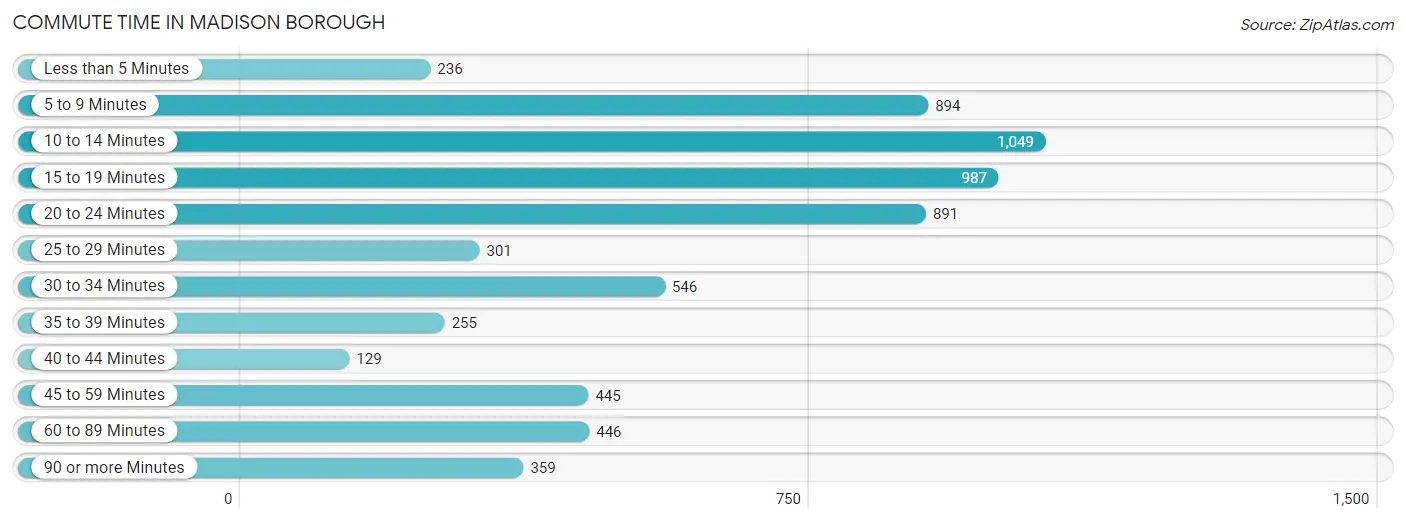
| Commute Time | # Commuters | % Commuters |
| Less than 5 Minutes | 236 | 3.6% |
| 5 to 9 Minutes | 894 | 13.7% |
| 10 to 14 Minutes | 1,049 | 16.0% |
| 15 to 19 Minutes | 987 | 15.1% |
| 20 to 24 Minutes | 891 | 13.6% |
| 25 to 29 Minutes | 301 | 4.6% |
| 30 to 34 Minutes | 546 | 8.4% |
| 35 to 39 Minutes | 255 | 3.9% |
| 40 to 44 Minutes | 129 | 2.0% |
| 45 to 59 Minutes | 445 | 6.8% |
| 60 to 89 Minutes | 446 | 6.8% |
| 90 or more Minutes | 359 | 5.5% |
Commute Time by Sex in Madison borough
The most common commute times in Madison borough are 15 to 19 minutes (542 commuters, 15.4%) for males and 10 to 14 minutes (612 commuters, 20.3%) for females.
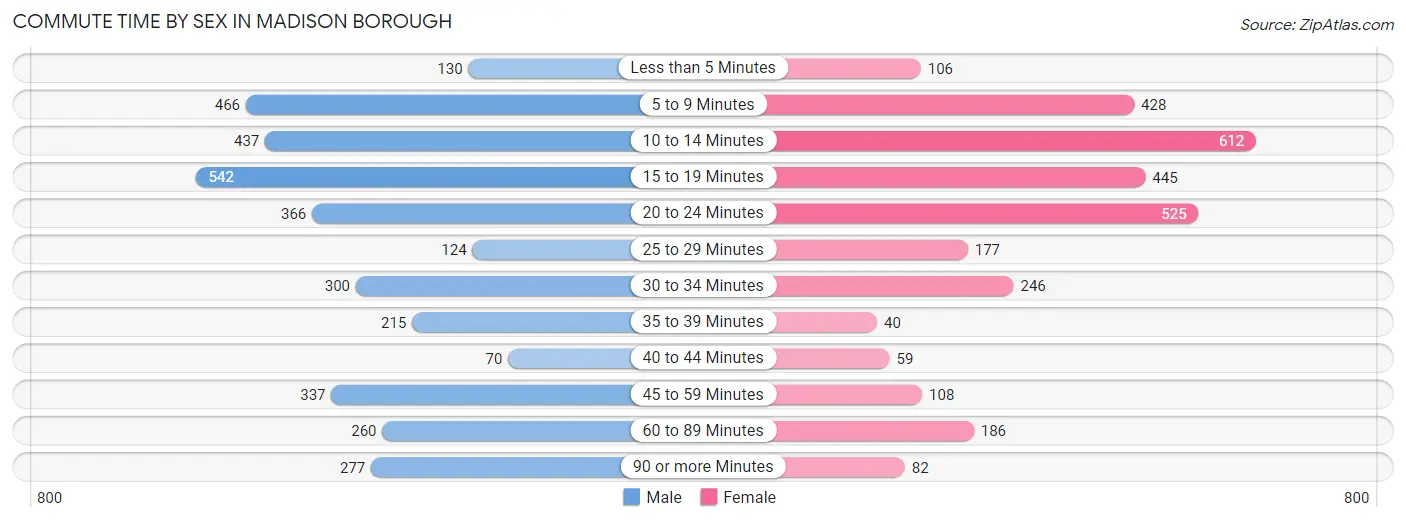
| Commute Time | Male | Female |
| Less than 5 Minutes | 130 (3.7%) | 106 (3.5%) |
| 5 to 9 Minutes | 466 (13.2%) | 428 (14.2%) |
| 10 to 14 Minutes | 437 (12.4%) | 612 (20.3%) |
| 15 to 19 Minutes | 542 (15.4%) | 445 (14.8%) |
| 20 to 24 Minutes | 366 (10.4%) | 525 (17.4%) |
| 25 to 29 Minutes | 124 (3.5%) | 177 (5.9%) |
| 30 to 34 Minutes | 300 (8.5%) | 246 (8.2%) |
| 35 to 39 Minutes | 215 (6.1%) | 40 (1.3%) |
| 40 to 44 Minutes | 70 (2.0%) | 59 (2.0%) |
| 45 to 59 Minutes | 337 (9.6%) | 108 (3.6%) |
| 60 to 89 Minutes | 260 (7.4%) | 186 (6.2%) |
| 90 or more Minutes | 277 (7.9%) | 82 (2.7%) |
Time of Departure to Work by Sex in Madison borough
The most frequent times of departure to work in Madison borough are 7:00 AM to 7:29 AM (747, 21.2%) for males and 8:00 AM to 8:29 AM (580, 19.2%) for females.
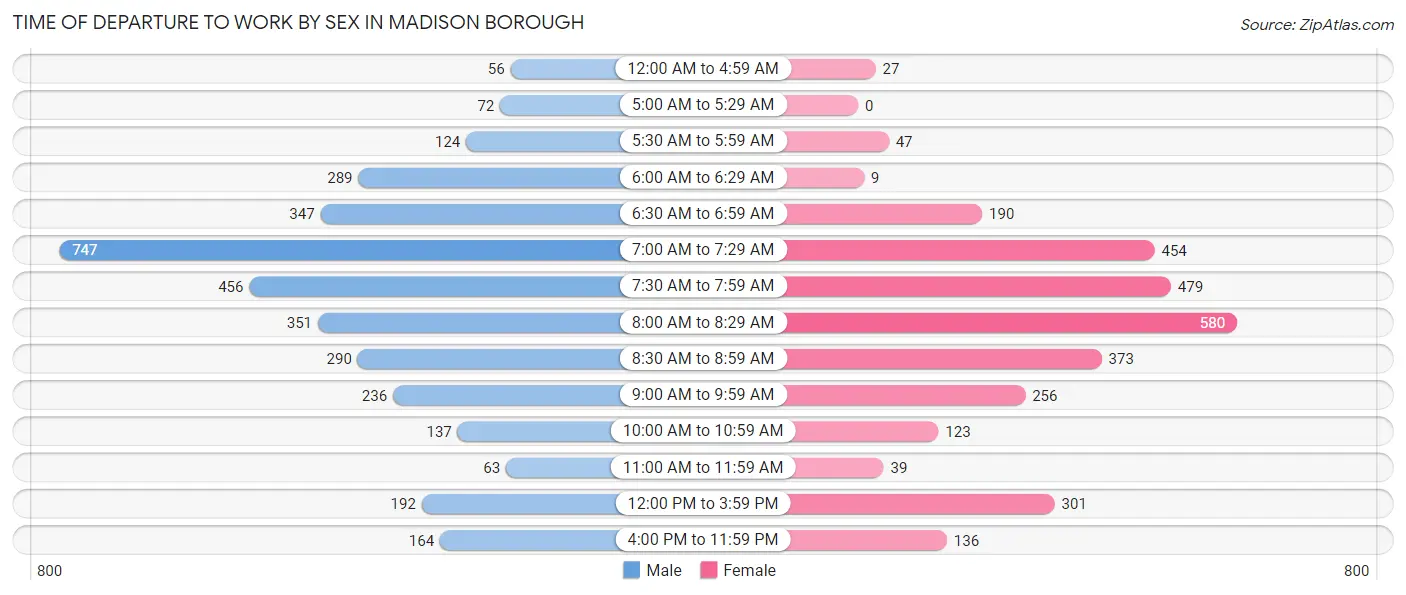
| Time of Departure | Male | Female |
| 12:00 AM to 4:59 AM | 56 (1.6%) | 27 (0.9%) |
| 5:00 AM to 5:29 AM | 72 (2.0%) | 0 (0.0%) |
| 5:30 AM to 5:59 AM | 124 (3.5%) | 47 (1.6%) |
| 6:00 AM to 6:29 AM | 289 (8.2%) | 9 (0.3%) |
| 6:30 AM to 6:59 AM | 347 (9.9%) | 190 (6.3%) |
| 7:00 AM to 7:29 AM | 747 (21.2%) | 454 (15.1%) |
| 7:30 AM to 7:59 AM | 456 (12.9%) | 479 (15.9%) |
| 8:00 AM to 8:29 AM | 351 (10.0%) | 580 (19.2%) |
| 8:30 AM to 8:59 AM | 290 (8.2%) | 373 (12.4%) |
| 9:00 AM to 9:59 AM | 236 (6.7%) | 256 (8.5%) |
| 10:00 AM to 10:59 AM | 137 (3.9%) | 123 (4.1%) |
| 11:00 AM to 11:59 AM | 63 (1.8%) | 39 (1.3%) |
| 12:00 PM to 3:59 PM | 192 (5.4%) | 301 (10.0%) |
| 4:00 PM to 11:59 PM | 164 (4.6%) | 136 (4.5%) |
| Total | 3,524 (100.0%) | 3,014 (100.0%) |
Housing Occupancy in Madison borough
Occupancy by Ownership in Madison borough
Of the total 5,526 dwellings in Madison borough, owner-occupied units account for 3,514 (63.6%), while renter-occupied units make up 2,012 (36.4%).
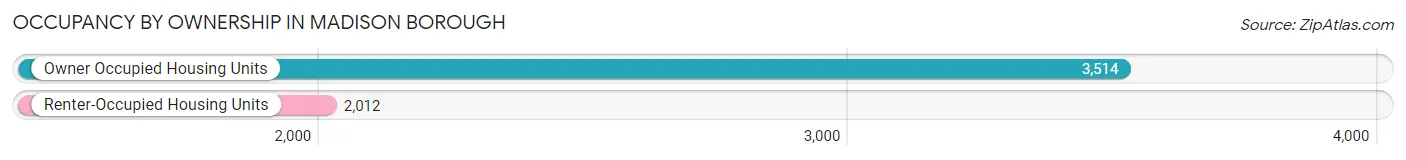
| Occupancy | # Housing Units | % Housing Units |
| Owner Occupied Housing Units | 3,514 | 63.6% |
| Renter-Occupied Housing Units | 2,012 | 36.4% |
| Total Occupied Housing Units | 5,526 | 100.0% |
Occupancy by Household Size in Madison borough
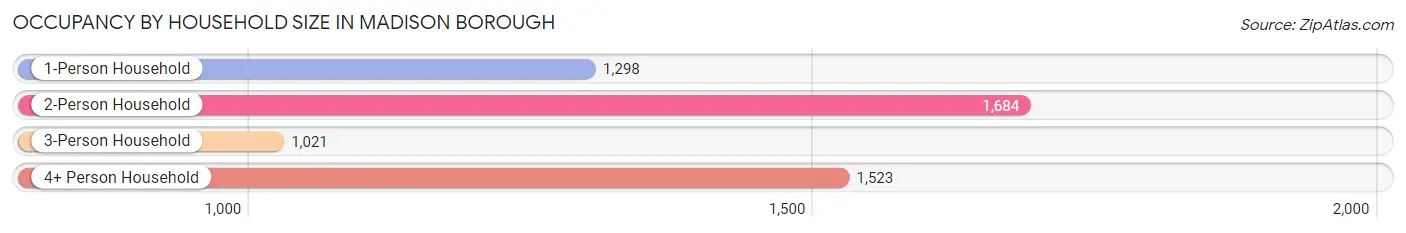
| Household Size | # Housing Units | % Housing Units |
| 1-Person Household | 1,298 | 23.5% |
| 2-Person Household | 1,684 | 30.5% |
| 3-Person Household | 1,021 | 18.5% |
| 4+ Person Household | 1,523 | 27.6% |
| Total Housing Units | 5,526 | 100.0% |
Occupancy by Ownership by Household Size in Madison borough
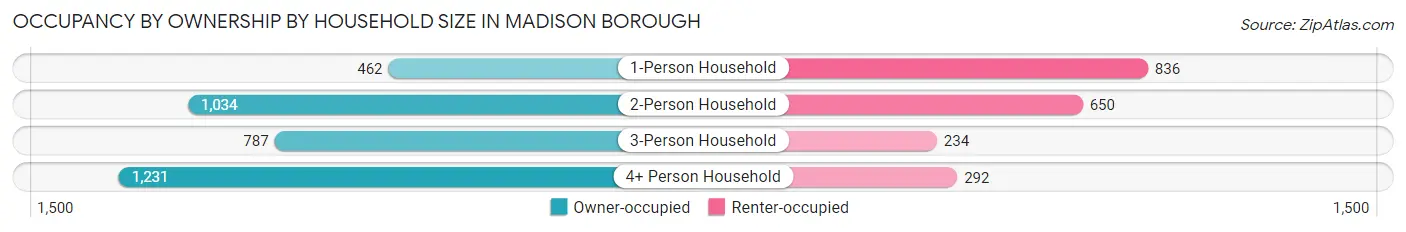
| Household Size | Owner-occupied | Renter-occupied |
| 1-Person Household | 462 (35.6%) | 836 (64.4%) |
| 2-Person Household | 1,034 (61.4%) | 650 (38.6%) |
| 3-Person Household | 787 (77.1%) | 234 (22.9%) |
| 4+ Person Household | 1,231 (80.8%) | 292 (19.2%) |
| Total Housing Units | 3,514 (63.6%) | 2,012 (36.4%) |
Occupancy by Educational Attainment in Madison borough
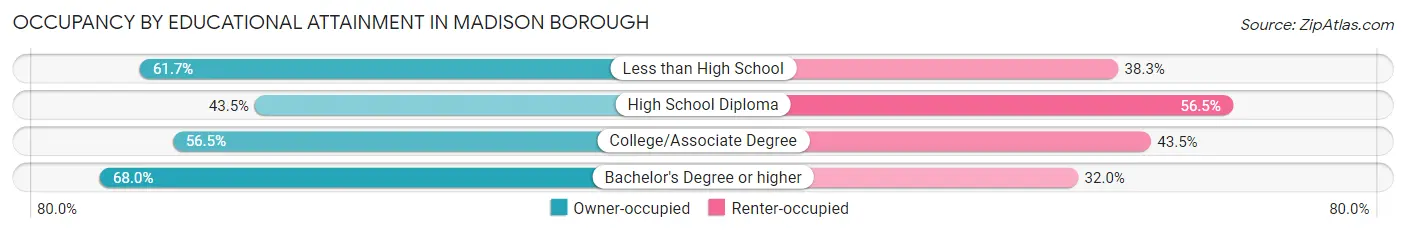
| Household Size | Owner-occupied | Renter-occupied |
| Less than High School | 87 (61.7%) | 54 (38.3%) |
| High School Diploma | 283 (43.5%) | 368 (56.5%) |
| College/Associate Degree | 378 (56.5%) | 291 (43.5%) |
| Bachelor's Degree or higher | 2,766 (68.0%) | 1,299 (32.0%) |
Occupancy by Age of Householder in Madison borough
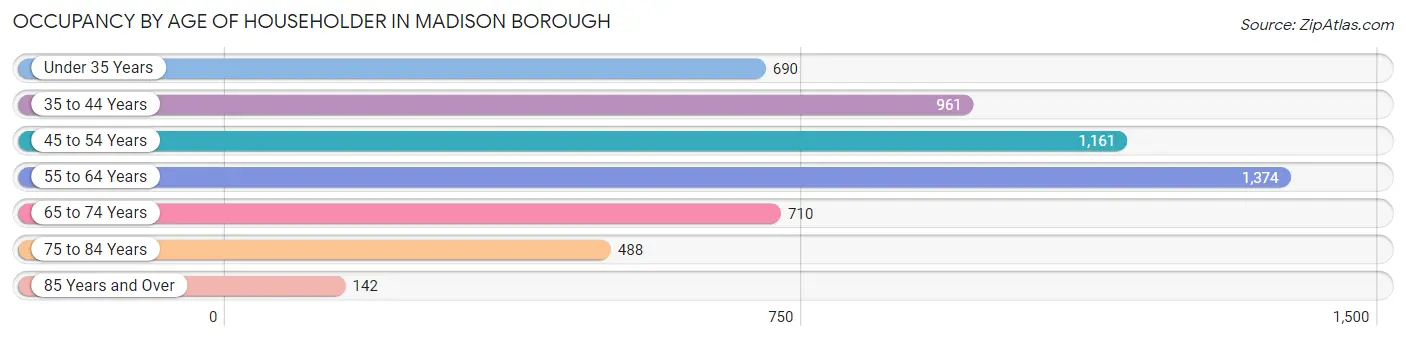
| Age Bracket | # Households | % Households |
| Under 35 Years | 690 | 12.5% |
| 35 to 44 Years | 961 | 17.4% |
| 45 to 54 Years | 1,161 | 21.0% |
| 55 to 64 Years | 1,374 | 24.9% |
| 65 to 74 Years | 710 | 12.9% |
| 75 to 84 Years | 488 | 8.8% |
| 85 Years and Over | 142 | 2.6% |
| Total | 5,526 | 100.0% |
Housing Finances in Madison borough
Median Income by Occupancy in Madison borough
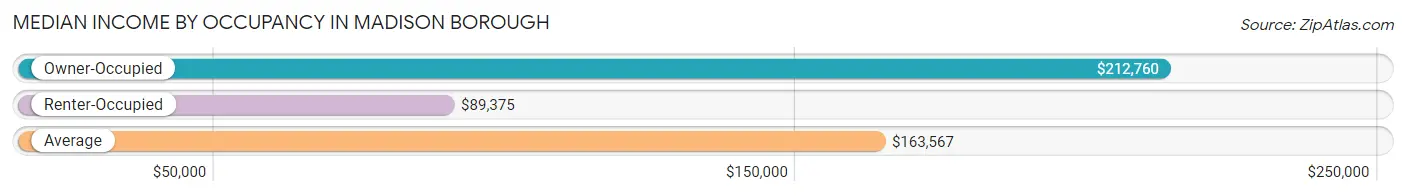
| Occupancy Type | # Households | Median Income |
| Owner-Occupied | 3,514 (63.6%) | $212,760 |
| Renter-Occupied | 2,012 (36.4%) | $89,375 |
| Average | 5,526 (100.0%) | $163,567 |
Occupancy by Householder Income Bracket in Madison borough
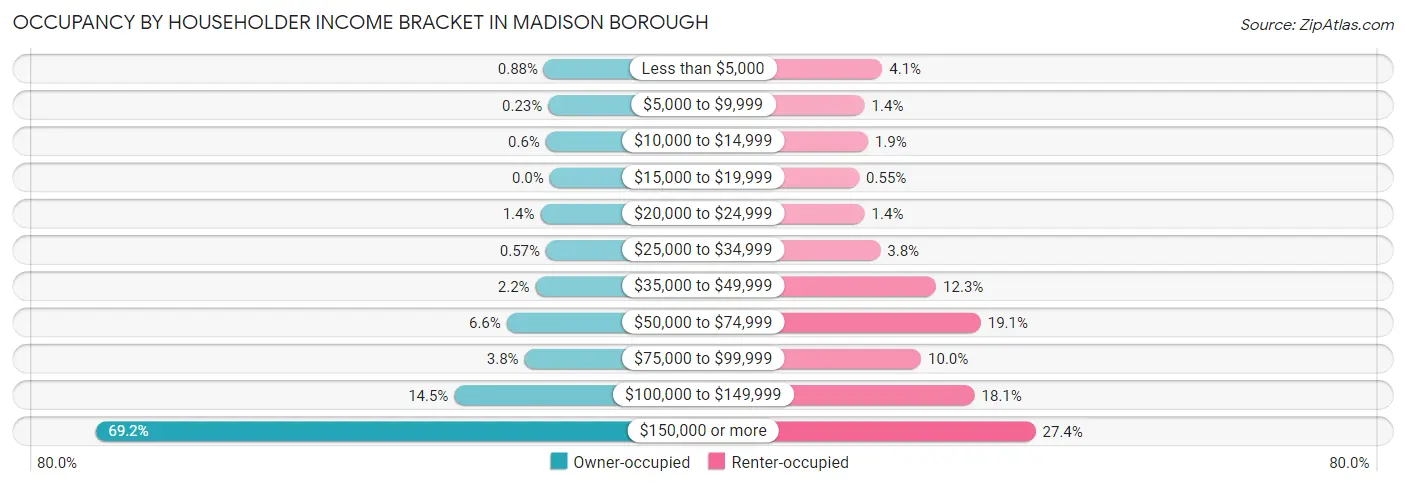
| Income Bracket | Owner-occupied | Renter-occupied |
| Less than $5,000 | 31 (0.9%) | 82 (4.1%) |
| $5,000 to $9,999 | 8 (0.2%) | 28 (1.4%) |
| $10,000 to $14,999 | 21 (0.6%) | 38 (1.9%) |
| $15,000 to $19,999 | 0 (0.0%) | 11 (0.5%) |
| $20,000 to $24,999 | 50 (1.4%) | 28 (1.4%) |
| $25,000 to $34,999 | 20 (0.6%) | 76 (3.8%) |
| $35,000 to $49,999 | 76 (2.2%) | 247 (12.3%) |
| $50,000 to $74,999 | 230 (6.6%) | 384 (19.1%) |
| $75,000 to $99,999 | 135 (3.8%) | 201 (10.0%) |
| $100,000 to $149,999 | 511 (14.5%) | 365 (18.1%) |
| $150,000 or more | 2,432 (69.2%) | 552 (27.4%) |
| Total | 3,514 (100.0%) | 2,012 (100.0%) |
Monthly Housing Cost Tiers in Madison borough
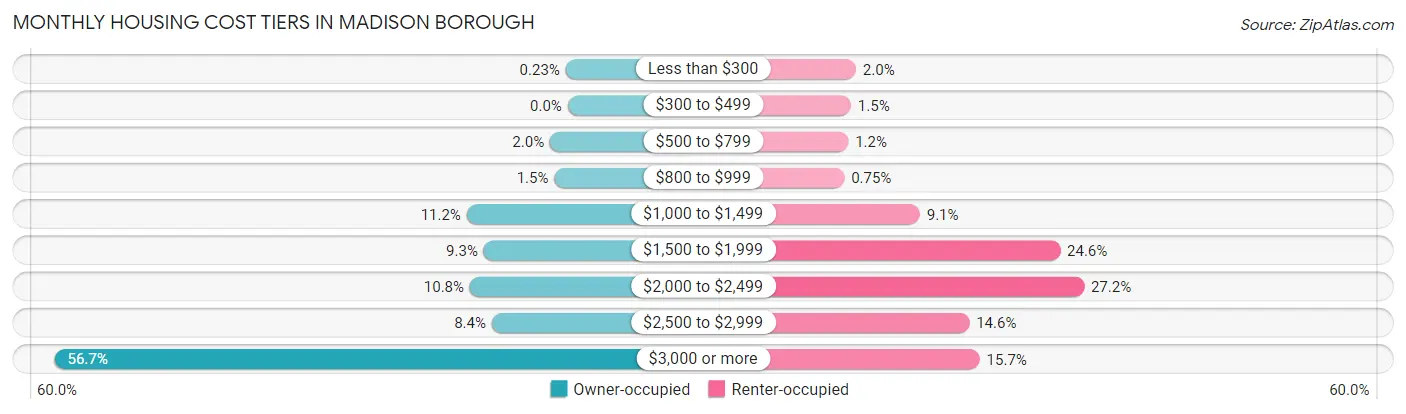
| Monthly Cost | Owner-occupied | Renter-occupied |
| Less than $300 | 8 (0.2%) | 41 (2.0%) |
| $300 to $499 | 0 (0.0%) | 30 (1.5%) |
| $500 to $799 | 69 (2.0%) | 24 (1.2%) |
| $800 to $999 | 52 (1.5%) | 15 (0.7%) |
| $1,000 to $1,499 | 392 (11.2%) | 183 (9.1%) |
| $1,500 to $1,999 | 326 (9.3%) | 495 (24.6%) |
| $2,000 to $2,499 | 380 (10.8%) | 548 (27.2%) |
| $2,500 to $2,999 | 295 (8.4%) | 293 (14.6%) |
| $3,000 or more | 1,992 (56.7%) | 316 (15.7%) |
| Total | 3,514 (100.0%) | 2,012 (100.0%) |
Physical Housing Characteristics in Madison borough
Housing Structures in Madison borough
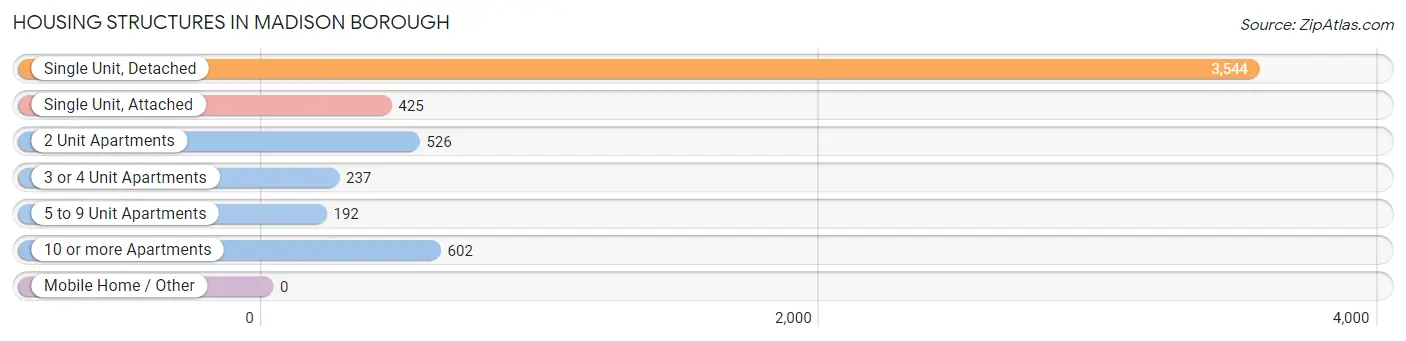
| Structure Type | # Housing Units | % Housing Units |
| Single Unit, Detached | 3,544 | 64.1% |
| Single Unit, Attached | 425 | 7.7% |
| 2 Unit Apartments | 526 | 9.5% |
| 3 or 4 Unit Apartments | 237 | 4.3% |
| 5 to 9 Unit Apartments | 192 | 3.5% |
| 10 or more Apartments | 602 | 10.9% |
| Mobile Home / Other | 0 | 0.0% |
| Total | 5,526 | 100.0% |
Housing Structures by Occupancy in Madison borough
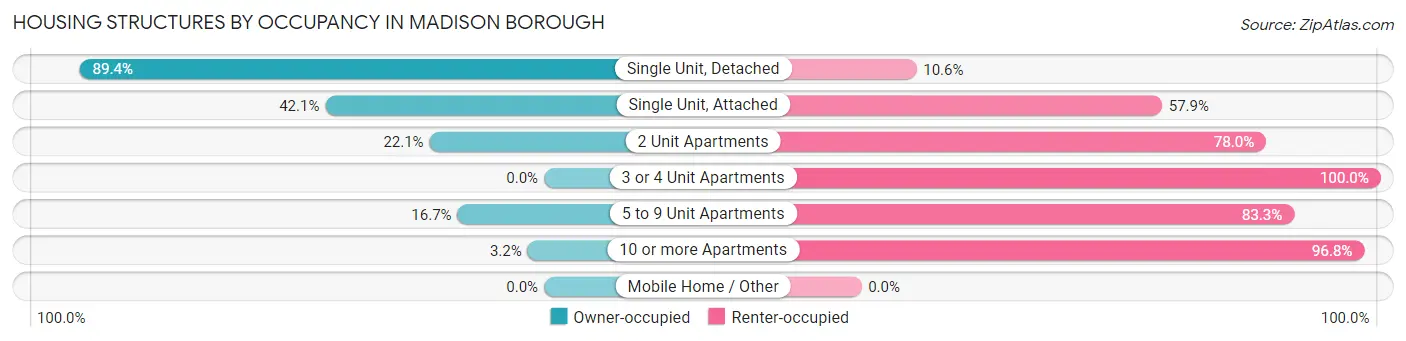
| Structure Type | Owner-occupied | Renter-occupied |
| Single Unit, Detached | 3,168 (89.4%) | 376 (10.6%) |
| Single Unit, Attached | 179 (42.1%) | 246 (57.9%) |
| 2 Unit Apartments | 116 (22.1%) | 410 (77.9%) |
| 3 or 4 Unit Apartments | 0 (0.0%) | 237 (100.0%) |
| 5 to 9 Unit Apartments | 32 (16.7%) | 160 (83.3%) |
| 10 or more Apartments | 19 (3.2%) | 583 (96.8%) |
| Mobile Home / Other | 0 (0.0%) | 0 (0.0%) |
| Total | 3,514 (63.6%) | 2,012 (36.4%) |
Housing Structures by Number of Rooms in Madison borough
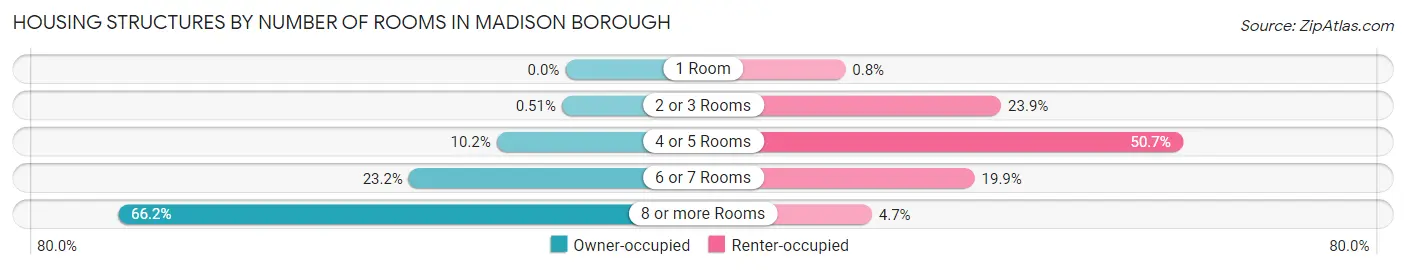
| Number of Rooms | Owner-occupied | Renter-occupied |
| 1 Room | 0 (0.0%) | 16 (0.8%) |
| 2 or 3 Rooms | 18 (0.5%) | 480 (23.9%) |
| 4 or 5 Rooms | 357 (10.2%) | 1,020 (50.7%) |
| 6 or 7 Rooms | 814 (23.2%) | 401 (19.9%) |
| 8 or more Rooms | 2,325 (66.2%) | 95 (4.7%) |
| Total | 3,514 (100.0%) | 2,012 (100.0%) |
Housing Structure by Heating Type in Madison borough
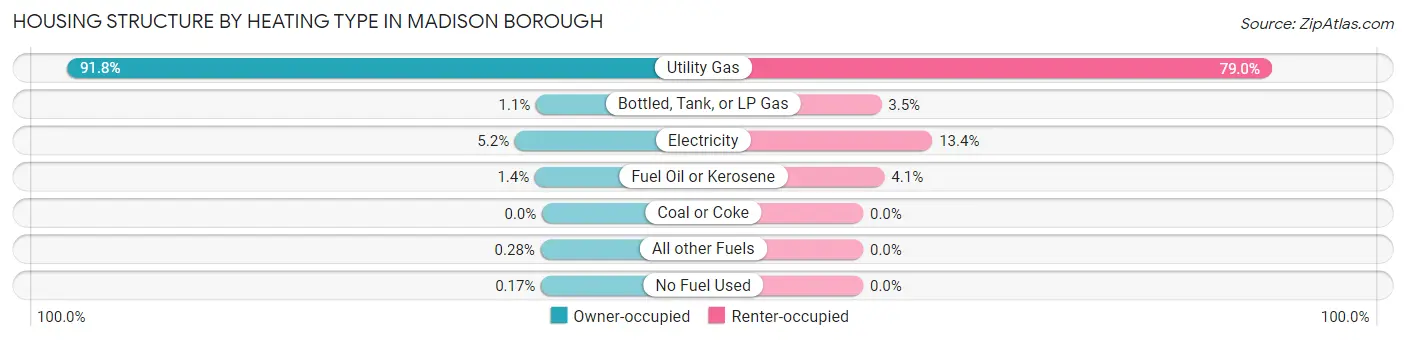
| Heating Type | Owner-occupied | Renter-occupied |
| Utility Gas | 3,226 (91.8%) | 1,589 (79.0%) |
| Bottled, Tank, or LP Gas | 40 (1.1%) | 71 (3.5%) |
| Electricity | 184 (5.2%) | 269 (13.4%) |
| Fuel Oil or Kerosene | 48 (1.4%) | 83 (4.1%) |
| Coal or Coke | 0 (0.0%) | 0 (0.0%) |
| All other Fuels | 10 (0.3%) | 0 (0.0%) |
| No Fuel Used | 6 (0.2%) | 0 (0.0%) |
| Total | 3,514 (100.0%) | 2,012 (100.0%) |
Household Vehicle Usage in Madison borough
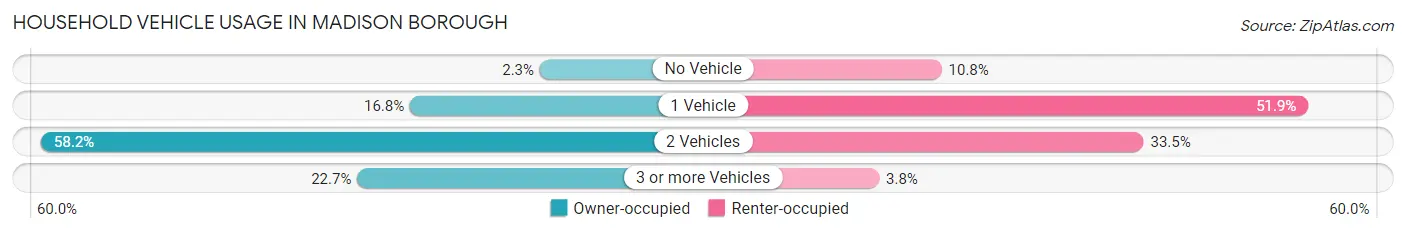
| Vehicles per Household | Owner-occupied | Renter-occupied |
| No Vehicle | 80 (2.3%) | 218 (10.8%) |
| 1 Vehicle | 591 (16.8%) | 1,044 (51.9%) |
| 2 Vehicles | 2,044 (58.2%) | 673 (33.5%) |
| 3 or more Vehicles | 799 (22.7%) | 77 (3.8%) |
| Total | 3,514 (100.0%) | 2,012 (100.0%) |
Real Estate & Mortgages in Madison borough
Real Estate and Mortgage Overview in Madison borough
| Characteristic | Without Mortgage | With Mortgage |
| Housing Units | 1,073 | 2,441 |
| Median Property Value | $790,000 | $865,700 |
| Median Household Income | $164,844 | $1,868 |
| Monthly Housing Costs | $1,501 | $1,909 |
| Real Estate Taxes | $10,001 | $34 |
Property Value by Mortgage Status in Madison borough
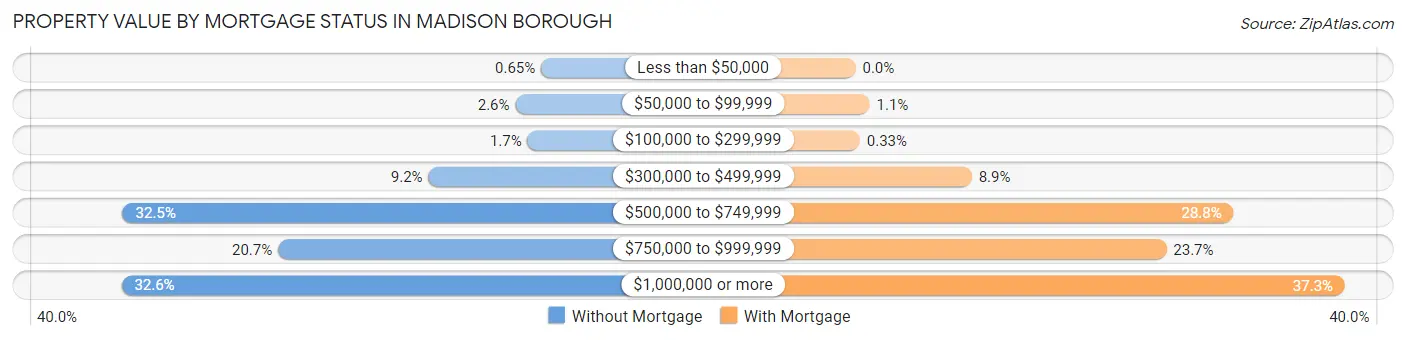
| Property Value | Without Mortgage | With Mortgage |
| Less than $50,000 | 7 (0.6%) | 0 (0.0%) |
| $50,000 to $99,999 | 28 (2.6%) | 26 (1.1%) |
| $100,000 to $299,999 | 18 (1.7%) | 8 (0.3%) |
| $300,000 to $499,999 | 99 (9.2%) | 216 (8.8%) |
| $500,000 to $749,999 | 349 (32.5%) | 703 (28.8%) |
| $750,000 to $999,999 | 222 (20.7%) | 578 (23.7%) |
| $1,000,000 or more | 350 (32.6%) | 910 (37.3%) |
| Total | 1,073 (100.0%) | 2,441 (100.0%) |
Household Income by Mortgage Status in Madison borough
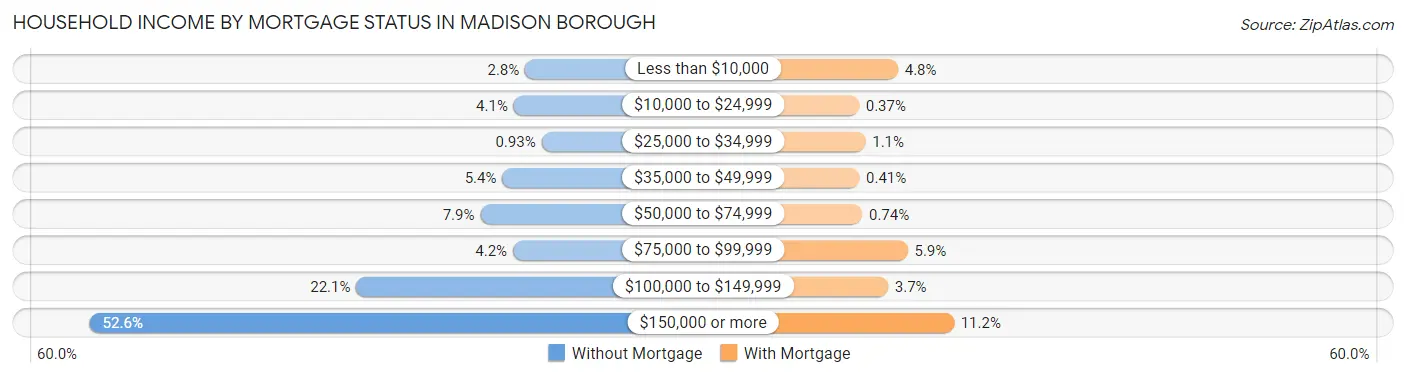
| Household Income | Without Mortgage | With Mortgage |
| Less than $10,000 | 30 (2.8%) | 118 (4.8%) |
| $10,000 to $24,999 | 44 (4.1%) | 9 (0.4%) |
| $25,000 to $34,999 | 10 (0.9%) | 27 (1.1%) |
| $35,000 to $49,999 | 58 (5.4%) | 10 (0.4%) |
| $50,000 to $74,999 | 85 (7.9%) | 18 (0.7%) |
| $75,000 to $99,999 | 45 (4.2%) | 145 (5.9%) |
| $100,000 to $149,999 | 237 (22.1%) | 90 (3.7%) |
| $150,000 or more | 564 (52.6%) | 274 (11.2%) |
| Total | 1,073 (100.0%) | 2,441 (100.0%) |
Property Value to Household Income Ratio in Madison borough
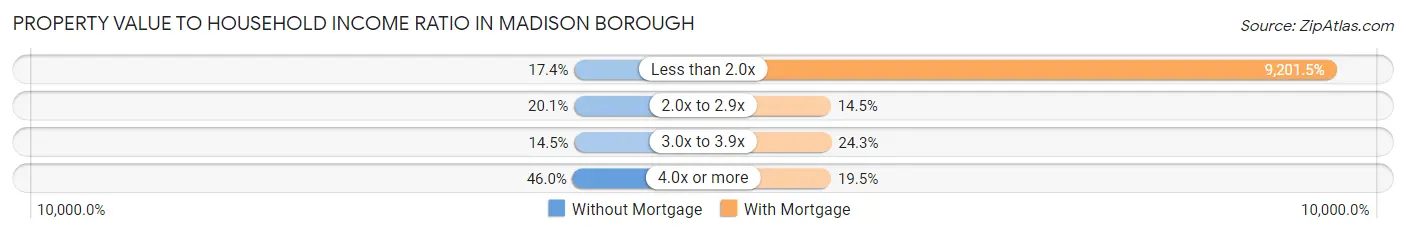
| Value-to-Income Ratio | Without Mortgage | With Mortgage |
| Less than 2.0x | 187 (17.4%) | 224,609 (9,201.5%) |
| 2.0x to 2.9x | 216 (20.1%) | 355 (14.5%) |
| 3.0x to 3.9x | 155 (14.4%) | 592 (24.2%) |
| 4.0x or more | 493 (46.0%) | 475 (19.5%) |
| Total | 1,073 (100.0%) | 2,441 (100.0%) |
Real Estate Taxes by Mortgage Status in Madison borough
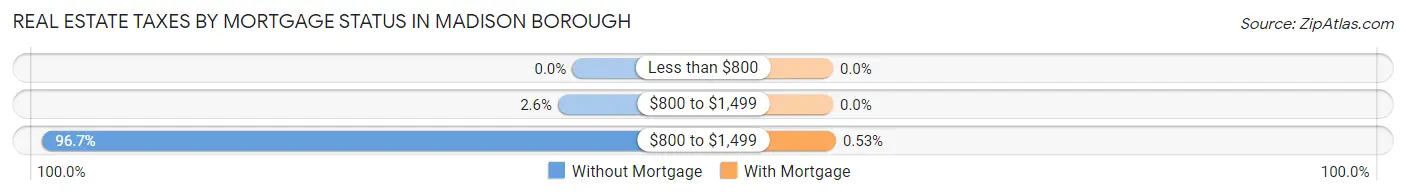
| Property Taxes | Without Mortgage | With Mortgage |
| Less than $800 | 0 (0.0%) | 0 (0.0%) |
| $800 to $1,499 | 28 (2.6%) | 0 (0.0%) |
| $800 to $1,499 | 1,038 (96.7%) | 13 (0.5%) |
| Total | 1,073 (100.0%) | 2,441 (100.0%) |
Health & Disability in Madison borough
Health Insurance Coverage by Age in Madison borough
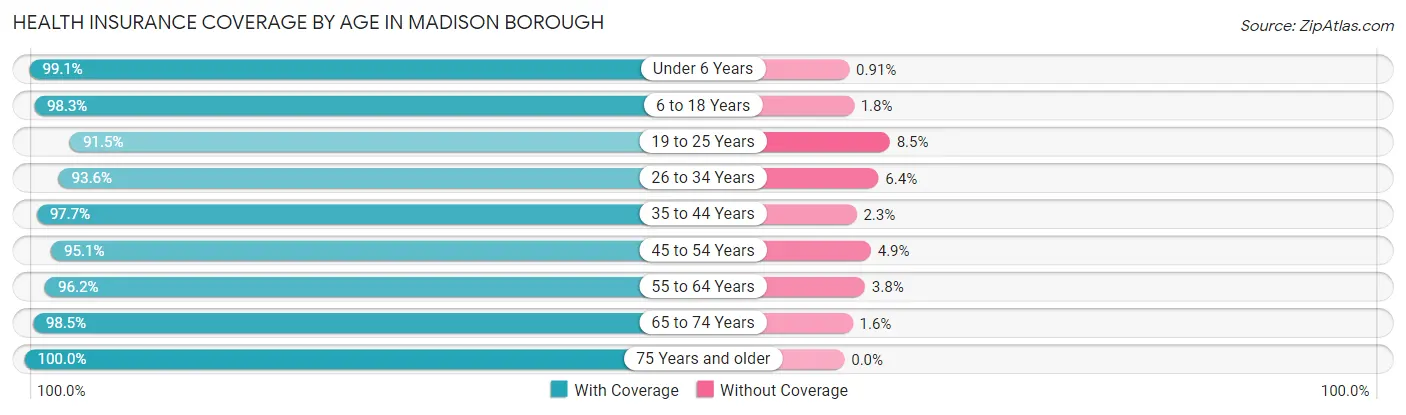
| Age Bracket | With Coverage | Without Coverage |
| Under 6 Years | 1,086 (99.1%) | 10 (0.9%) |
| 6 to 18 Years | 2,974 (98.3%) | 53 (1.8%) |
| 19 to 25 Years | 1,880 (91.5%) | 174 (8.5%) |
| 26 to 34 Years | 1,473 (93.6%) | 100 (6.4%) |
| 35 to 44 Years | 1,806 (97.7%) | 42 (2.3%) |
| 45 to 54 Years | 2,214 (95.1%) | 115 (4.9%) |
| 55 to 64 Years | 2,227 (96.2%) | 89 (3.8%) |
| 65 to 74 Years | 1,208 (98.5%) | 19 (1.5%) |
| 75 Years and older | 890 (100.0%) | 0 (0.0%) |
| Total | 15,758 (96.3%) | 602 (3.7%) |
Health Insurance Coverage by Citizenship Status in Madison borough
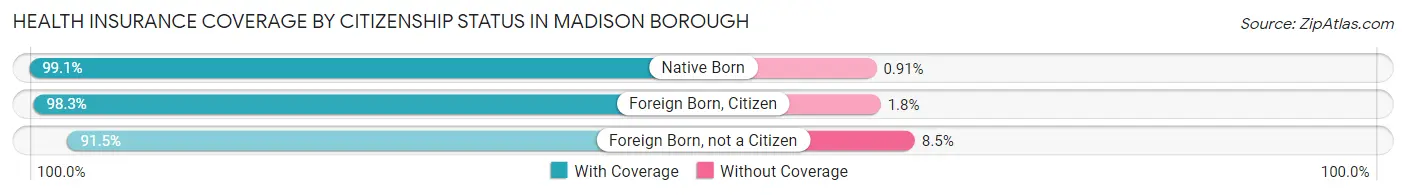
| Citizenship Status | With Coverage | Without Coverage |
| Native Born | 1,086 (99.1%) | 10 (0.9%) |
| Foreign Born, Citizen | 2,974 (98.3%) | 53 (1.8%) |
| Foreign Born, not a Citizen | 1,880 (91.5%) | 174 (8.5%) |
Health Insurance Coverage by Household Income in Madison borough
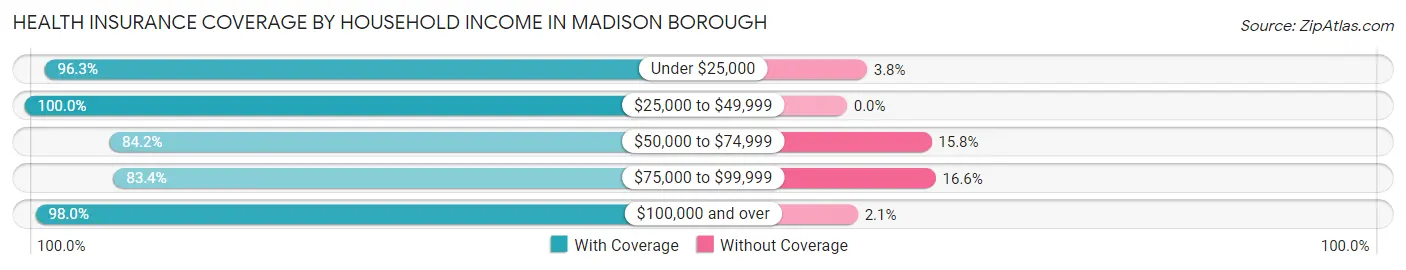
| Household Income | With Coverage | Without Coverage |
| Under $25,000 | 385 (96.3%) | 15 (3.7%) |
| $25,000 to $49,999 | 574 (100.0%) | 0 (0.0%) |
| $50,000 to $74,999 | 1,020 (84.2%) | 192 (15.8%) |
| $75,000 to $99,999 | 616 (83.4%) | 123 (16.6%) |
| $100,000 and over | 11,825 (98.0%) | 248 (2.1%) |
Public vs Private Health Insurance Coverage by Age in Madison borough
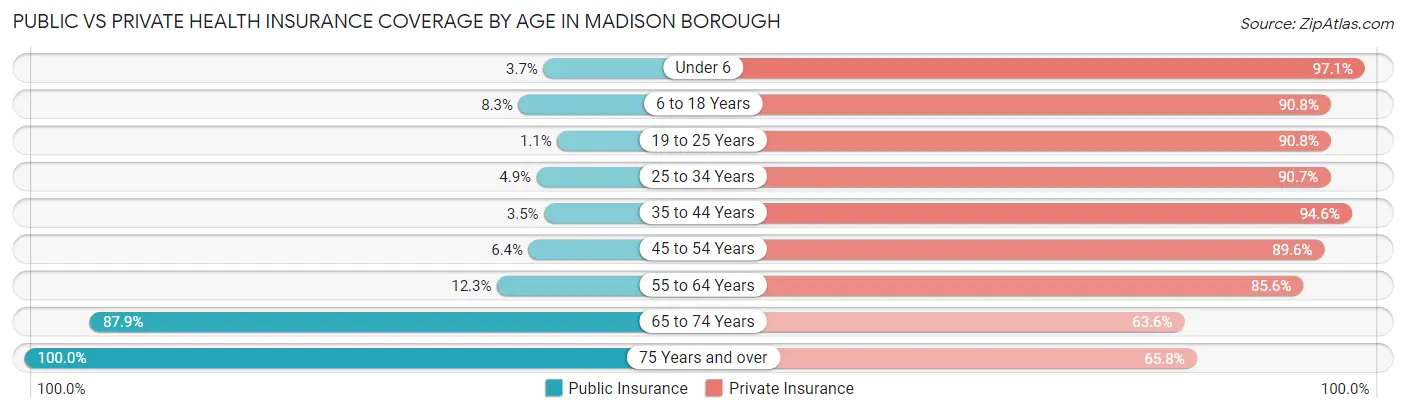
| Age Bracket | Public Insurance | Private Insurance |
| Under 6 | 40 (3.6%) | 1,064 (97.1%) |
| 6 to 18 Years | 250 (8.3%) | 2,747 (90.7%) |
| 19 to 25 Years | 22 (1.1%) | 1,864 (90.7%) |
| 25 to 34 Years | 77 (4.9%) | 1,426 (90.6%) |
| 35 to 44 Years | 65 (3.5%) | 1,749 (94.6%) |
| 45 to 54 Years | 149 (6.4%) | 2,086 (89.6%) |
| 55 to 64 Years | 284 (12.3%) | 1,983 (85.6%) |
| 65 to 74 Years | 1,078 (87.9%) | 780 (63.6%) |
| 75 Years and over | 890 (100.0%) | 586 (65.8%) |
| Total | 2,855 (17.4%) | 14,285 (87.3%) |
Disability Status by Sex by Age in Madison borough
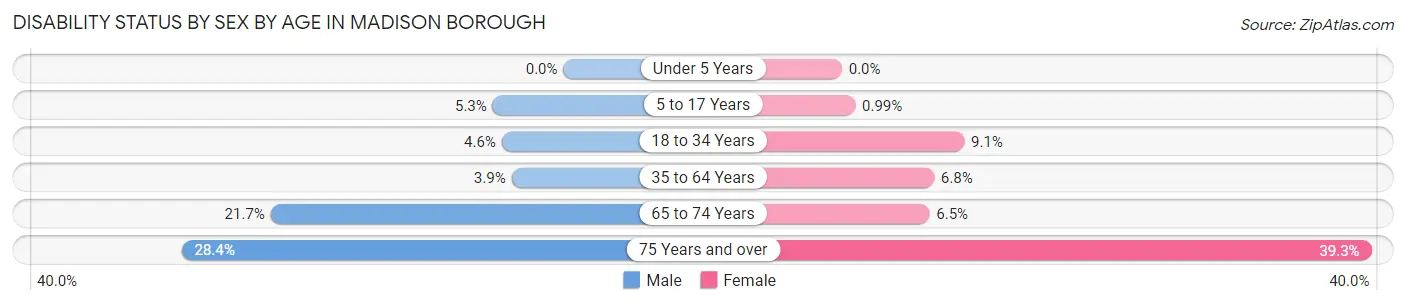
| Age Bracket | Male | Female |
| Under 5 Years | 0 (0.0%) | 0 (0.0%) |
| 5 to 17 Years | 80 (5.2%) | 13 (1.0%) |
| 18 to 34 Years | 90 (4.6%) | 187 (9.1%) |
| 35 to 64 Years | 121 (3.8%) | 229 (6.8%) |
| 65 to 74 Years | 133 (21.7%) | 40 (6.5%) |
| 75 Years and over | 93 (28.3%) | 221 (39.3%) |
Disability Class by Sex by Age in Madison borough
Disability Class: Hearing Difficulty
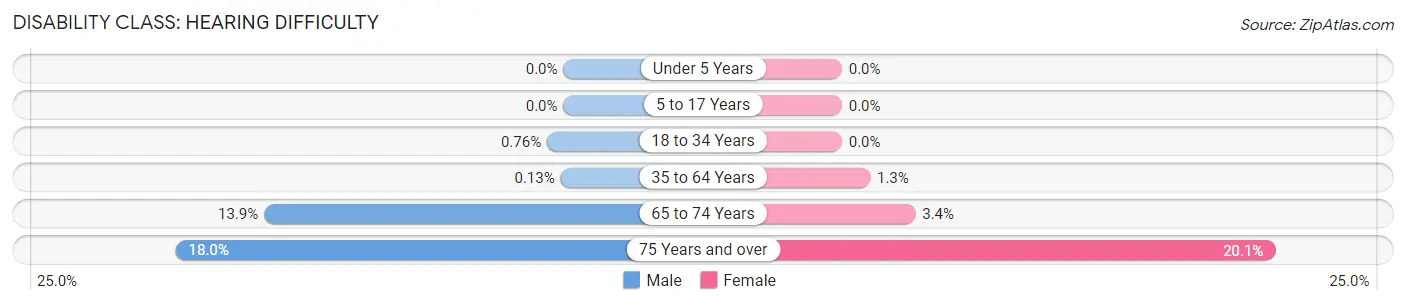
| Age Bracket | Male | Female |
| Under 5 Years | 0 (0.0%) | 0 (0.0%) |
| 5 to 17 Years | 0 (0.0%) | 0 (0.0%) |
| 18 to 34 Years | 15 (0.8%) | 0 (0.0%) |
| 35 to 64 Years | 4 (0.1%) | 44 (1.3%) |
| 65 to 74 Years | 85 (13.9%) | 21 (3.4%) |
| 75 Years and over | 59 (18.0%) | 113 (20.1%) |
Disability Class: Vision Difficulty
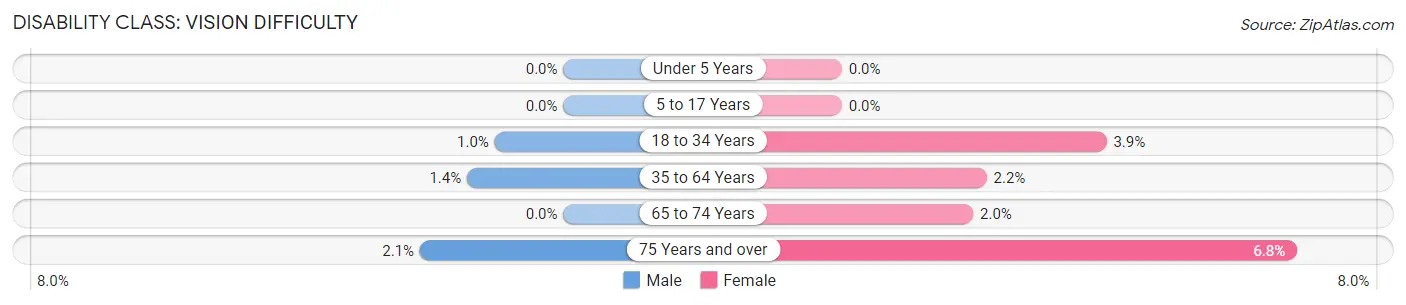
| Age Bracket | Male | Female |
| Under 5 Years | 0 (0.0%) | 0 (0.0%) |
| 5 to 17 Years | 0 (0.0%) | 0 (0.0%) |
| 18 to 34 Years | 20 (1.0%) | 81 (3.9%) |
| 35 to 64 Years | 45 (1.4%) | 72 (2.1%) |
| 65 to 74 Years | 0 (0.0%) | 12 (1.9%) |
| 75 Years and over | 7 (2.1%) | 38 (6.8%) |
Disability Class: Cognitive Difficulty
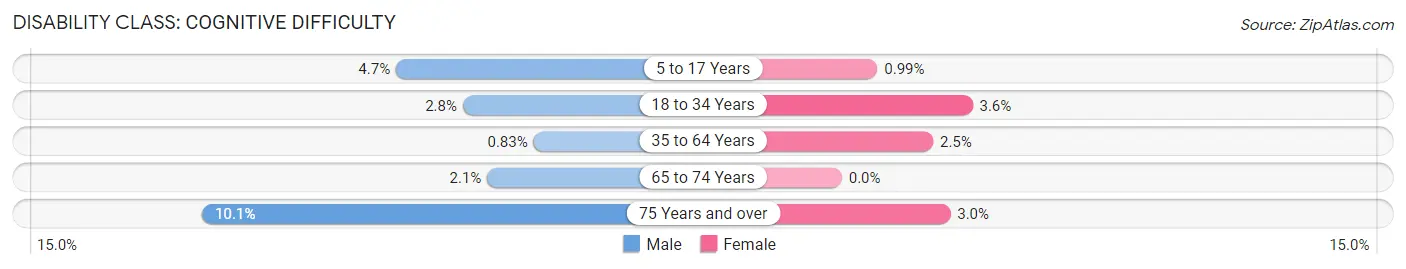
| Age Bracket | Male | Female |
| 5 to 17 Years | 71 (4.7%) | 13 (1.0%) |
| 18 to 34 Years | 55 (2.8%) | 75 (3.6%) |
| 35 to 64 Years | 26 (0.8%) | 85 (2.5%) |
| 65 to 74 Years | 13 (2.1%) | 0 (0.0%) |
| 75 Years and over | 33 (10.1%) | 17 (3.0%) |
Disability Class: Ambulatory Difficulty
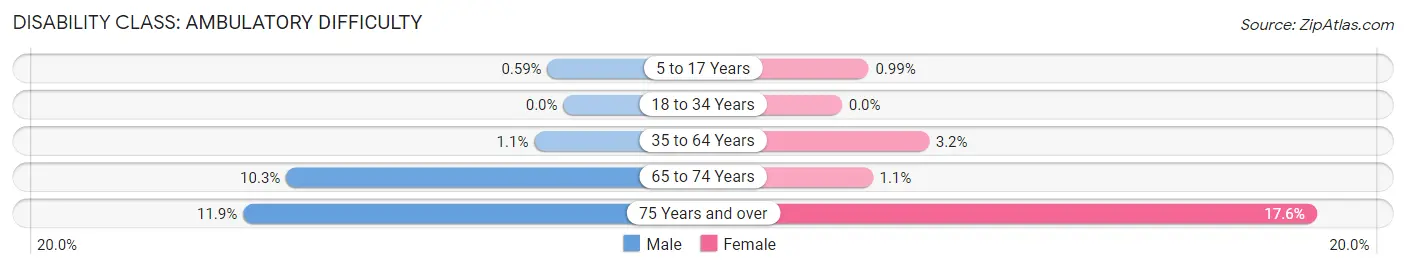
| Age Bracket | Male | Female |
| 5 to 17 Years | 9 (0.6%) | 13 (1.0%) |
| 18 to 34 Years | 0 (0.0%) | 0 (0.0%) |
| 35 to 64 Years | 34 (1.1%) | 108 (3.2%) |
| 65 to 74 Years | 63 (10.3%) | 7 (1.1%) |
| 75 Years and over | 39 (11.9%) | 99 (17.6%) |
Disability Class: Self-Care Difficulty
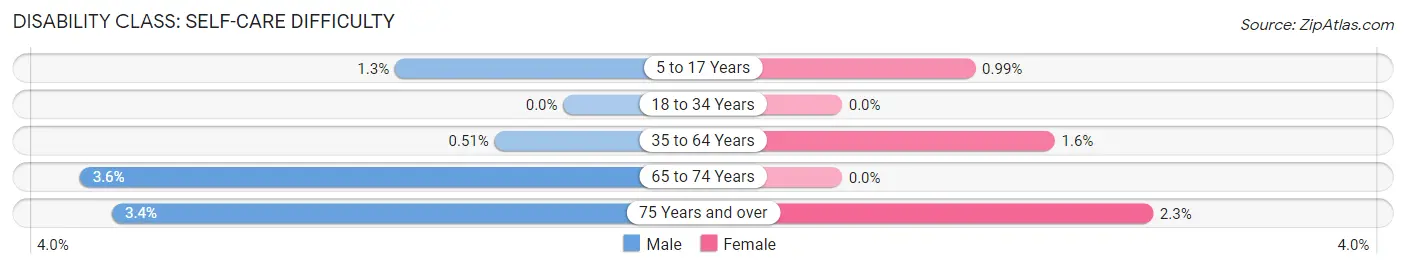
| Age Bracket | Male | Female |
| 5 to 17 Years | 19 (1.3%) | 13 (1.0%) |
| 18 to 34 Years | 0 (0.0%) | 0 (0.0%) |
| 35 to 64 Years | 16 (0.5%) | 53 (1.6%) |
| 65 to 74 Years | 22 (3.6%) | 0 (0.0%) |
| 75 Years and over | 11 (3.4%) | 13 (2.3%) |
Technology Access in Madison borough
Computing Device Access in Madison borough
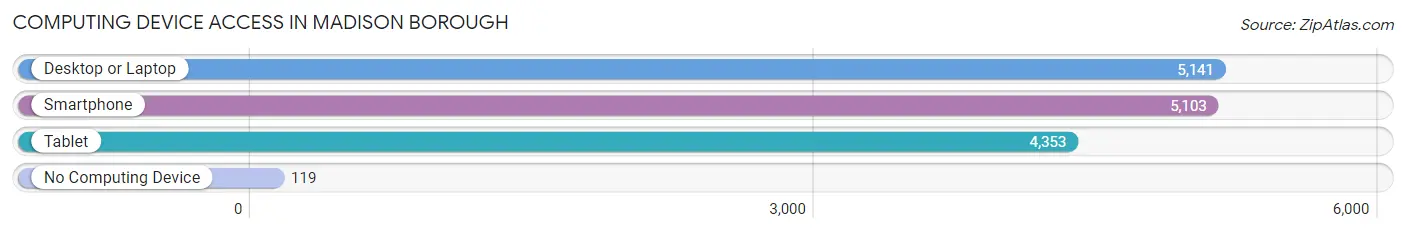
| Device Type | # Households | % Households |
| Desktop or Laptop | 5,141 | 93.0% |
| Smartphone | 5,103 | 92.3% |
| Tablet | 4,353 | 78.8% |
| No Computing Device | 119 | 2.1% |
| Total | 5,526 | 100.0% |
Internet Access in Madison borough
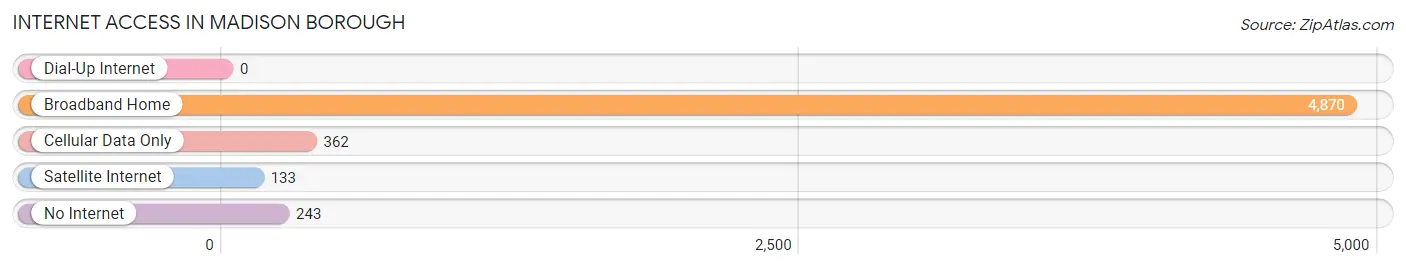
| Internet Type | # Households | % Households |
| Dial-Up Internet | 0 | 0.0% |
| Broadband Home | 4,870 | 88.1% |
| Cellular Data Only | 362 | 6.6% |
| Satellite Internet | 133 | 2.4% |
| No Internet | 243 | 4.4% |
| Total | 5,526 | 100.0% |
Madison borough Summary
Introduction
The Borough of Madison is a small town located in Morris County, New Jersey. It is situated in the heart of the state, just a few miles from the New York City border. The borough is home to a population of 15,845 people, according to the 2010 census. Madison is known for its quaint downtown area, which is lined with historic buildings and shops. The borough is also home to a number of parks and recreational areas, making it a great place to live and visit.
History
The area that is now Madison was first settled in the late 17th century by Dutch and English settlers. The town was originally known as Bottle Hill, and was part of the larger Morris Township. In 1834, the town was officially incorporated as the Borough of Madison. The town was named after James Madison, the fourth President of the United States.
In the late 19th century, Madison began to experience a period of growth and development. The town was home to a number of factories and businesses, and the population began to grow. The town was also home to a number of prominent citizens, including the inventor of the telephone, Alexander Graham Bell.
Geography
Madison is located in the heart of Morris County, New Jersey. The borough is situated between the cities of Morristown and Summit. The borough is bordered by the Passaic River to the east, and the Great Swamp National Wildlife Refuge to the west. The borough is also home to a number of parks and recreational areas, including Loantaka Brook Reservation and Madison Community Park.
The borough has a total area of 4.2 square miles, of which 0.1 square miles is water. The borough is located at an elevation of approximately 500 feet above sea level.
Economy
The economy of Madison is largely based on the service industry. The borough is home to a number of restaurants, retail stores, and other businesses. The borough is also home to a number of corporate offices, including those of AT&T, Verizon, and Prudential Financial.
The borough is also home to a number of educational institutions, including Drew University and Fairleigh Dickinson University. The borough is also home to a number of medical facilities, including Morristown Medical Center and Overlook Medical Center.
Demographics
According to the 2010 census, the population of Madison was 15,845. The racial makeup of the borough was 87.3% White, 5.2% African American, 0.3% Native American, 4.2% Asian, and 2.9% from other races. The median household income was $90,837, and the median family income was $106,837.
Conclusion
Madison is a small borough located in Morris County, New Jersey. The borough is home to a population of 15,845 people, and is known for its quaint downtown area and numerous parks and recreational areas. The economy of Madison is largely based on the service industry, and the borough is home to a number of corporate offices, educational institutions, and medical facilities. The racial makeup of the borough is 87.3% White, 5.2% African American, 0.3% Native American, 4.2% Asian, and 2.9% from other races. The median household income was $90,837, and the median family income was $106,837.
Common Questions
What is Per Capita Income in Madison borough?
Per Capita income in Madison borough is $82,074.
What is the Median Family Income in Madison borough?
Median Family Income in Madison borough is $201,689.
What is the Median Household income in Madison borough?
Median Household Income in Madison borough is $163,567.
What is Income or Wage Gap in Madison borough?
Income or Wage Gap in Madison borough is 56.6%.
Women in Madison borough earn 43.4 cents for every dollar earned by a man.
What is Inequality or Gini Index in Madison borough?
Inequality or Gini Index in Madison borough is 0.49.
What is the Total Population of Madison borough?
Total Population of Madison borough is 16,521.
What is the Total Male Population of Madison borough?
Total Male Population of Madison borough is 8,114.
What is the Total Female Population of Madison borough?
Total Female Population of Madison borough is 8,407.
What is the Ratio of Males per 100 Females in Madison borough?
There are 96.51 Males per 100 Females in Madison borough.
What is the Ratio of Females per 100 Males in Madison borough?
There are 103.61 Females per 100 Males in Madison borough.
What is the Median Population Age in Madison borough?
Median Population Age in Madison borough is 38.6 Years.
What is the Average Family Size in Madison borough
Average Family Size in Madison borough is 3.3 People.
What is the Average Household Size in Madison borough
Average Household Size in Madison borough is 2.7 People.
How Large is the Labor Force in Madison borough?
There are 9,202 People in the Labor Forcein in Madison borough.
What is the Percentage of People in the Labor Force in Madison borough?
69.7% of People are in the Labor Force in Madison borough.
What is the Unemployment Rate in Madison borough?
Unemployment Rate in Madison borough is 6.9%.