Cities with the Most Immigrants from Cuba in New Jersey
RELATED REPORTS & OPTIONS
Cuba
New Jersey
Compare Cities
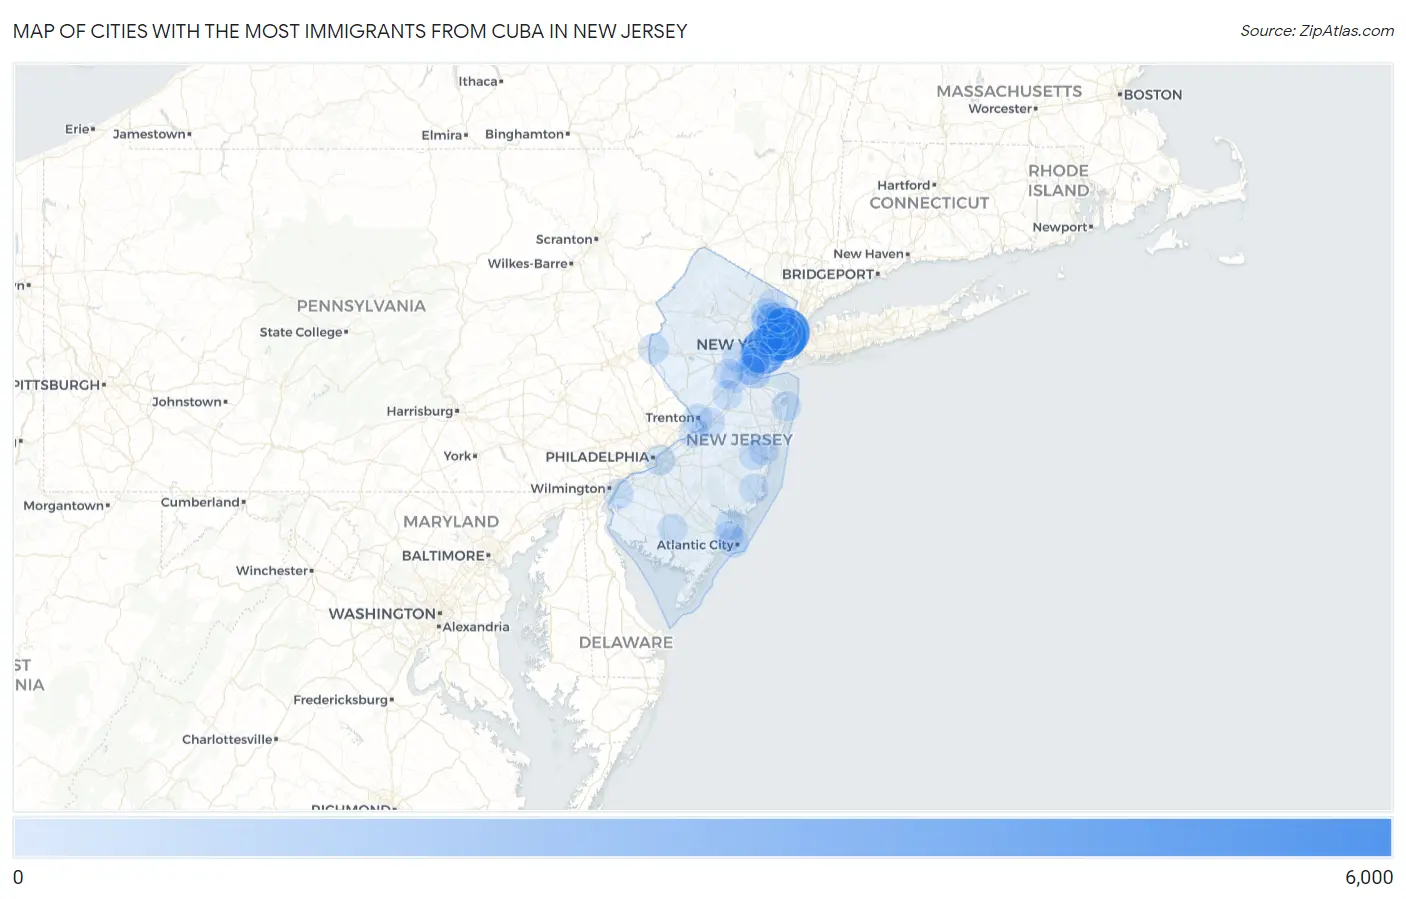
Map of Cities with the Most Immigrants from Cuba in New Jersey
0
6,000
Cities with the Most Immigrants from Cuba in New Jersey
| City | Cuba | vs State | vs National | |
| 1. | West New York | 5,290 | 45,435(11.64%)#1 | 1,325,277(0.40%)#41 |
| 2. | Union City | 5,044 | 45,435(11.10%)#2 | 1,325,277(0.38%)#42 |
| 3. | Elizabeth | 4,127 | 45,435(9.08%)#3 | 1,325,277(0.31%)#51 |
| 4. | Jersey City | 1,671 | 45,435(3.68%)#4 | 1,325,277(0.13%)#99 |
| 5. | Newark | 948 | 45,435(2.09%)#5 | 1,325,277(0.07%)#153 |
| 6. | Clifton | 829 | 45,435(1.82%)#6 | 1,325,277(0.06%)#160 |
| 7. | Guttenberg | 781 | 45,435(1.72%)#7 | 1,325,277(0.06%)#166 |
| 8. | Kearny | 629 | 45,435(1.38%)#8 | 1,325,277(0.05%)#194 |
| 9. | Perth Amboy | 602 | 45,435(1.32%)#9 | 1,325,277(0.05%)#200 |
| 10. | Garfield | 548 | 45,435(1.21%)#10 | 1,325,277(0.04%)#207 |
| 11. | Fairview Borough | 474 | 45,435(1.04%)#11 | 1,325,277(0.04%)#226 |
| 12. | Cliffside Park Borough | 473 | 45,435(1.04%)#12 | 1,325,277(0.04%)#228 |
| 13. | Roselle Borough | 422 | 45,435(0.93%)#13 | 1,325,277(0.03%)#245 |
| 14. | Rahway | 364 | 45,435(0.80%)#14 | 1,325,277(0.03%)#263 |
| 15. | Bayonne | 286 | 45,435(0.63%)#15 | 1,325,277(0.02%)#311 |
| 16. | Paterson | 281 | 45,435(0.62%)#16 | 1,325,277(0.02%)#316 |
| 17. | Bergenfield Borough | 274 | 45,435(0.60%)#17 | 1,325,277(0.02%)#326 |
| 18. | Secaucus | 264 | 45,435(0.58%)#18 | 1,325,277(0.02%)#336 |
| 19. | Passaic | 255 | 45,435(0.56%)#19 | 1,325,277(0.02%)#349 |
| 20. | Ridgefield Park | 242 | 45,435(0.53%)#20 | 1,325,277(0.02%)#369 |
| 21. | Camden | 240 | 45,435(0.53%)#21 | 1,325,277(0.02%)#372 |
| 22. | Hoboken | 233 | 45,435(0.51%)#22 | 1,325,277(0.02%)#383 |
| 23. | North Arlington Borough | 229 | 45,435(0.50%)#23 | 1,325,277(0.02%)#388 |
| 24. | Fort Lee Borough | 227 | 45,435(0.50%)#24 | 1,325,277(0.02%)#390 |
| 25. | Dumont Borough | 222 | 45,435(0.49%)#25 | 1,325,277(0.02%)#395 |
| 26. | Linden | 217 | 45,435(0.48%)#26 | 1,325,277(0.02%)#403 |
| 27. | Harrison | 211 | 45,435(0.46%)#27 | 1,325,277(0.02%)#411 |
| 28. | Hackensack | 206 | 45,435(0.45%)#28 | 1,325,277(0.02%)#419 |
| 29. | Haledon Borough | 200 | 45,435(0.44%)#29 | 1,325,277(0.02%)#433 |
| 30. | Rutherford Borough | 183 | 45,435(0.40%)#30 | 1,325,277(0.01%)#458 |
| 31. | Carteret Borough | 176 | 45,435(0.39%)#31 | 1,325,277(0.01%)#466 |
| 32. | Pompton Lakes Borough | 169 | 45,435(0.37%)#32 | 1,325,277(0.01%)#480 |
| 33. | Fair Lawn Borough | 155 | 45,435(0.34%)#33 | 1,325,277(0.01%)#512 |
| 34. | Parsippany | 153 | 45,435(0.34%)#34 | 1,325,277(0.01%)#516 |
| 35. | Upper Pohatcong | 145 | 45,435(0.32%)#35 | 1,325,277(0.01%)#536 |
| 36. | Toms River | 140 | 45,435(0.31%)#36 | 1,325,277(0.01%)#546 |
| 37. | Leonia Borough | 131 | 45,435(0.29%)#37 | 1,325,277(0.01%)#574 |
| 38. | Kenilworth Borough | 130 | 45,435(0.29%)#38 | 1,325,277(0.01%)#579 |
| 39. | Hasbrouck Heights Borough | 128 | 45,435(0.28%)#39 | 1,325,277(0.01%)#585 |
| 40. | Florence | 128 | 45,435(0.28%)#40 | 1,325,277(0.01%)#587 |
| 41. | Elmwood Park Borough | 124 | 45,435(0.27%)#41 | 1,325,277(0.01%)#602 |
| 42. | Holiday City Berkeley | 123 | 45,435(0.27%)#42 | 1,325,277(0.01%)#608 |
| 43. | Ridgefield Borough | 122 | 45,435(0.27%)#43 | 1,325,277(0.01%)#613 |
| 44. | Atlantic City | 113 | 45,435(0.25%)#44 | 1,325,277(0.01%)#651 |
| 45. | New Brunswick | 111 | 45,435(0.24%)#45 | 1,325,277(0.01%)#661 |
| 46. | Edgewater Borough | 108 | 45,435(0.24%)#46 | 1,325,277(0.01%)#671 |
| 47. | Little Ferry Borough | 106 | 45,435(0.23%)#47 | 1,325,277(0.01%)#680 |
| 48. | Hopatcong Borough | 105 | 45,435(0.23%)#48 | 1,325,277(0.01%)#683 |
| 49. | Long Branch | 103 | 45,435(0.23%)#49 | 1,325,277(0.01%)#691 |
| 50. | Tinton Falls Borough | 100 | 45,435(0.22%)#50 | 1,325,277(0.01%)#706 |
| 51. | Paramus Borough | 99 | 45,435(0.22%)#51 | 1,325,277(0.01%)#709 |
| 52. | Wanaque Borough | 99 | 45,435(0.22%)#52 | 1,325,277(0.01%)#710 |
| 53. | Ramsey Borough | 98 | 45,435(0.22%)#53 | 1,325,277(0.01%)#716 |
| 54. | Cresskill Borough | 98 | 45,435(0.22%)#54 | 1,325,277(0.01%)#717 |
| 55. | Upper Saddle River Borough | 93 | 45,435(0.20%)#55 | 1,325,277(0.01%)#751 |
| 56. | Bloomingdale Borough | 93 | 45,435(0.20%)#56 | 1,325,277(0.01%)#752 |
| 57. | Smithville | 92 | 45,435(0.20%)#57 | 1,325,277(0.01%)#755 |
| 58. | Tenafly Borough | 89 | 45,435(0.20%)#58 | 1,325,277(0.01%)#773 |
| 59. | River Edge Borough | 87 | 45,435(0.19%)#59 | 1,325,277(0.01%)#786 |
| 60. | Hawthorne Borough | 85 | 45,435(0.19%)#60 | 1,325,277(0.01%)#793 |
| 61. | East Newark Borough | 84 | 45,435(0.18%)#61 | 1,325,277(0.01%)#808 |
| 62. | Trenton | 81 | 45,435(0.18%)#62 | 1,325,277(0.01%)#820 |
| 63. | Wood Ridge Borough | 80 | 45,435(0.18%)#63 | 1,325,277(0.01%)#835 |
| 64. | Avenel | 79 | 45,435(0.17%)#64 | 1,325,277(0.01%)#841 |
| 65. | Ridgewood | 74 | 45,435(0.16%)#65 | 1,325,277(0.01%)#874 |
| 66. | Watchung Borough | 74 | 45,435(0.16%)#66 | 1,325,277(0.01%)#878 |
| 67. | Yardville | 73 | 45,435(0.16%)#67 | 1,325,277(0.01%)#891 |
| 68. | Oakland Borough | 70 | 45,435(0.15%)#68 | 1,325,277(0.01%)#920 |
| 69. | Preakness | 69 | 45,435(0.15%)#69 | 1,325,277(0.01%)#929 |
| 70. | Fords | 68 | 45,435(0.15%)#70 | 1,325,277(0.01%)#938 |
| 71. | Plainfield | 67 | 45,435(0.15%)#71 | 1,325,277(0.01%)#947 |
| 72. | Palisades Park Borough | 67 | 45,435(0.15%)#72 | 1,325,277(0.01%)#952 |
| 73. | Whippany | 67 | 45,435(0.15%)#73 | 1,325,277(0.01%)#954 |
| 74. | Vineland | 66 | 45,435(0.15%)#74 | 1,325,277(0.00%)#957 |
| 75. | Absecon | 65 | 45,435(0.14%)#75 | 1,325,277(0.00%)#970 |
| 76. | Woodland Park Borough | 64 | 45,435(0.14%)#76 | 1,325,277(0.00%)#979 |
| 77. | Carneys Point | 64 | 45,435(0.14%)#77 | 1,325,277(0.00%)#980 |
| 78. | Lincoln Park Borough | 63 | 45,435(0.14%)#78 | 1,325,277(0.00%)#991 |
| 79. | Woodcliff Lake Borough | 61 | 45,435(0.13%)#79 | 1,325,277(0.00%)#1,012 |
| 80. | South Plainfield Borough | 60 | 45,435(0.13%)#80 | 1,325,277(0.00%)#1,020 |
| 81. | Moonachie Borough | 60 | 45,435(0.13%)#81 | 1,325,277(0.00%)#1,024 |
| 82. | Ocean Acres | 59 | 45,435(0.13%)#82 | 1,325,277(0.00%)#1,032 |
| 83. | Somerset | 57 | 45,435(0.13%)#83 | 1,325,277(0.00%)#1,054 |
| 84. | Roselle Park Borough | 57 | 45,435(0.13%)#84 | 1,325,277(0.00%)#1,056 |
| 85. | Franklin Lakes Borough | 57 | 45,435(0.13%)#85 | 1,325,277(0.00%)#1,057 |
| 86. | Closter Borough | 55 | 45,435(0.12%)#86 | 1,325,277(0.00%)#1,081 |
| 87. | Troy Hills | 54 | 45,435(0.12%)#87 | 1,325,277(0.00%)#1,099 |
| 88. | Union | 53 | 45,435(0.12%)#88 | 1,325,277(0.00%)#1,114 |
| 89. | Garwood Borough | 52 | 45,435(0.11%)#89 | 1,325,277(0.00%)#1,125 |
| 90. | New Milford Borough | 51 | 45,435(0.11%)#90 | 1,325,277(0.00%)#1,134 |
| 91. | Waldwick Borough | 51 | 45,435(0.11%)#91 | 1,325,277(0.00%)#1,137 |
| 92. | Fanwood Borough | 51 | 45,435(0.11%)#92 | 1,325,277(0.00%)#1,138 |
| 93. | Sayreville Borough | 49 | 45,435(0.11%)#93 | 1,325,277(0.00%)#1,158 |
| 94. | Freehold Borough | 49 | 45,435(0.11%)#94 | 1,325,277(0.00%)#1,169 |
| 95. | Pine Brook | 49 | 45,435(0.11%)#95 | 1,325,277(0.00%)#1,173 |
| 96. | Haworth Borough | 48 | 45,435(0.11%)#96 | 1,325,277(0.00%)#1,186 |
| 97. | Dayton | 47 | 45,435(0.10%)#97 | 1,325,277(0.00%)#1,202 |
| 98. | Llewellyn Park | 47 | 45,435(0.10%)#98 | 1,325,277(0.00%)#1,207 |
| 99. | Beachwood Borough | 46 | 45,435(0.10%)#99 | 1,325,277(0.00%)#1,222 |
| 100. | North Plainfield Borough | 45 | 45,435(0.10%)#100 | 1,325,277(0.00%)#1,232 |
Common Questions
What are the Top 10 Cities with the Most Immigrants from Cuba in New Jersey?
Top 10 Cities with the Most Immigrants from Cuba in New Jersey are:
#1
5,290
#2
5,044
#3
4,127
#4
1,671
#5
948
#6
829
#7
781
#8
629
#9
602
#10
548
What city has the Most Immigrants from Cuba in New Jersey?
West New York has the Most Immigrants from Cuba in New Jersey with 5,290.
What is the Total Immigrants from Cuba in the State of New Jersey?
Total Immigrants from Cuba in New Jersey is 45,435.
What is the Total Immigrants from Cuba in the United States?
Total Immigrants from Cuba in the United States is 1,325,277.