Cities with the Largest Central American Indian Community in New Jersey
RELATED REPORTS & OPTIONS
Central American Indian
New Jersey
Compare Cities
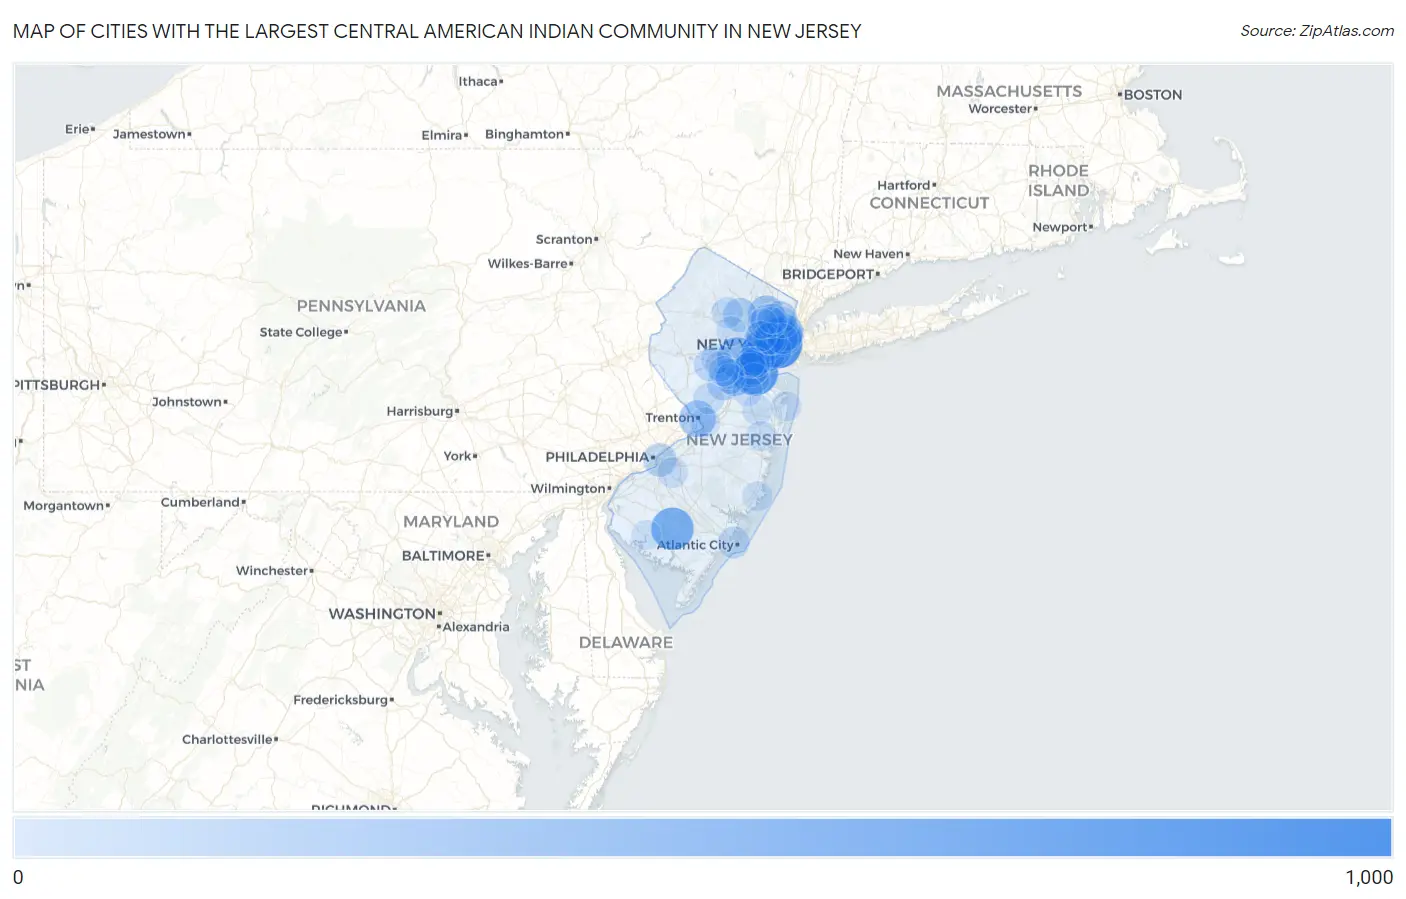
Map of Cities with the Largest Central American Indian Community in New Jersey
0
1,000
Cities with the Largest Central American Indian Community in New Jersey
| City | Central American Indian | vs State | vs National | |
| 1. | Jersey City | 918 | 16,510(5.56%)#1 | 374,148(0.25%)#32 |
| 2. | Perth Amboy | 763 | 16,510(4.62%)#2 | 374,148(0.20%)#44 |
| 3. | Elizabeth | 615 | 16,510(3.73%)#3 | 374,148(0.16%)#67 |
| 4. | Vineland | 582 | 16,510(3.53%)#4 | 374,148(0.16%)#72 |
| 5. | Newark | 559 | 16,510(3.39%)#5 | 374,148(0.15%)#76 |
| 6. | Plainfield | 493 | 16,510(2.99%)#6 | 374,148(0.13%)#97 |
| 7. | Union City | 425 | 16,510(2.57%)#7 | 374,148(0.11%)#126 |
| 8. | Middlesex Borough | 388 | 16,510(2.35%)#8 | 374,148(0.10%)#153 |
| 9. | West New York | 327 | 16,510(1.98%)#9 | 374,148(0.09%)#196 |
| 10. | Hillsborough | 326 | 16,510(1.97%)#10 | 374,148(0.09%)#197 |
| 11. | New Brunswick | 321 | 16,510(1.94%)#11 | 374,148(0.09%)#200 |
| 12. | Trenton | 316 | 16,510(1.91%)#12 | 374,148(0.08%)#204 |
| 13. | Paterson | 311 | 16,510(1.88%)#13 | 374,148(0.08%)#207 |
| 14. | North Plainfield Borough | 284 | 16,510(1.72%)#14 | 374,148(0.08%)#235 |
| 15. | Bayonne | 265 | 16,510(1.61%)#15 | 374,148(0.07%)#258 |
| 16. | Bound Brook Borough | 259 | 16,510(1.57%)#16 | 374,148(0.07%)#265 |
| 17. | Woodbridge | 233 | 16,510(1.41%)#17 | 374,148(0.06%)#306 |
| 18. | Linden | 231 | 16,510(1.40%)#18 | 374,148(0.06%)#312 |
| 19. | Fords | 228 | 16,510(1.38%)#19 | 374,148(0.06%)#318 |
| 20. | Cliffside Park Borough | 221 | 16,510(1.34%)#20 | 374,148(0.06%)#330 |
| 21. | Boonton | 189 | 16,510(1.14%)#21 | 374,148(0.05%)#384 |
| 22. | Clifton | 188 | 16,510(1.14%)#22 | 374,148(0.05%)#385 |
| 23. | Camden | 166 | 16,510(1.01%)#23 | 374,148(0.04%)#445 |
| 24. | Franklin Park | 165 | 16,510(1.00%)#24 | 374,148(0.04%)#451 |
| 25. | Hackensack | 163 | 16,510(0.99%)#25 | 374,148(0.04%)#456 |
| 26. | Caldwell Borough | 152 | 16,510(0.92%)#26 | 374,148(0.04%)#482 |
| 27. | Emerson Borough | 116 | 16,510(0.70%)#27 | 374,148(0.03%)#617 |
| 28. | Kearny | 115 | 16,510(0.70%)#28 | 374,148(0.03%)#622 |
| 29. | Bradley Gardens | 114 | 16,510(0.69%)#29 | 374,148(0.03%)#628 |
| 30. | Lindenwold Borough | 100 | 16,510(0.61%)#30 | 374,148(0.03%)#709 |
| 31. | Atlantic City | 98 | 16,510(0.59%)#31 | 374,148(0.03%)#721 |
| 32. | Sayreville Borough | 83 | 16,510(0.50%)#32 | 374,148(0.02%)#809 |
| 33. | Roselle Borough | 83 | 16,510(0.50%)#33 | 374,148(0.02%)#811 |
| 34. | Haledon Borough | 82 | 16,510(0.50%)#34 | 374,148(0.02%)#822 |
| 35. | Eatontown Borough | 81 | 16,510(0.49%)#35 | 374,148(0.02%)#833 |
| 36. | Beesleys Point | 80 | 16,510(0.48%)#36 | 374,148(0.02%)#840 |
| 37. | Harrison | 78 | 16,510(0.47%)#37 | 374,148(0.02%)#849 |
| 38. | Matawan Borough | 74 | 16,510(0.45%)#38 | 374,148(0.02%)#880 |
| 39. | White Meadow Lake | 71 | 16,510(0.43%)#39 | 374,148(0.02%)#899 |
| 40. | Bogota Borough | 71 | 16,510(0.43%)#40 | 374,148(0.02%)#900 |
| 41. | Ridgefield Park | 68 | 16,510(0.41%)#41 | 374,148(0.02%)#927 |
| 42. | Bergenfield Borough | 66 | 16,510(0.40%)#42 | 374,148(0.02%)#944 |
| 43. | South Amboy | 65 | 16,510(0.39%)#43 | 374,148(0.02%)#958 |
| 44. | Flemington Borough | 63 | 16,510(0.38%)#44 | 374,148(0.02%)#984 |
| 45. | Flanders | 58 | 16,510(0.35%)#45 | 374,148(0.02%)#1,047 |
| 46. | South Plainfield Borough | 57 | 16,510(0.35%)#46 | 374,148(0.02%)#1,059 |
| 47. | Closter Borough | 54 | 16,510(0.33%)#47 | 374,148(0.01%)#1,107 |
| 48. | Raritan Borough | 53 | 16,510(0.32%)#48 | 374,148(0.01%)#1,126 |
| 49. | Princeton | 52 | 16,510(0.31%)#49 | 374,148(0.01%)#1,135 |
| 50. | Point Pleasant Borough | 52 | 16,510(0.31%)#50 | 374,148(0.01%)#1,140 |
| 51. | Carteret Borough | 51 | 16,510(0.31%)#51 | 374,148(0.01%)#1,149 |
| 52. | Fairview Borough | 48 | 16,510(0.29%)#52 | 374,148(0.01%)#1,196 |
| 53. | Watsessing | 48 | 16,510(0.29%)#53 | 374,148(0.01%)#1,198 |
| 54. | Runnemede Borough | 47 | 16,510(0.28%)#54 | 374,148(0.01%)#1,214 |
| 55. | Parsippany | 46 | 16,510(0.28%)#55 | 374,148(0.01%)#1,228 |
| 56. | Freehold Borough | 46 | 16,510(0.28%)#56 | 374,148(0.01%)#1,232 |
| 57. | Manville Borough | 46 | 16,510(0.28%)#57 | 374,148(0.01%)#1,233 |
| 58. | Echelon | 43 | 16,510(0.26%)#58 | 374,148(0.01%)#1,279 |
| 59. | Hewitt | 43 | 16,510(0.26%)#59 | 374,148(0.01%)#1,284 |
| 60. | Hoboken | 42 | 16,510(0.25%)#60 | 374,148(0.01%)#1,286 |
| 61. | Avenel | 41 | 16,510(0.25%)#61 | 374,148(0.01%)#1,301 |
| 62. | Oak Ridge | 41 | 16,510(0.25%)#62 | 374,148(0.01%)#1,311 |
| 63. | Passaic | 40 | 16,510(0.24%)#63 | 374,148(0.01%)#1,324 |
| 64. | Prospect Park Borough | 40 | 16,510(0.24%)#64 | 374,148(0.01%)#1,344 |
| 65. | Buena Borough | 38 | 16,510(0.23%)#65 | 374,148(0.01%)#1,374 |
| 66. | Hasbrouck Heights Borough | 37 | 16,510(0.22%)#66 | 374,148(0.01%)#1,390 |
| 67. | East Freehold | 37 | 16,510(0.22%)#67 | 374,148(0.01%)#1,396 |
| 68. | Westmont | 36 | 16,510(0.22%)#68 | 374,148(0.01%)#1,412 |
| 69. | Keansburg Borough | 36 | 16,510(0.22%)#69 | 374,148(0.01%)#1,414 |
| 70. | Tinton Falls Borough | 34 | 16,510(0.21%)#70 | 374,148(0.01%)#1,455 |
| 71. | Colonia | 33 | 16,510(0.20%)#71 | 374,148(0.01%)#1,480 |
| 72. | Basking Ridge | 33 | 16,510(0.20%)#72 | 374,148(0.01%)#1,485 |
| 73. | Spotswood Borough | 30 | 16,510(0.18%)#73 | 374,148(0.01%)#1,556 |
| 74. | Green Knoll | 30 | 16,510(0.18%)#74 | 374,148(0.01%)#1,557 |
| 75. | Lakehurst Borough | 30 | 16,510(0.18%)#75 | 374,148(0.01%)#1,561 |
| 76. | Lakewood | 29 | 16,510(0.18%)#76 | 374,148(0.01%)#1,567 |
| 77. | Collingswood Borough | 29 | 16,510(0.18%)#77 | 374,148(0.01%)#1,585 |
| 78. | East Orange | 28 | 16,510(0.17%)#78 | 374,148(0.01%)#1,602 |
| 79. | Somerset | 28 | 16,510(0.17%)#79 | 374,148(0.01%)#1,614 |
| 80. | Woodland Park Borough | 27 | 16,510(0.16%)#80 | 374,148(0.01%)#1,650 |
| 81. | Westville Borough | 27 | 16,510(0.16%)#81 | 374,148(0.01%)#1,663 |
| 82. | North Arlington Borough | 25 | 16,510(0.15%)#82 | 374,148(0.01%)#1,712 |
| 83. | Upper Montclair | 25 | 16,510(0.15%)#83 | 374,148(0.01%)#1,715 |
| 84. | Clementon Borough | 25 | 16,510(0.15%)#84 | 374,148(0.01%)#1,724 |
| 85. | Old Bridge | 24 | 16,510(0.15%)#85 | 374,148(0.01%)#1,749 |
| 86. | Bargaintown | 24 | 16,510(0.15%)#86 | 374,148(0.01%)#1,760 |
| 87. | Manahawkin | 24 | 16,510(0.15%)#87 | 374,148(0.01%)#1,767 |
| 88. | Voorhees | 24 | 16,510(0.15%)#88 | 374,148(0.01%)#1,768 |
| 89. | Neshanic | 24 | 16,510(0.15%)#89 | 374,148(0.01%)#1,769 |
| 90. | East Rutherford Borough | 23 | 16,510(0.14%)#90 | 374,148(0.01%)#1,794 |
| 91. | Garfield | 22 | 16,510(0.13%)#91 | 374,148(0.01%)#1,812 |
| 92. | Long Branch | 22 | 16,510(0.13%)#92 | 374,148(0.01%)#1,813 |
| 93. | White Horse | 22 | 16,510(0.13%)#93 | 374,148(0.01%)#1,833 |
| 94. | Finderne | 22 | 16,510(0.13%)#94 | 374,148(0.01%)#1,836 |
| 95. | Franklin Center | 22 | 16,510(0.13%)#95 | 374,148(0.01%)#1,837 |
| 96. | Bridgeton | 21 | 16,510(0.13%)#96 | 374,148(0.01%)#1,857 |
| 97. | Clayton Borough | 21 | 16,510(0.13%)#97 | 374,148(0.01%)#1,869 |
| 98. | Hopewell Borough | 20 | 16,510(0.12%)#98 | 374,148(0.01%)#1,908 |
| 99. | Morristown | 19 | 16,510(0.12%)#99 | 374,148(0.01%)#1,932 |
| 100. | Florham Park Borough | 19 | 16,510(0.12%)#100 | 374,148(0.01%)#1,943 |
Common Questions
What are the Top 10 Cities with the Largest Central American Indian Community in New Jersey?
Top 10 Cities with the Largest Central American Indian Community in New Jersey are:
#1
918
#2
763
#3
615
#4
582
#5
559
#6
493
#7
425
#8
327
#9
321
#10
316
What city has the Largest Central American Indian Community in New Jersey?
Jersey City has the Largest Central American Indian Community in New Jersey with 918.
What is the Total Central American Indian Population in the State of New Jersey?
Total Central American Indian Population in New Jersey is 16,510.
What is the Total Central American Indian Population in the United States?
Total Central American Indian Population in the United States is 374,148.