Kenvil, NJ Map & Demographics
Kenvil Map
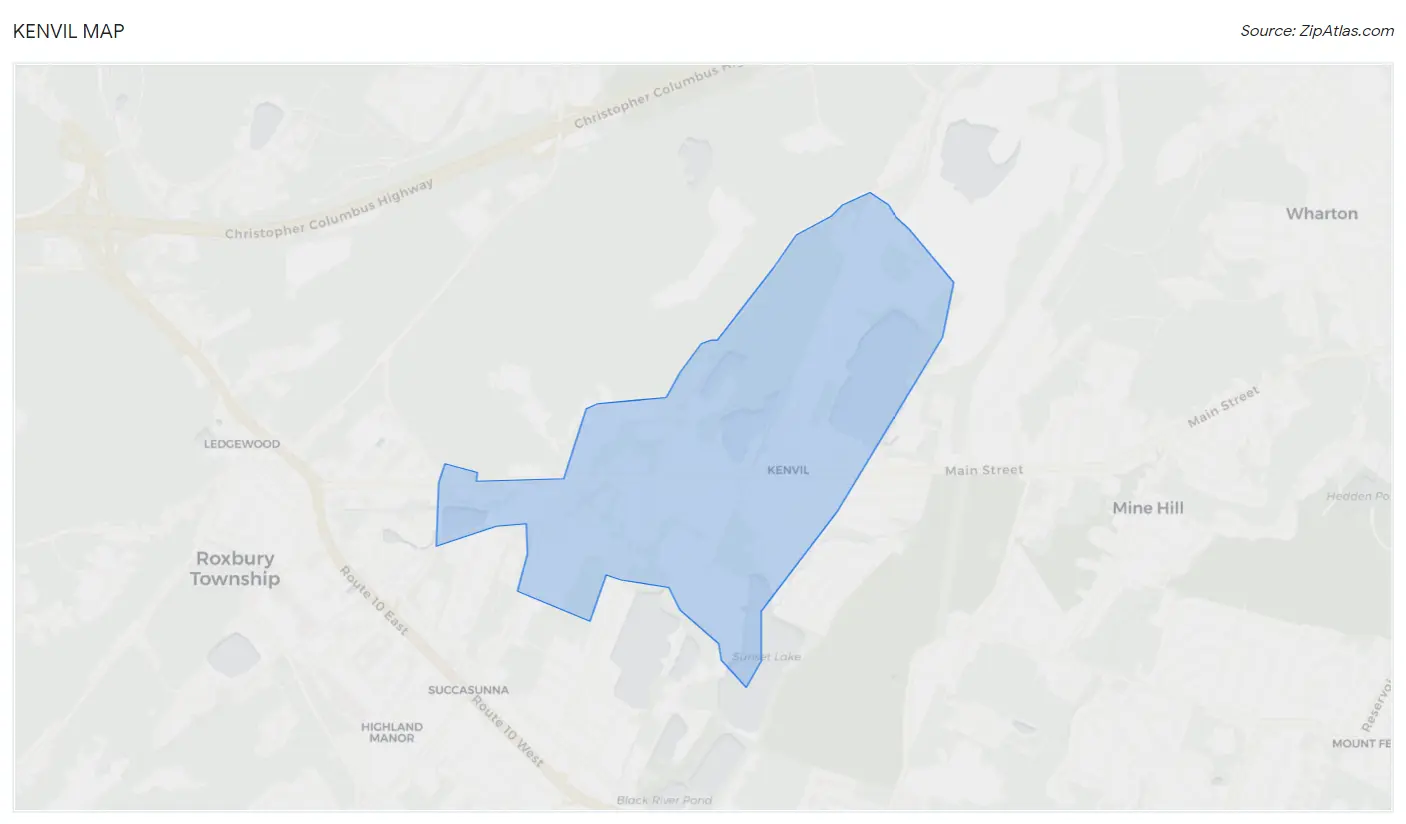
Kenvil Overview
$39,301
PER CAPITA INCOME
$72,404
AVG FAMILY INCOME
$77,461
AVG HOUSEHOLD INCOME
8.8%
WAGE / INCOME GAP [ % ]
91.2¢/ $1
WAGE / INCOME GAP [ $ ]
0.34
INEQUALITY / GINI INDEX
1,636
TOTAL POPULATION
924
MALE POPULATION
712
FEMALE POPULATION
129.78
MALES / 100 FEMALES
77.06
FEMALES / 100 MALES
42.8
MEDIAN AGE
2.7
AVG FAMILY SIZE
2.4
AVG HOUSEHOLD SIZE
838
LABOR FORCE [ PEOPLE ]
64.0%
PERCENT IN LABOR FORCE
1.1%
UNEMPLOYMENT RATE
Kenvil Zip Codes
Income in Kenvil
Income Overview in Kenvil
Per Capita Income in Kenvil is $39,301, while median incomes of families and households are $72,404 and $77,461 respectively.
| Characteristic | Number | Measure |
| Per Capita Income | 1,636 | $39,301 |
| Median Family Income | 536 | $72,404 |
| Mean Family Income | 536 | $95,963 |
| Median Household Income | 681 | $77,461 |
| Mean Household Income | 681 | $92,468 |
| Income Deficit | 536 | $0 |
| Wage / Income Gap (%) | 1,636 | 8.84% |
| Wage / Income Gap ($) | 1,636 | 91.16¢ per $1 |
| Gini / Inequality Index | 1,636 | 0.34 |
Earnings by Sex in Kenvil
Average Earnings in Kenvil are $51,250, $55,240 for men and $50,357 for women, a difference of 8.8%.
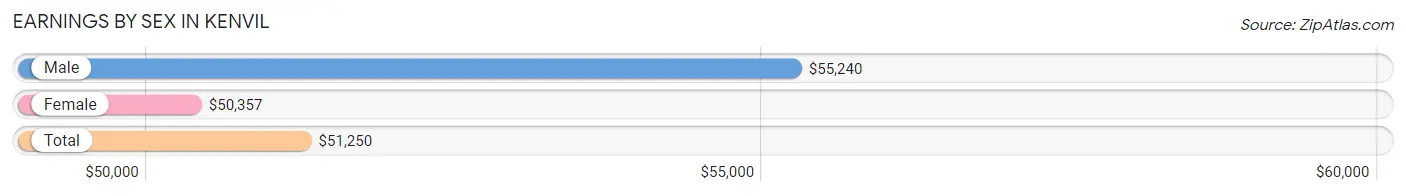
| Sex | Number | Average Earnings |
| Male | 555 (64.8%) | $55,240 |
| Female | 302 (35.2%) | $50,357 |
| Total | 857 (100.0%) | $51,250 |
Earnings by Sex by Income Bracket in Kenvil
The most common earnings brackets in Kenvil are $17,500 to $19,999 for men (94 | 16.9%) and $55,000 to $64,999 for women (66 | 21.8%).
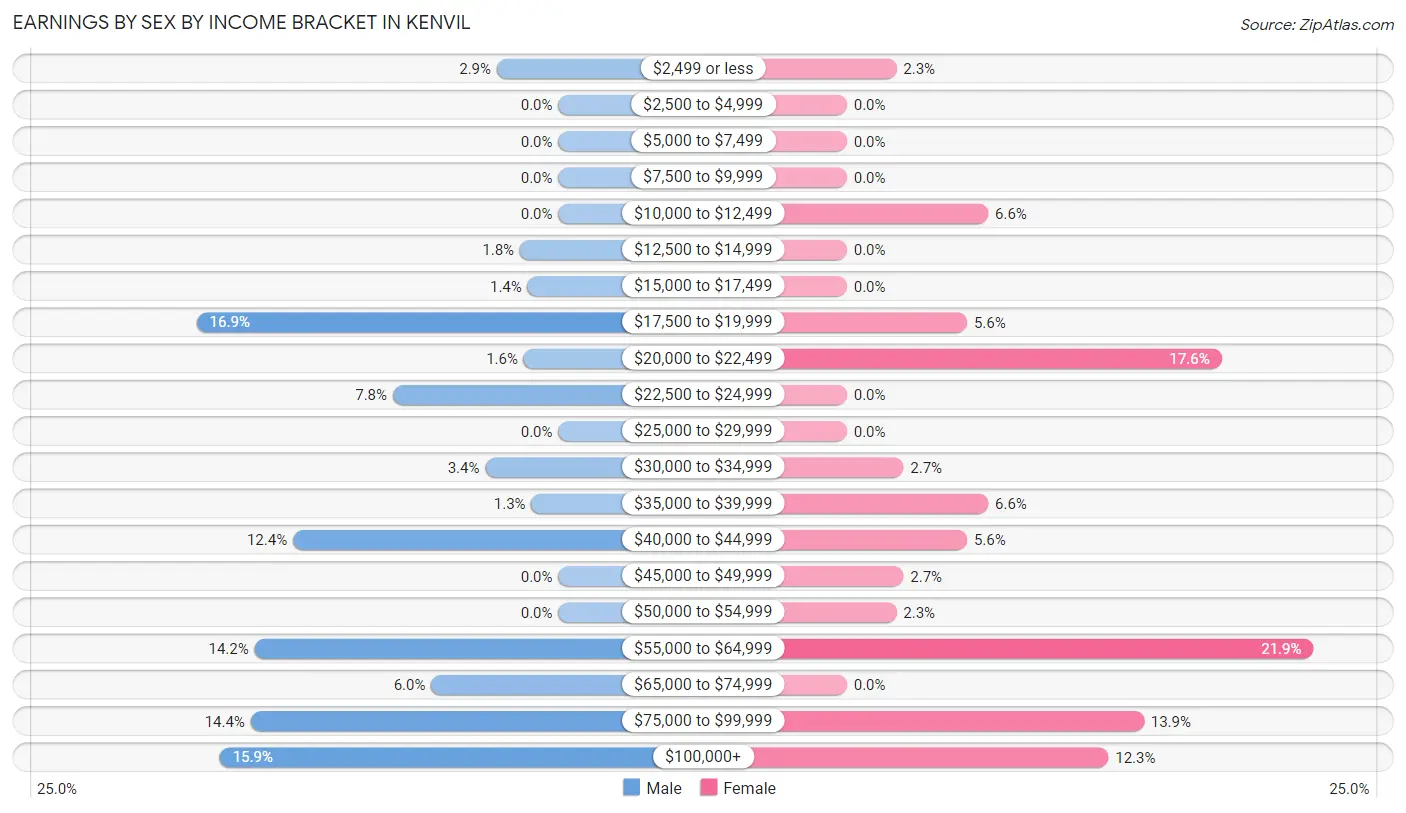
| Income | Male | Female |
| $2,499 or less | 16 (2.9%) | 7 (2.3%) |
| $2,500 to $4,999 | 0 (0.0%) | 0 (0.0%) |
| $5,000 to $7,499 | 0 (0.0%) | 0 (0.0%) |
| $7,500 to $9,999 | 0 (0.0%) | 0 (0.0%) |
| $10,000 to $12,499 | 0 (0.0%) | 20 (6.6%) |
| $12,500 to $14,999 | 10 (1.8%) | 0 (0.0%) |
| $15,000 to $17,499 | 8 (1.4%) | 0 (0.0%) |
| $17,500 to $19,999 | 94 (16.9%) | 17 (5.6%) |
| $20,000 to $22,499 | 9 (1.6%) | 53 (17.5%) |
| $22,500 to $24,999 | 43 (7.7%) | 0 (0.0%) |
| $25,000 to $29,999 | 0 (0.0%) | 0 (0.0%) |
| $30,000 to $34,999 | 19 (3.4%) | 8 (2.6%) |
| $35,000 to $39,999 | 7 (1.3%) | 20 (6.6%) |
| $40,000 to $44,999 | 69 (12.4%) | 17 (5.6%) |
| $45,000 to $49,999 | 0 (0.0%) | 8 (2.6%) |
| $50,000 to $54,999 | 0 (0.0%) | 7 (2.3%) |
| $55,000 to $64,999 | 79 (14.2%) | 66 (21.8%) |
| $65,000 to $74,999 | 33 (5.9%) | 0 (0.0%) |
| $75,000 to $99,999 | 80 (14.4%) | 42 (13.9%) |
| $100,000+ | 88 (15.9%) | 37 (12.2%) |
| Total | 555 (100.0%) | 302 (100.0%) |
Earnings by Sex by Educational Attainment in Kenvil
Average earnings in Kenvil are $56,154 for men and $55,038 for women, a difference of 2.0%. Men with an educational attainment of graduate degree enjoy the highest average annual earnings of $91,136, while those with bachelor's degree education earn the least with $41,780. Women with an educational attainment of graduate degree earn the most with the average annual earnings of $82,386, while those with high school diploma education have the smallest earnings of $38,688.
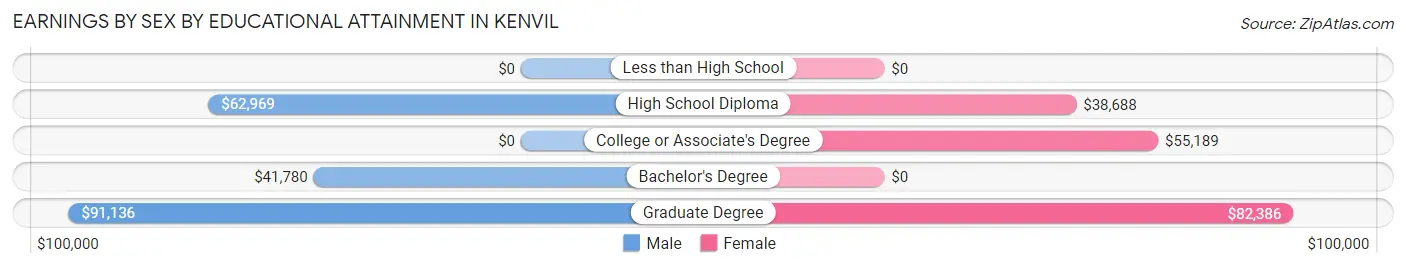
| Educational Attainment | Male Income | Female Income |
| Less than High School | - | - |
| High School Diploma | $62,969 | $38,688 |
| College or Associate's Degree | - | - |
| Bachelor's Degree | $41,780 | $0 |
| Graduate Degree | $91,136 | $82,386 |
| Total | $56,154 | $55,038 |
Family Income in Kenvil
Family Income Brackets in Kenvil
According to the Kenvil family income data, there are 177 families falling into the $50,000 to $74,999 income range, which is the most common income bracket and makes up 33.0% of all families.
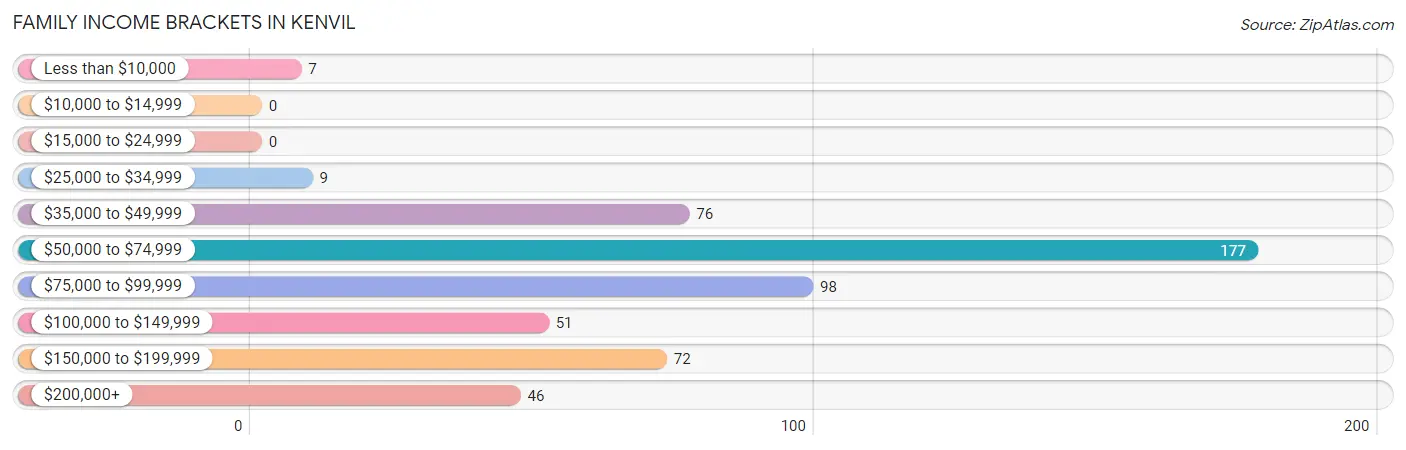
| Income Bracket | # Families | % Families |
| Less than $10,000 | 7 | 1.3% |
| $10,000 to $14,999 | 0 | 0.0% |
| $15,000 to $24,999 | 0 | 0.0% |
| $25,000 to $34,999 | 9 | 1.7% |
| $35,000 to $49,999 | 76 | 14.2% |
| $50,000 to $74,999 | 177 | 33.0% |
| $75,000 to $99,999 | 98 | 18.3% |
| $100,000 to $149,999 | 51 | 9.5% |
| $150,000 to $199,999 | 72 | 13.4% |
| $200,000+ | 46 | 8.6% |
Family Income by Famaliy Size in Kenvil
3-person families (148 | 27.6%) account for the highest median family income in Kenvil with $78,977 per family, while 3-person families (148 | 27.6%) have the highest median income of $26,326 per family member.
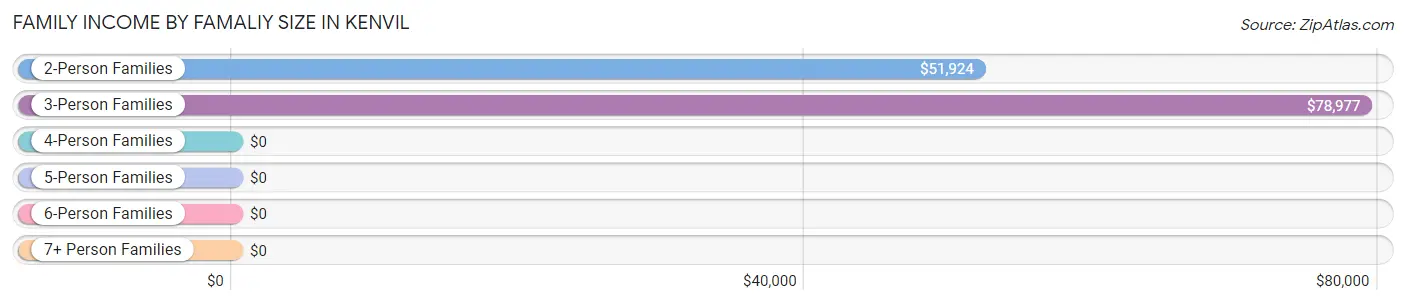
| Income Bracket | # Families | Median Income |
| 2-Person Families | 269 (50.2%) | $51,924 |
| 3-Person Families | 148 (27.6%) | $78,977 |
| 4-Person Families | 103 (19.2%) | $0 |
| 5-Person Families | 16 (3.0%) | $0 |
| 6-Person Families | 0 (0.0%) | $0 |
| 7+ Person Families | 0 (0.0%) | $0 |
| Total | 536 (100.0%) | $72,404 |
Family Income by Number of Earners in Kenvil
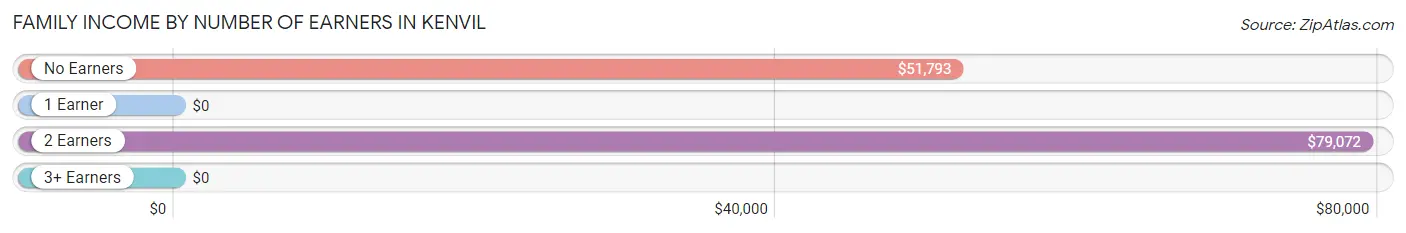
| Number of Earners | # Families | Median Income |
| No Earners | 139 (25.9%) | $51,793 |
| 1 Earner | 124 (23.1%) | $0 |
| 2 Earners | 251 (46.8%) | $79,072 |
| 3+ Earners | 22 (4.1%) | $0 |
| Total | 536 (100.0%) | $72,404 |
Household Income in Kenvil
Household Income Brackets in Kenvil
With 174 households falling in the category, the $50,000 to $74,999 income range is the most frequent in Kenvil, accounting for 25.6% of all households.
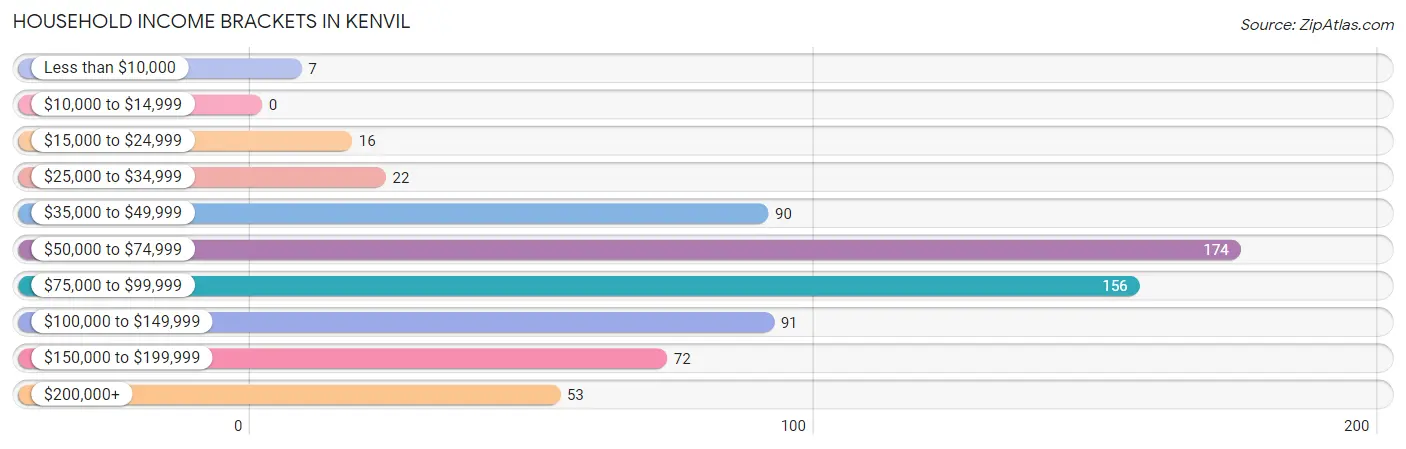
| Income Bracket | # Households | % Households |
| Less than $10,000 | 7 | 1.0% |
| $10,000 to $14,999 | 0 | 0.0% |
| $15,000 to $24,999 | 16 | 2.3% |
| $25,000 to $34,999 | 22 | 3.2% |
| $35,000 to $49,999 | 90 | 13.2% |
| $50,000 to $74,999 | 174 | 25.6% |
| $75,000 to $99,999 | 156 | 22.9% |
| $100,000 to $149,999 | 91 | 13.4% |
| $150,000 to $199,999 | 72 | 10.6% |
| $200,000+ | 53 | 7.8% |
Household Income by Householder Age in Kenvil
The median household income in Kenvil is $77,461, with the highest median household income of $81,746 found in the 45 to 64 years age bracket for the primary householder. A total of 231 households (33.9%) fall into this category. Meanwhile, the 15 to 24 years age bracket for the primary householder has the lowest median household income of $0, with 14 households (2.1%) in this group.
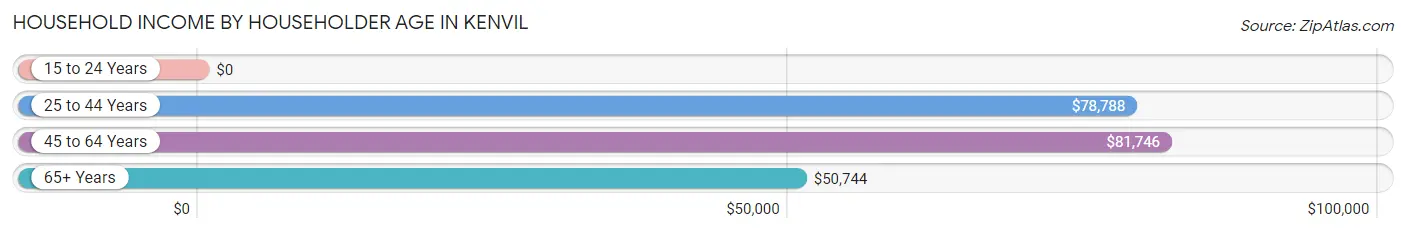
| Income Bracket | # Households | Median Income |
| 15 to 24 Years | 14 (2.1%) | $0 |
| 25 to 44 Years | 220 (32.3%) | $78,788 |
| 45 to 64 Years | 231 (33.9%) | $81,746 |
| 65+ Years | 216 (31.7%) | $50,744 |
| Total | 681 (100.0%) | $77,461 |
Poverty in Kenvil
Income Below Poverty by Sex and Age in Kenvil
With 4.8% poverty level for males and 2.2% for females among the residents of Kenvil, 45 to 54 year old males and 55 to 64 year old females are the most vulnerable to poverty, with 28 males (14.6%) and 7 females (9.1%) in their respective age groups living below the poverty level.
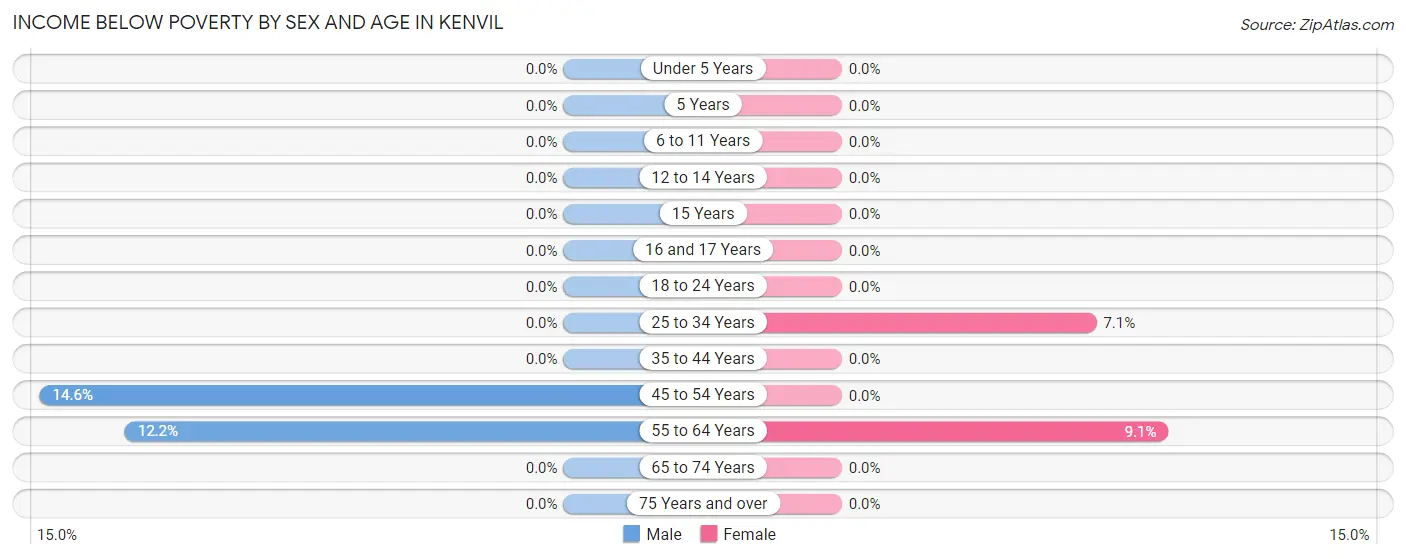
| Age Bracket | Male | Female |
| Under 5 Years | 0 (0.0%) | 0 (0.0%) |
| 5 Years | 0 (0.0%) | 0 (0.0%) |
| 6 to 11 Years | 0 (0.0%) | 0 (0.0%) |
| 12 to 14 Years | 0 (0.0%) | 0 (0.0%) |
| 15 Years | 0 (0.0%) | 0 (0.0%) |
| 16 and 17 Years | 0 (0.0%) | 0 (0.0%) |
| 18 to 24 Years | 0 (0.0%) | 0 (0.0%) |
| 25 to 34 Years | 0 (0.0%) | 9 (7.1%) |
| 35 to 44 Years | 0 (0.0%) | 0 (0.0%) |
| 45 to 54 Years | 28 (14.6%) | 0 (0.0%) |
| 55 to 64 Years | 16 (12.2%) | 7 (9.1%) |
| 65 to 74 Years | 0 (0.0%) | 0 (0.0%) |
| 75 Years and over | 0 (0.0%) | 0 (0.0%) |
| Total | 44 (4.8%) | 16 (2.2%) |
Income Above Poverty by Sex and Age in Kenvil
According to the poverty statistics in Kenvil, males aged under 5 years and females aged under 5 years are the age groups that are most secure financially, with 100.0% of males and 100.0% of females in these age groups living above the poverty line.
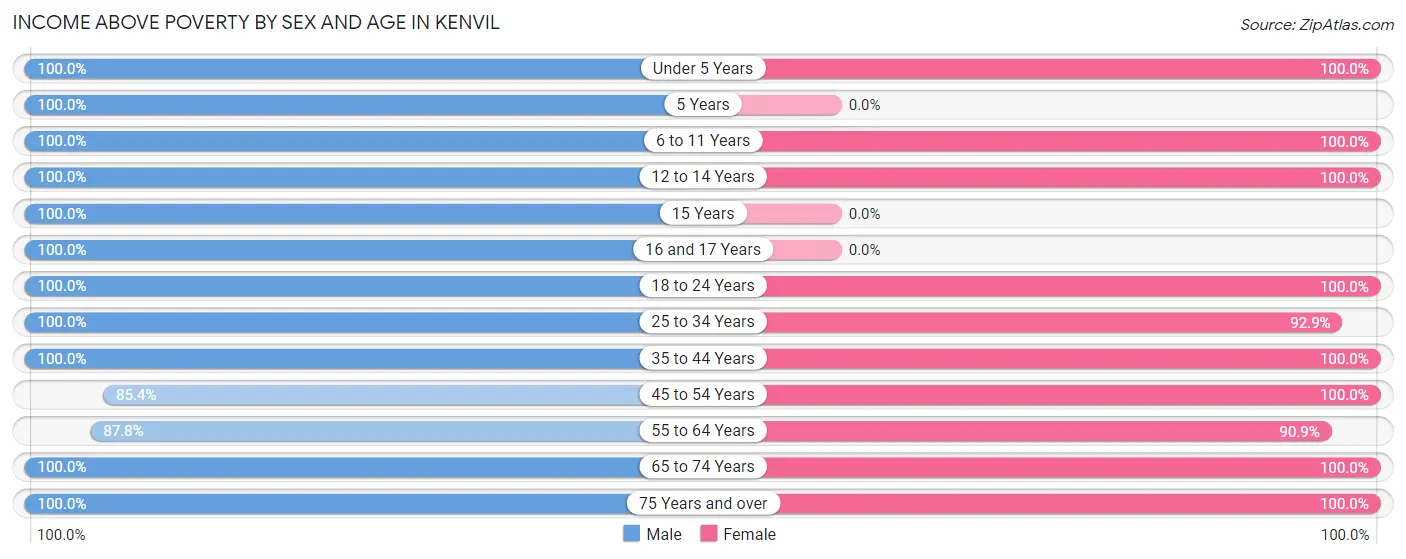
| Age Bracket | Male | Female |
| Under 5 Years | 70 (100.0%) | 38 (100.0%) |
| 5 Years | 7 (100.0%) | 0 (0.0%) |
| 6 to 11 Years | 30 (100.0%) | 98 (100.0%) |
| 12 to 14 Years | 33 (100.0%) | 24 (100.0%) |
| 15 Years | 26 (100.0%) | 0 (0.0%) |
| 16 and 17 Years | 22 (100.0%) | 0 (0.0%) |
| 18 to 24 Years | 27 (100.0%) | 14 (100.0%) |
| 25 to 34 Years | 81 (100.0%) | 118 (92.9%) |
| 35 to 44 Years | 177 (100.0%) | 85 (100.0%) |
| 45 to 54 Years | 164 (85.4%) | 46 (100.0%) |
| 55 to 64 Years | 115 (87.8%) | 70 (90.9%) |
| 65 to 74 Years | 44 (100.0%) | 121 (100.0%) |
| 75 Years and over | 84 (100.0%) | 82 (100.0%) |
| Total | 880 (95.2%) | 696 (97.8%) |
Income Below Poverty Among Married-Couple Families in Kenvil
The poverty statistics for married-couple families in Kenvil show that 1.9% or 7 of the total 376 families live below the poverty line. Families with no children have the highest poverty rate of 4.2%, comprising of 7 families. On the other hand, families with 1 or 2 children have the lowest poverty rate of 0.0%, which includes 0 families.
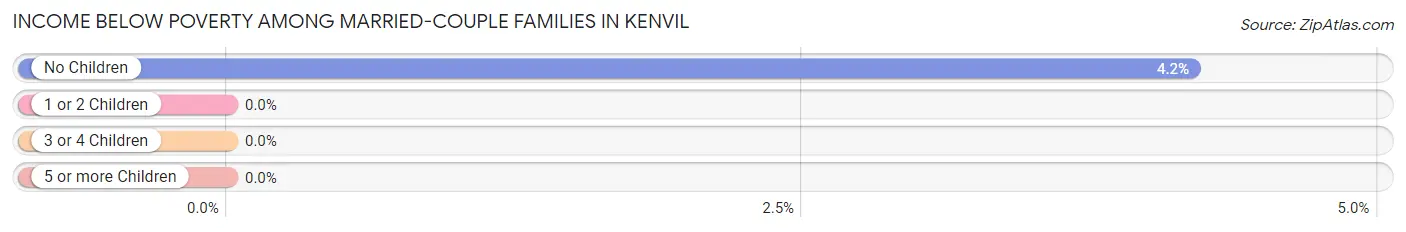
| Children | Above Poverty | Below Poverty |
| No Children | 160 (95.8%) | 7 (4.2%) |
| 1 or 2 Children | 201 (100.0%) | 0 (0.0%) |
| 3 or 4 Children | 8 (100.0%) | 0 (0.0%) |
| 5 or more Children | 0 (0.0%) | 0 (0.0%) |
| Total | 369 (98.1%) | 7 (1.9%) |
Income Below Poverty Among Single-Parent Households in Kenvil
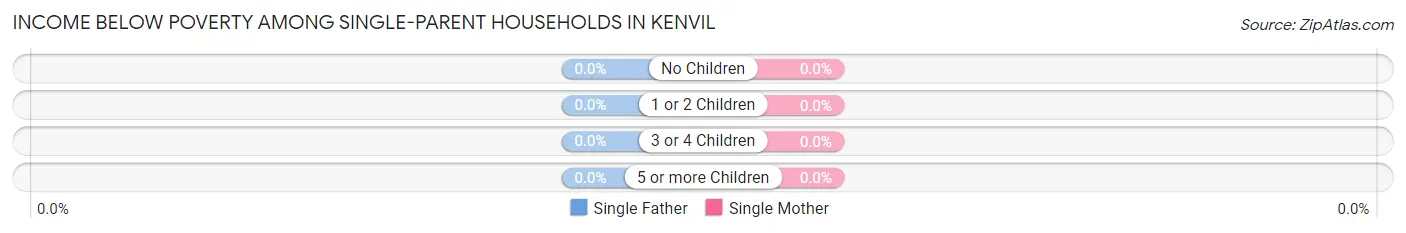
| Children | Single Father | Single Mother |
| No Children | 0 (0.0%) | 0 (0.0%) |
| 1 or 2 Children | 0 (0.0%) | 0 (0.0%) |
| 3 or 4 Children | 0 (0.0%) | 0 (0.0%) |
| 5 or more Children | 0 (0.0%) | 0 (0.0%) |
| Total | 0 (0.0%) | 0 (0.0%) |
Income Below Poverty Among Married-Couple vs Single-Parent Households in Kenvil
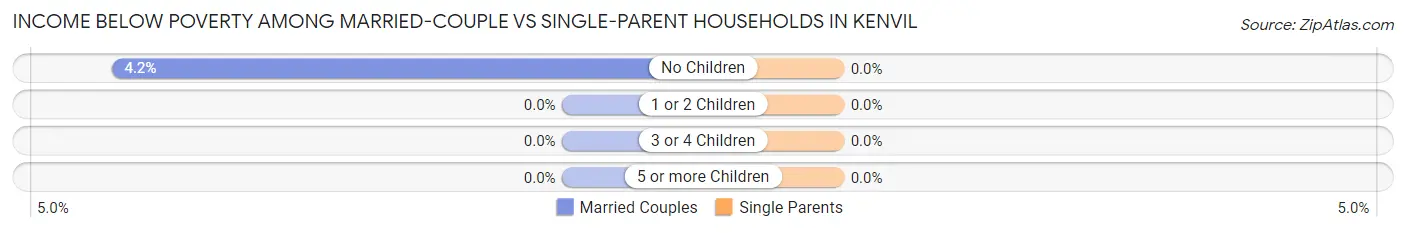
| Children | Married-Couple Families | Single-Parent Households |
| No Children | 7 (4.2%) | 0 (0.0%) |
| 1 or 2 Children | 0 (0.0%) | 0 (0.0%) |
| 3 or 4 Children | 0 (0.0%) | 0 (0.0%) |
| 5 or more Children | 0 (0.0%) | 0 (0.0%) |
| Total | 7 (1.9%) | 0 (0.0%) |
Race in Kenvil
The most populous races in Kenvil are White / Caucasian (1,236 | 75.5%), Hispanic or Latino (248 | 15.2%), and Two or more Races (193 | 11.8%).
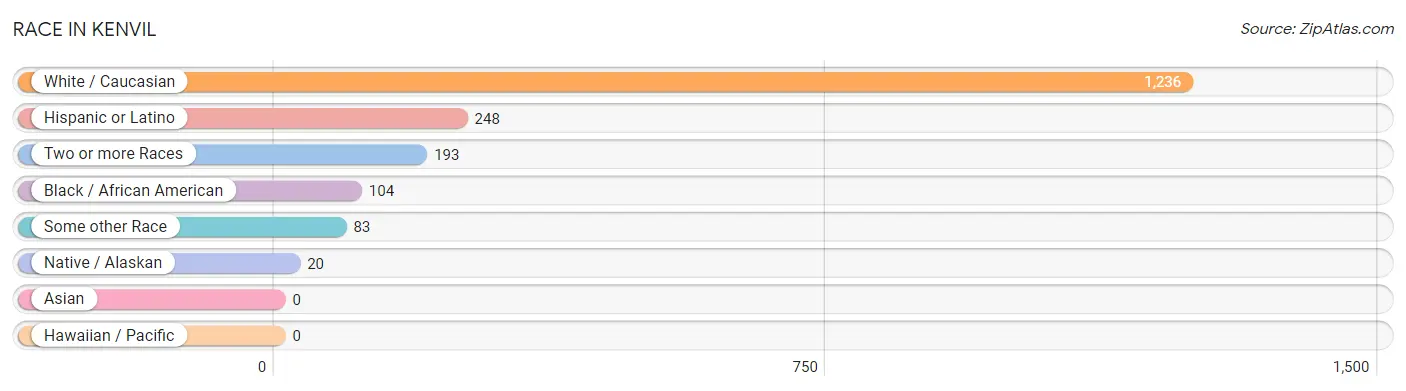
| Race | # Population | % Population |
| Asian | 0 | 0.0% |
| Black / African American | 104 | 6.4% |
| Hawaiian / Pacific | 0 | 0.0% |
| Hispanic or Latino | 248 | 15.2% |
| Native / Alaskan | 20 | 1.2% |
| White / Caucasian | 1,236 | 75.5% |
| Two or more Races | 193 | 11.8% |
| Some other Race | 83 | 5.1% |
| Total | 1,636 | 100.0% |
Ancestry in Kenvil
The most populous ancestries reported in Kenvil are Italian (462 | 28.2%), Irish (360 | 22.0%), English (238 | 14.5%), German (193 | 11.8%), and South American (172 | 10.5%), together accounting for 87.1% of all Kenvil residents.
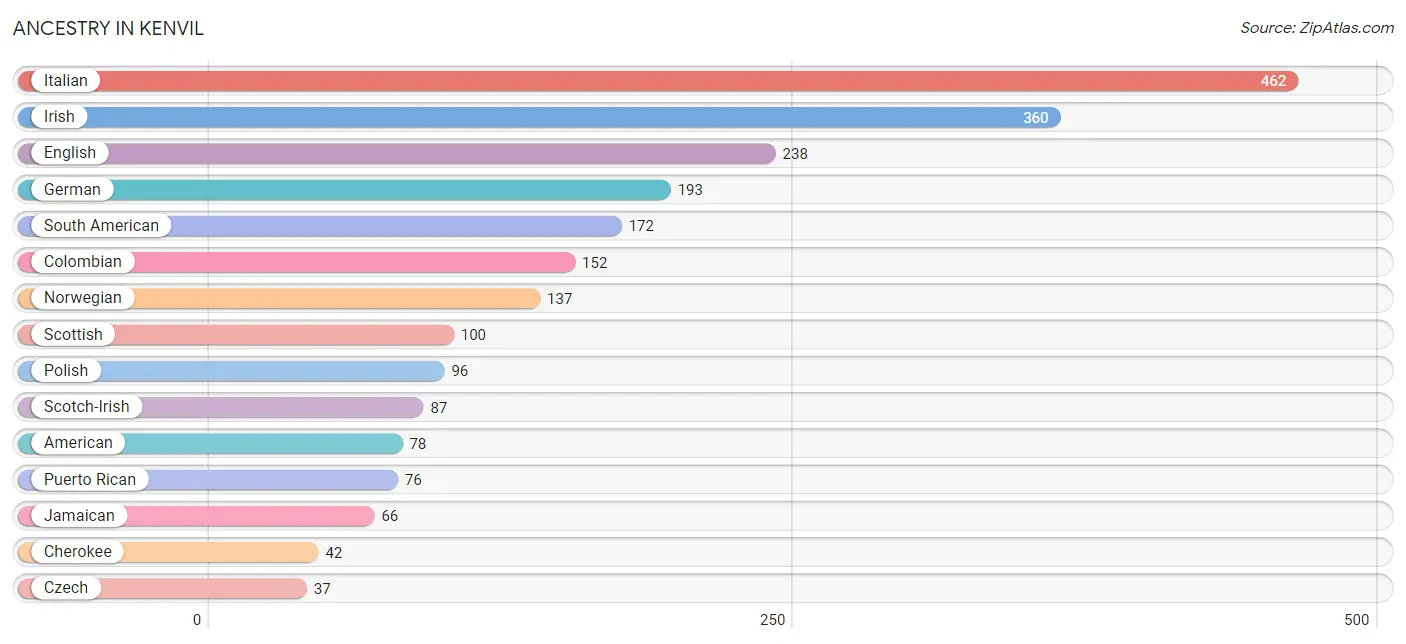
| Ancestry | # Population | % Population |
| American | 78 | 4.8% |
| Armenian | 6 | 0.4% |
| Austrian | 10 | 0.6% |
| British | 14 | 0.9% |
| Cherokee | 42 | 2.6% |
| Colombian | 152 | 9.3% |
| Czech | 37 | 2.3% |
| Dutch | 36 | 2.2% |
| English | 238 | 14.5% |
| German | 193 | 11.8% |
| Hungarian | 36 | 2.2% |
| Irish | 360 | 22.0% |
| Italian | 462 | 28.2% |
| Jamaican | 66 | 4.0% |
| Lithuanian | 13 | 0.8% |
| Norwegian | 137 | 8.4% |
| Peruvian | 20 | 1.2% |
| Polish | 96 | 5.9% |
| Puerto Rican | 76 | 4.6% |
| Russian | 22 | 1.3% |
| Scotch-Irish | 87 | 5.3% |
| Scottish | 100 | 6.1% |
| Slavic | 21 | 1.3% |
| Slovak | 7 | 0.4% |
| South American | 172 | 10.5% |
| South American Indian | 20 | 1.2% |
| Swedish | 6 | 0.4% |
| Swiss | 23 | 1.4% |
| Ukrainian | 31 | 1.9% |
| Welsh | 7 | 0.4% | View All 30 Rows |
Immigrants in Kenvil
The most numerous immigrant groups reported in Kenvil came from Eastern Europe (59 | 3.6%), Europe (59 | 3.6%), Poland (36 | 2.2%), Ukraine (23 | 1.4%), and Latin America (20 | 1.2%), together accounting for 12.1% of all Kenvil residents.
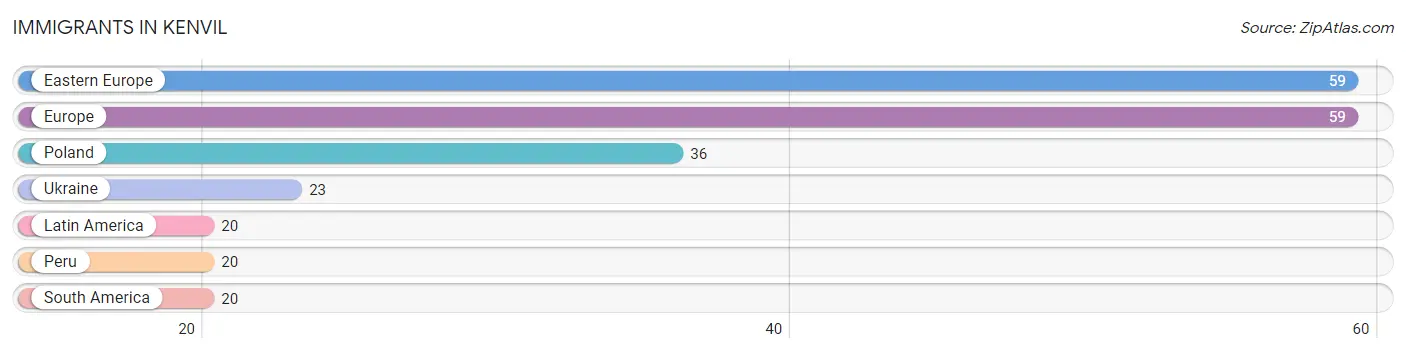
| Immigration Origin | # Population | % Population |
| Eastern Europe | 59 | 3.6% |
| Europe | 59 | 3.6% |
| Latin America | 20 | 1.2% |
| Peru | 20 | 1.2% |
| Poland | 36 | 2.2% |
| South America | 20 | 1.2% |
| Ukraine | 23 | 1.4% | View All 7 Rows |
Sex and Age in Kenvil
Sex and Age in Kenvil
The most populous age groups in Kenvil are 45 to 49 Years (136 | 14.7%) for men and 30 to 34 Years (75 | 10.5%) for women.
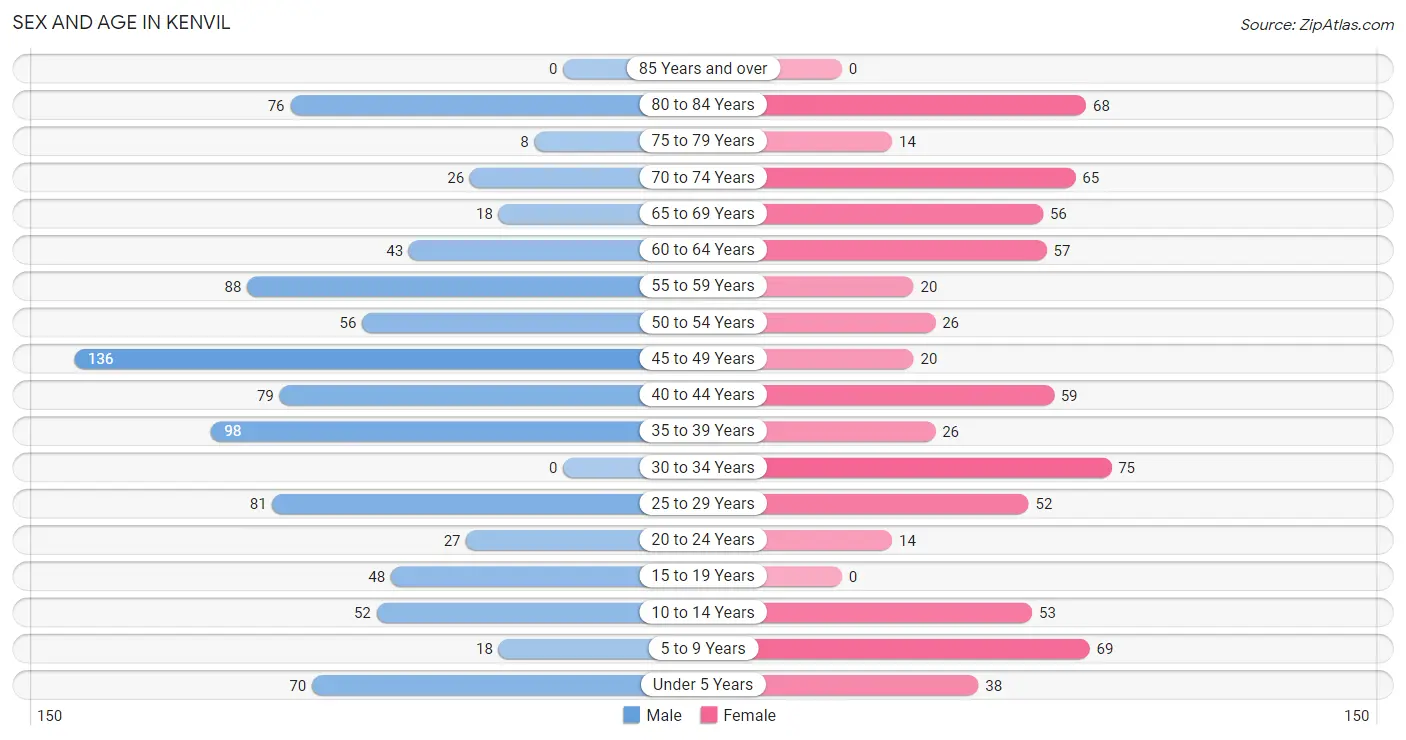
| Age Bracket | Male | Female |
| Under 5 Years | 70 (7.6%) | 38 (5.3%) |
| 5 to 9 Years | 18 (1.9%) | 69 (9.7%) |
| 10 to 14 Years | 52 (5.6%) | 53 (7.4%) |
| 15 to 19 Years | 48 (5.2%) | 0 (0.0%) |
| 20 to 24 Years | 27 (2.9%) | 14 (2.0%) |
| 25 to 29 Years | 81 (8.8%) | 52 (7.3%) |
| 30 to 34 Years | 0 (0.0%) | 75 (10.5%) |
| 35 to 39 Years | 98 (10.6%) | 26 (3.6%) |
| 40 to 44 Years | 79 (8.6%) | 59 (8.3%) |
| 45 to 49 Years | 136 (14.7%) | 20 (2.8%) |
| 50 to 54 Years | 56 (6.1%) | 26 (3.6%) |
| 55 to 59 Years | 88 (9.5%) | 20 (2.8%) |
| 60 to 64 Years | 43 (4.6%) | 57 (8.0%) |
| 65 to 69 Years | 18 (1.9%) | 56 (7.9%) |
| 70 to 74 Years | 26 (2.8%) | 65 (9.1%) |
| 75 to 79 Years | 8 (0.9%) | 14 (2.0%) |
| 80 to 84 Years | 76 (8.2%) | 68 (9.6%) |
| 85 Years and over | 0 (0.0%) | 0 (0.0%) |
| Total | 924 (100.0%) | 712 (100.0%) |
Families and Households in Kenvil
Median Family Size in Kenvil
The median family size in Kenvil is 2.66 persons per family, with married-couple families (376 | 70.2%) accounting for the largest median family size of 2.73 persons per family. On the other hand, single male/father families (60 | 11.2%) represent the smallest median family size with 2.42 persons per family.
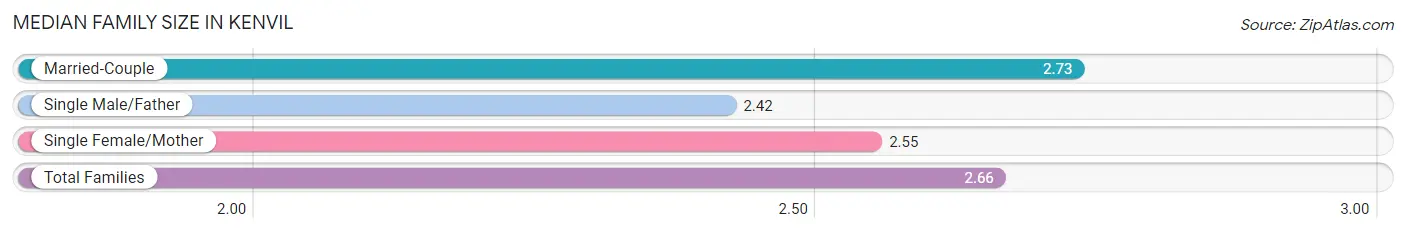
| Family Type | # Families | Family Size |
| Married-Couple | 376 (70.2%) | 2.73 |
| Single Male/Father | 60 (11.2%) | 2.42 |
| Single Female/Mother | 100 (18.7%) | 2.55 |
| Total Families | 536 (100.0%) | 2.66 |
Median Household Size in Kenvil
The median household size in Kenvil is 2.36 persons per household, with single male/father households (60 | 8.8%) accounting for the largest median household size of 2.75 persons per household. non-family households (145 | 21.3%) represent the smallest median household size with 1.12 persons per household.
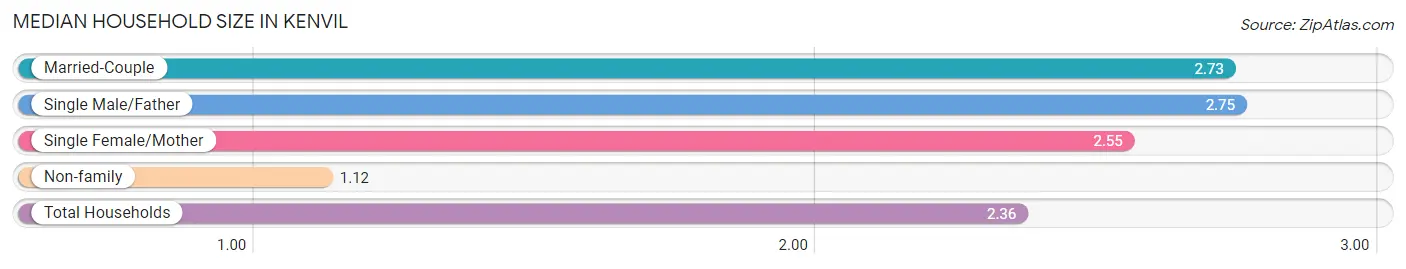
| Household Type | # Households | Household Size |
| Married-Couple | 376 (55.2%) | 2.73 |
| Single Male/Father | 60 (8.8%) | 2.75 |
| Single Female/Mother | 100 (14.7%) | 2.55 |
| Non-family | 145 (21.3%) | 1.12 |
| Total Households | 681 (100.0%) | 2.36 |
Household Size by Marriage Status in Kenvil
Out of a total of 681 households in Kenvil, 536 (78.7%) are family households, while 145 (21.3%) are nonfamily households. The most numerous type of family households are 2-person households, comprising 269, and the most common type of nonfamily households are 1-person households, comprising 137.
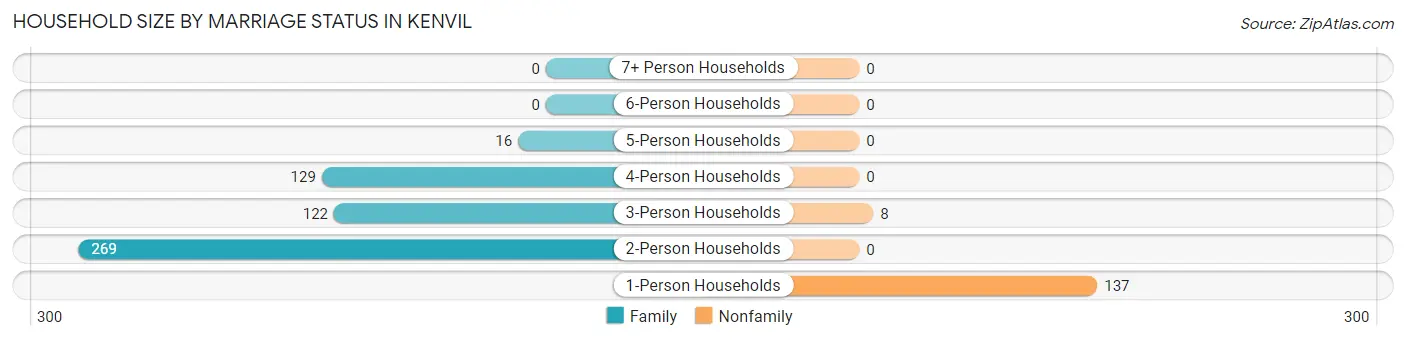
| Household Size | Family Households | Nonfamily Households |
| 1-Person Households | - | 137 (20.1%) |
| 2-Person Households | 269 (39.5%) | 0 (0.0%) |
| 3-Person Households | 122 (17.9%) | 8 (1.2%) |
| 4-Person Households | 129 (18.9%) | 0 (0.0%) |
| 5-Person Households | 16 (2.4%) | 0 (0.0%) |
| 6-Person Households | 0 (0.0%) | 0 (0.0%) |
| 7+ Person Households | 0 (0.0%) | 0 (0.0%) |
| Total | 536 (78.7%) | 145 (21.3%) |
Female Fertility in Kenvil
Fertility by Age in Kenvil
Average fertility rate in Kenvil is 69.0 births per 1,000 women. Women in the age bracket of 20 to 34 years have the highest fertility rate with 121.0 births per 1,000 women. Women in the age bracket of 20 to 34 years acount for 100.0% of all women with births.
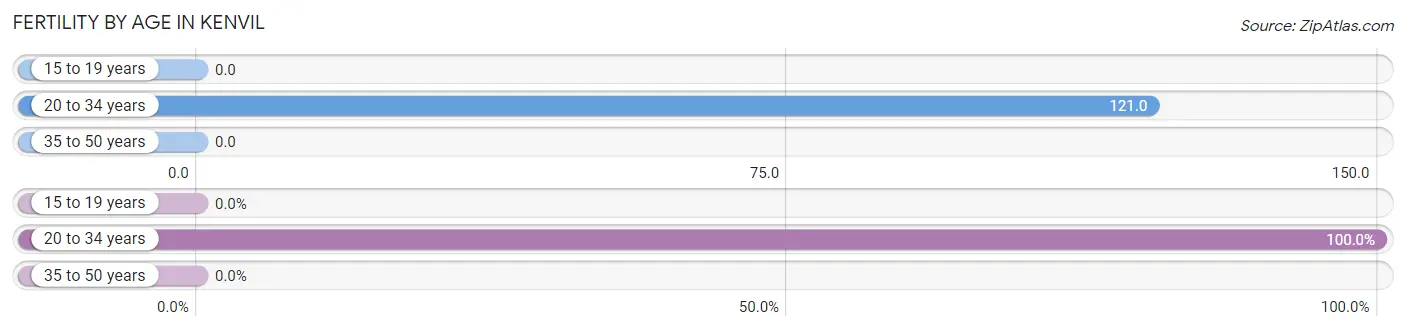
| Age Bracket | Women with Births | Births / 1,000 Women |
| 15 to 19 years | 0 (0.0%) | 0.0 |
| 20 to 34 years | 17 (100.0%) | 121.0 |
| 35 to 50 years | 0 (0.0%) | 0.0 |
| Total | 17 (100.0%) | 69.0 |
Fertility by Age by Marriage Status in Kenvil
47.1% of women with births (17) in Kenvil are married. The highest percentage of unmarried women with births falls into 20 to 34 years age bracket with 52.9% of them unmarried at the time of birth, while the lowest percentage of unmarried women with births belong to 20 to 34 years age bracket with 52.9% of them unmarried.
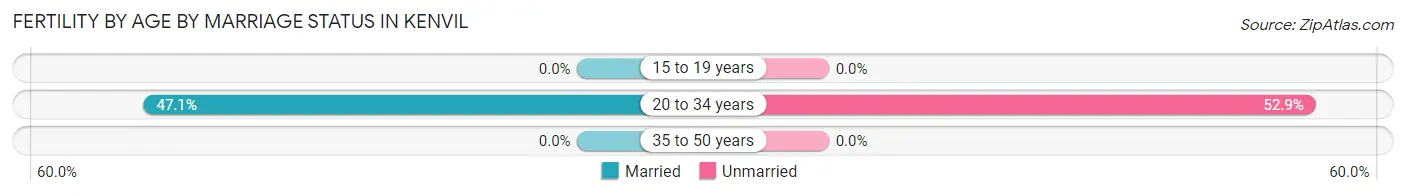
| Age Bracket | Married | Unmarried |
| 15 to 19 years | 0 (0.0%) | 0 (0.0%) |
| 20 to 34 years | 8 (47.1%) | 9 (52.9%) |
| 35 to 50 years | 0 (0.0%) | 0 (0.0%) |
| Total | 8 (47.1%) | 9 (52.9%) |
Fertility by Education in Kenvil
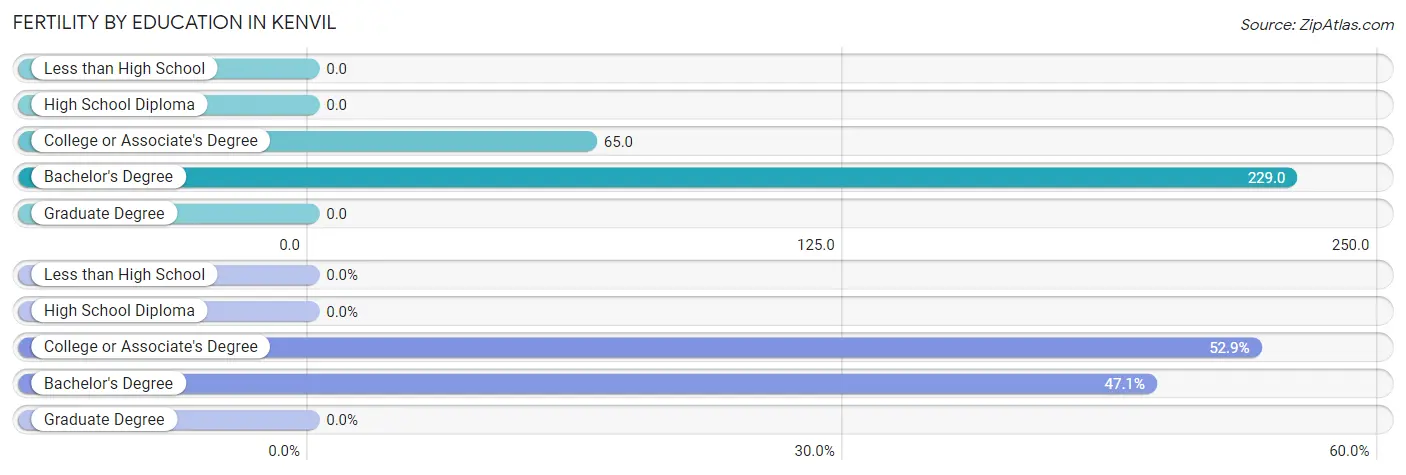
| Educational Attainment | Women with Births | Births / 1,000 Women |
| Less than High School | 0 (0.0%) | 0.0 |
| High School Diploma | 0 (0.0%) | 0.0 |
| College or Associate's Degree | 9 (52.9%) | 65.0 |
| Bachelor's Degree | 8 (47.1%) | 229.0 |
| Graduate Degree | 0 (0.0%) | 0.0 |
| Total | 17 (100.0%) | 69.0 |
Fertility by Education by Marriage Status in Kenvil
52.9% of women with births in Kenvil are unmarried. Women with the educational attainment of bachelor's degree are most likely to be married with 100.0% of them married at childbirth, while women with the educational attainment of college or associate's degree are least likely to be married with 100.0% of them unmarried at childbirth.
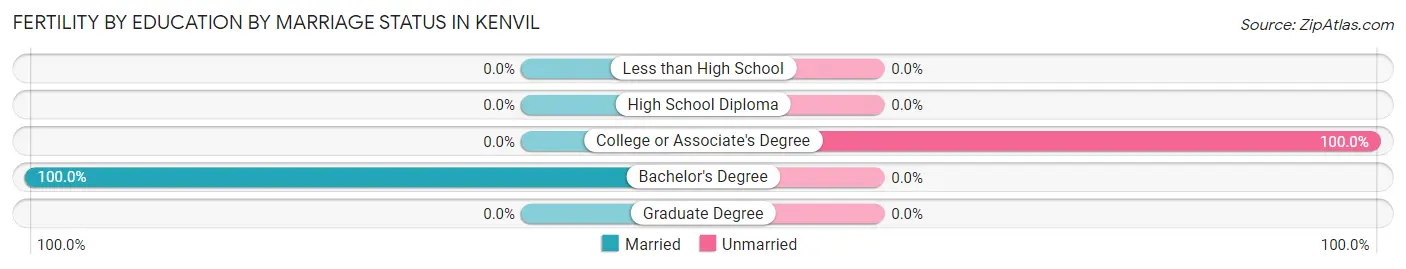
| Educational Attainment | Married | Unmarried |
| Less than High School | 0 (0.0%) | 0 (0.0%) |
| High School Diploma | 0 (0.0%) | 0 (0.0%) |
| College or Associate's Degree | 0 (0.0%) | 9 (100.0%) |
| Bachelor's Degree | 8 (100.0%) | 0 (0.0%) |
| Graduate Degree | 0 (0.0%) | 0 (0.0%) |
| Total | 8 (47.1%) | 9 (52.9%) |
Employment Characteristics in Kenvil
Employment by Class of Employer in Kenvil
Among the 823 employed individuals in Kenvil, private company employees (574 | 69.7%), self-employed (not incorporated) (87 | 10.6%), and not-for-profit organizations (63 | 7.6%) make up the most common classes of employment.
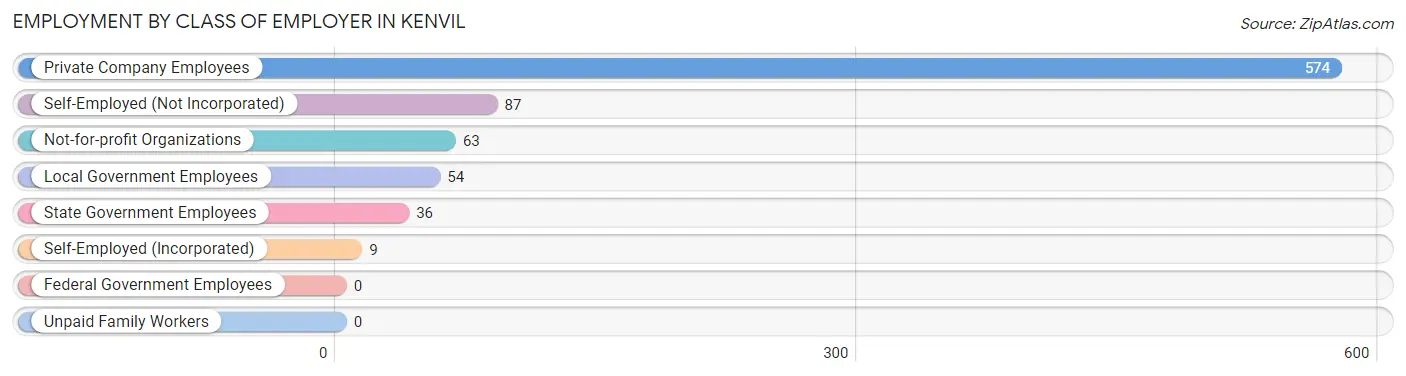
| Employer Class | # Employees | % Employees |
| Private Company Employees | 574 | 69.7% |
| Self-Employed (Incorporated) | 9 | 1.1% |
| Self-Employed (Not Incorporated) | 87 | 10.6% |
| Not-for-profit Organizations | 63 | 7.6% |
| Local Government Employees | 54 | 6.6% |
| State Government Employees | 36 | 4.4% |
| Federal Government Employees | 0 | 0.0% |
| Unpaid Family Workers | 0 | 0.0% |
| Total | 823 | 100.0% |
Employment Status by Age in Kenvil
According to the labor force statistics for Kenvil, out of the total population over 16 years of age (1,310), 64.0% or 838 individuals are in the labor force, with 1.1% or 9 of them unemployed. The age group with the highest labor force participation rate is 20 to 24 years, with 100.0% or 41 individuals in the labor force. Within the labor force, the 25 to 29 years age range has the highest percentage of unemployed individuals, with 6.8% or 9 of them being unemployed.
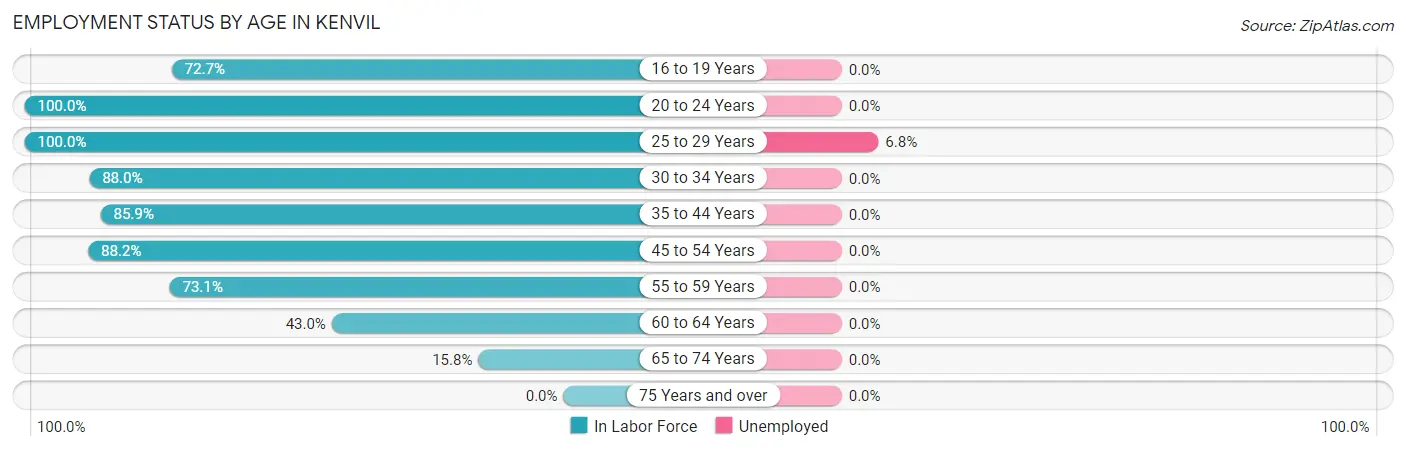
| Age Bracket | In Labor Force | Unemployed |
| 16 to 19 Years | 16 (72.7%) | 0 (0.0%) |
| 20 to 24 Years | 41 (100.0%) | 0 (0.0%) |
| 25 to 29 Years | 133 (100.0%) | 9 (6.8%) |
| 30 to 34 Years | 66 (88.0%) | 0 (0.0%) |
| 35 to 44 Years | 225 (85.9%) | 0 (0.0%) |
| 45 to 54 Years | 210 (88.2%) | 0 (0.0%) |
| 55 to 59 Years | 79 (73.1%) | 0 (0.0%) |
| 60 to 64 Years | 43 (43.0%) | 0 (0.0%) |
| 65 to 74 Years | 26 (15.8%) | 0 (0.0%) |
| 75 Years and over | 0 (0.0%) | 0 (0.0%) |
| Total | 838 (64.0%) | 9 (1.1%) |
Employment Status by Educational Attainment in Kenvil
According to labor force statistics for Kenvil, 82.5% of individuals (756) out of the total population between 25 and 64 years of age (916) are in the labor force, with 1.2% or 9 of them being unemployed. The group with the highest labor force participation rate are those with the educational attainment of bachelor's degree or higher, with 94.7% or 230 individuals in the labor force. Within the labor force, individuals with high school diploma education have the highest percentage of unemployment, with 3.5% or 9 of them being unemployed.
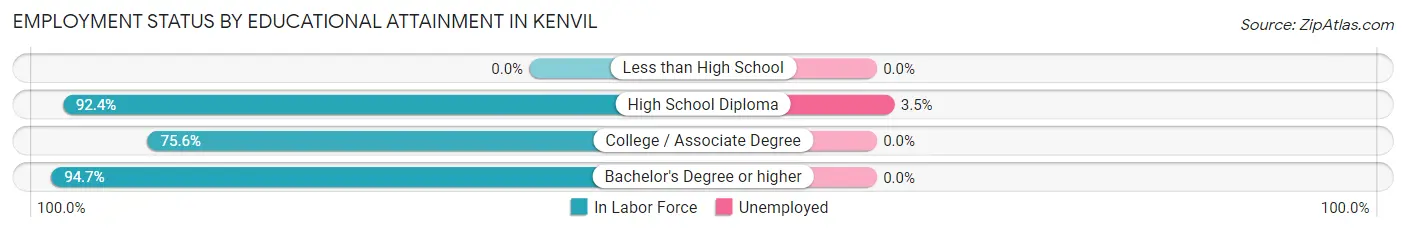
| Educational Attainment | In Labor Force | Unemployed |
| Less than High School | 0 (0.0%) | 0 (0.0%) |
| High School Diploma | 256 (92.4%) | 10 (3.5%) |
| College / Associate Degree | 270 (75.6%) | 0 (0.0%) |
| Bachelor's Degree or higher | 230 (94.7%) | 0 (0.0%) |
| Total | 756 (82.5%) | 11 (1.2%) |
Employment Occupations by Sex in Kenvil
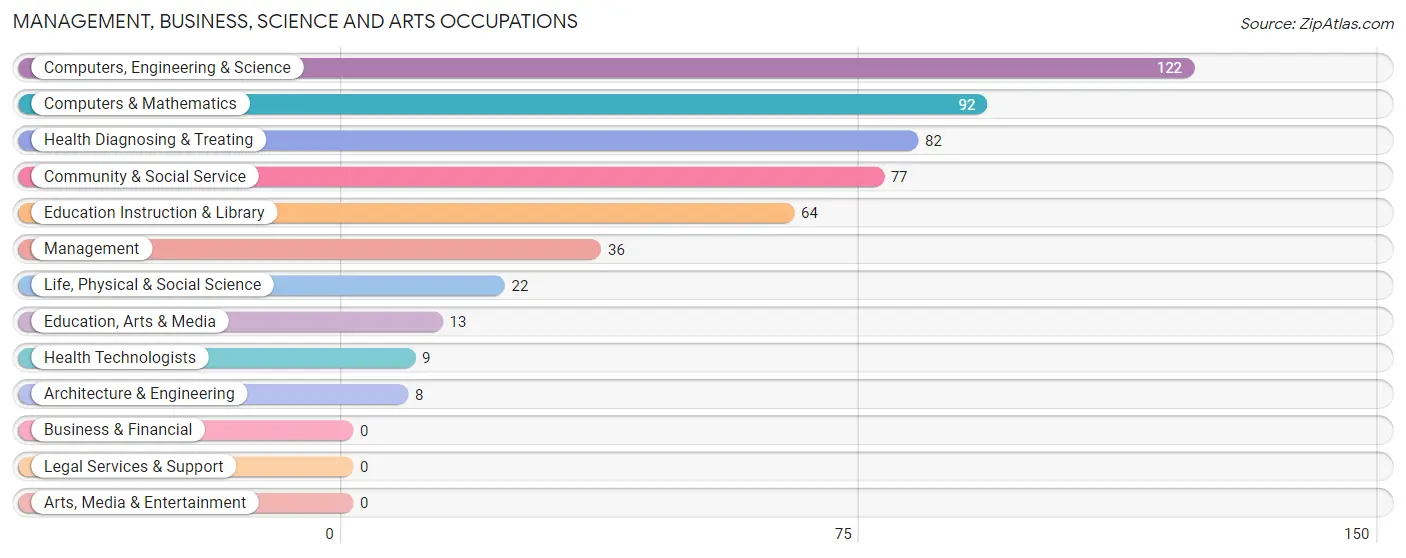
Management, Business, Science and Arts Occupations
The most common Management, Business, Science and Arts occupations in Kenvil are Computers, Engineering & Science (122 | 14.7%), Computers & Mathematics (92 | 11.1%), Health Diagnosing & Treating (82 | 9.9%), Community & Social Service (77 | 9.3%), and Education Instruction & Library (64 | 7.7%).
Management, Business, Science and Arts Occupations by Sex
Within the Management, Business, Science and Arts occupations in Kenvil, the most male-oriented occupations are Computers & Mathematics (100.0%), Architecture & Engineering (100.0%), and Education, Arts & Media (100.0%), while the most female-oriented occupations are Life, Physical & Social Science (100.0%), Health Technologists (100.0%), and Health Diagnosing & Treating (91.5%).
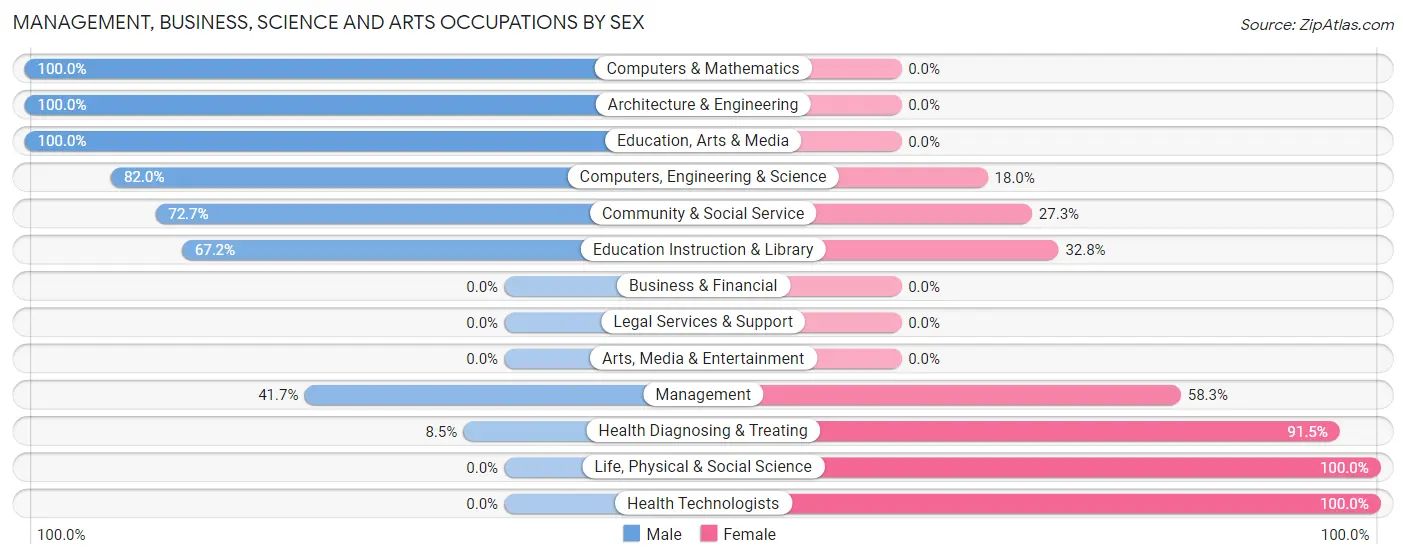
| Occupation | Male | Female |
| Management | 15 (41.7%) | 21 (58.3%) |
| Business & Financial | 0 (0.0%) | 0 (0.0%) |
| Computers, Engineering & Science | 100 (82.0%) | 22 (18.0%) |
| Computers & Mathematics | 92 (100.0%) | 0 (0.0%) |
| Architecture & Engineering | 8 (100.0%) | 0 (0.0%) |
| Life, Physical & Social Science | 0 (0.0%) | 22 (100.0%) |
| Community & Social Service | 56 (72.7%) | 21 (27.3%) |
| Education, Arts & Media | 13 (100.0%) | 0 (0.0%) |
| Legal Services & Support | 0 (0.0%) | 0 (0.0%) |
| Education Instruction & Library | 43 (67.2%) | 21 (32.8%) |
| Arts, Media & Entertainment | 0 (0.0%) | 0 (0.0%) |
| Health Diagnosing & Treating | 7 (8.5%) | 75 (91.5%) |
| Health Technologists | 0 (0.0%) | 9 (100.0%) |
| Total (Category) | 178 (56.1%) | 139 (43.9%) |
| Total (Overall) | 555 (66.9%) | 275 (33.1%) |
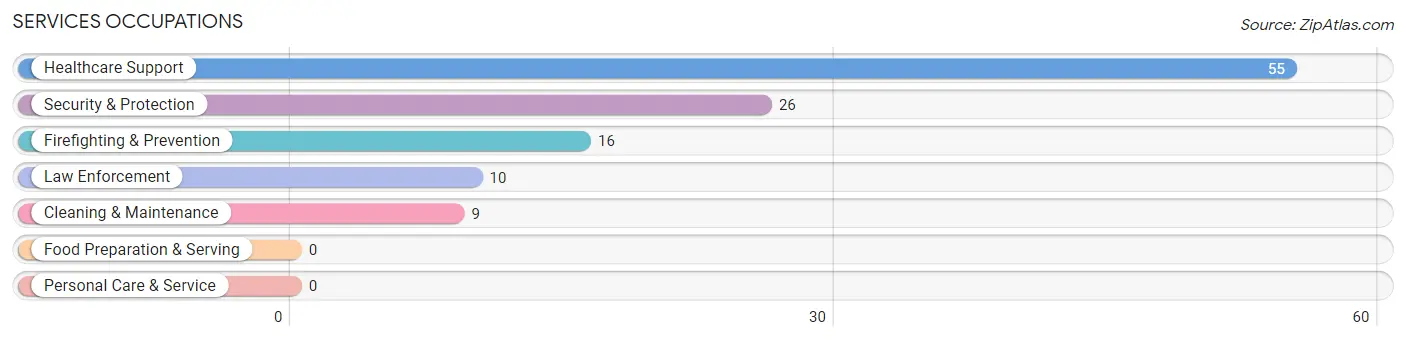
Services Occupations
The most common Services occupations in Kenvil are Healthcare Support (55 | 6.6%), Security & Protection (26 | 3.1%), Firefighting & Prevention (16 | 1.9%), Law Enforcement (10 | 1.2%), and Cleaning & Maintenance (9 | 1.1%).
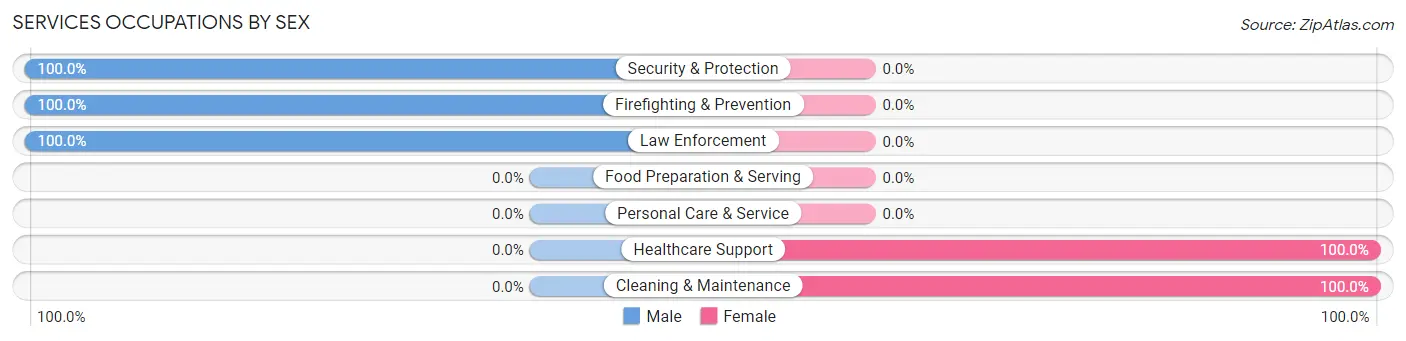
Services Occupations by Sex
Within the Services occupations in Kenvil, the most male-oriented occupations are Security & Protection (100.0%), Firefighting & Prevention (100.0%), and Law Enforcement (100.0%), while the most female-oriented occupations are Healthcare Support (100.0%), and Cleaning & Maintenance (100.0%).
| Occupation | Male | Female |
| Healthcare Support | 0 (0.0%) | 55 (100.0%) |
| Security & Protection | 26 (100.0%) | 0 (0.0%) |
| Firefighting & Prevention | 16 (100.0%) | 0 (0.0%) |
| Law Enforcement | 10 (100.0%) | 0 (0.0%) |
| Food Preparation & Serving | 0 (0.0%) | 0 (0.0%) |
| Cleaning & Maintenance | 0 (0.0%) | 9 (100.0%) |
| Personal Care & Service | 0 (0.0%) | 0 (0.0%) |
| Total (Category) | 26 (28.9%) | 64 (71.1%) |
| Total (Overall) | 555 (66.9%) | 275 (33.1%) |
Sales and Office Occupations
The most common Sales and Office occupations in Kenvil are Office & Administration (134 | 16.1%), and Sales & Related (55 | 6.6%).
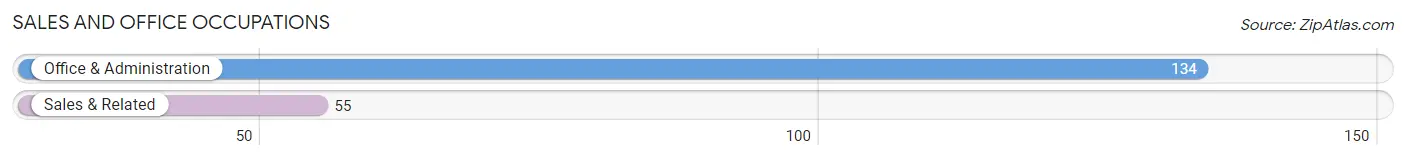
Sales and Office Occupations by Sex
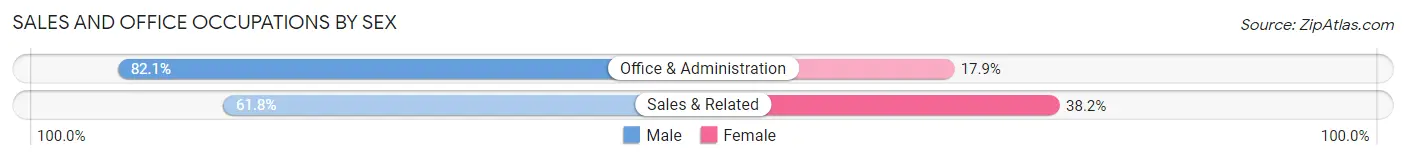
| Occupation | Male | Female |
| Sales & Related | 34 (61.8%) | 21 (38.2%) |
| Office & Administration | 110 (82.1%) | 24 (17.9%) |
| Total (Category) | 144 (76.2%) | 45 (23.8%) |
| Total (Overall) | 555 (66.9%) | 275 (33.1%) |
Natural Resources, Construction and Maintenance Occupations
The most common Natural Resources, Construction and Maintenance occupations in Kenvil are Construction & Extraction (115 | 13.9%), and Installation, Maintenance & Repair (17 | 2.1%).
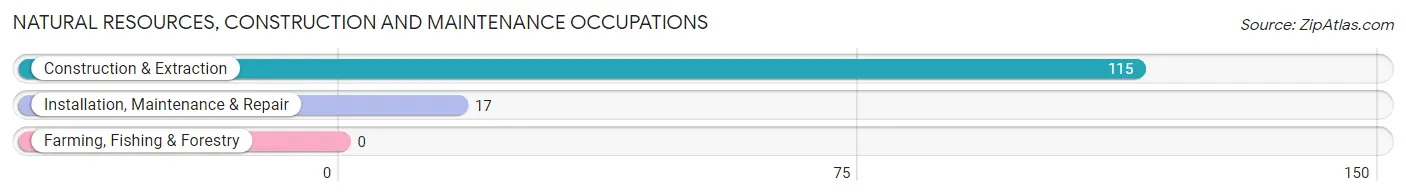
Natural Resources, Construction and Maintenance Occupations by Sex
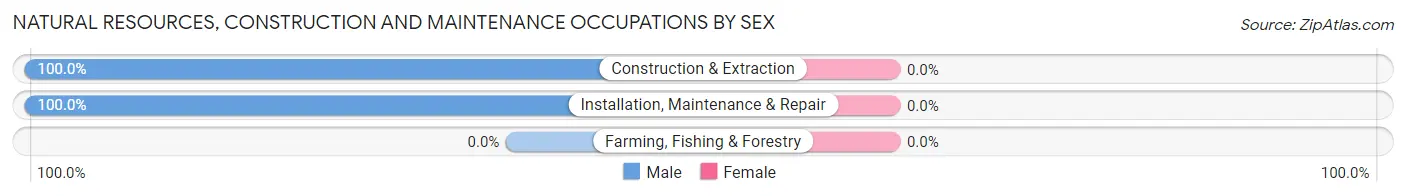
| Occupation | Male | Female |
| Farming, Fishing & Forestry | 0 (0.0%) | 0 (0.0%) |
| Construction & Extraction | 115 (100.0%) | 0 (0.0%) |
| Installation, Maintenance & Repair | 17 (100.0%) | 0 (0.0%) |
| Total (Category) | 132 (100.0%) | 0 (0.0%) |
| Total (Overall) | 555 (66.9%) | 275 (33.1%) |
Production, Transportation and Moving Occupations
The most common Production, Transportation and Moving occupations in Kenvil are Transportation (55 | 6.6%), and Production (47 | 5.7%).
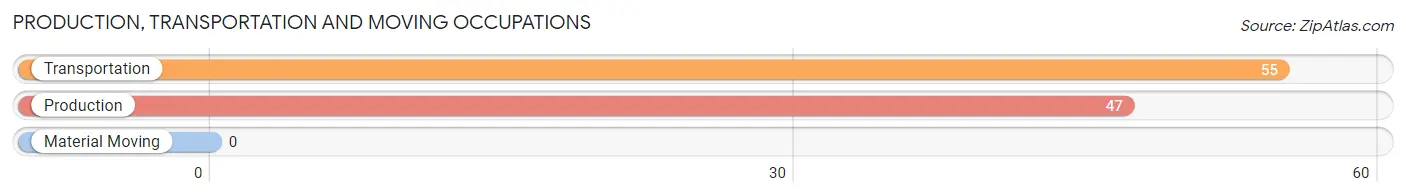
Production, Transportation and Moving Occupations by Sex
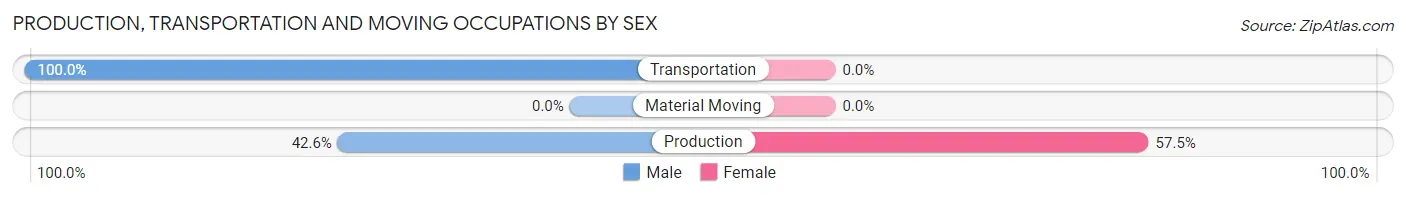
| Occupation | Male | Female |
| Production | 20 (42.5%) | 27 (57.5%) |
| Transportation | 55 (100.0%) | 0 (0.0%) |
| Material Moving | 0 (0.0%) | 0 (0.0%) |
| Total (Category) | 75 (73.5%) | 27 (26.5%) |
| Total (Overall) | 555 (66.9%) | 275 (33.1%) |
Employment Industries by Sex in Kenvil
Employment Industries in Kenvil
The major employment industries in Kenvil include Transportation & Warehousing (170 | 20.5%), Health Care & Social Assistance (165 | 19.9%), Construction (82 | 9.9%), Information (63 | 7.6%), and Professional & Scientific (59 | 7.1%).
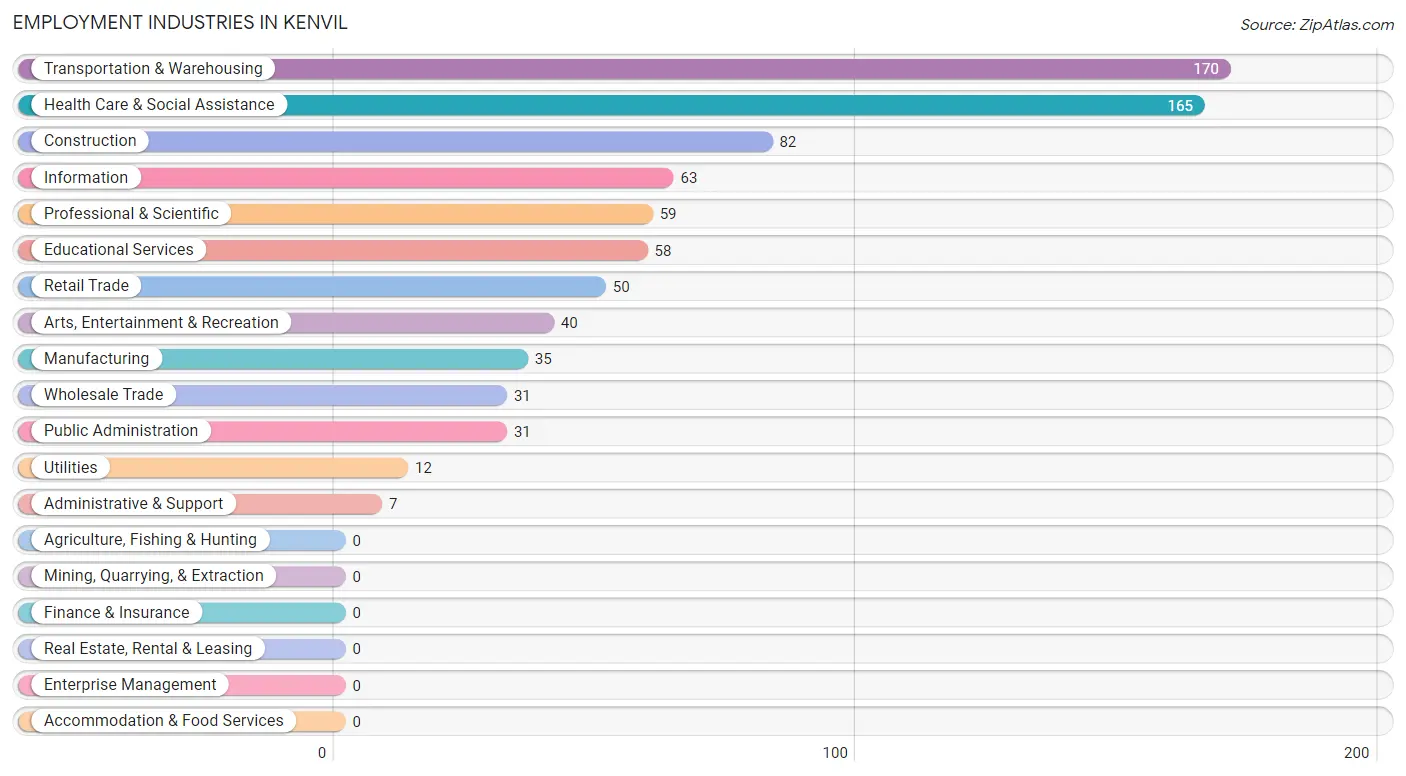
Employment Industries by Sex in Kenvil
The Kenvil industries that see more men than women are Construction (100.0%), Transportation & Warehousing (100.0%), and Utilities (100.0%), whereas the industries that tend to have a higher number of women are Health Care & Social Assistance (95.8%), Manufacturing (77.1%), and Retail Trade (42.0%).
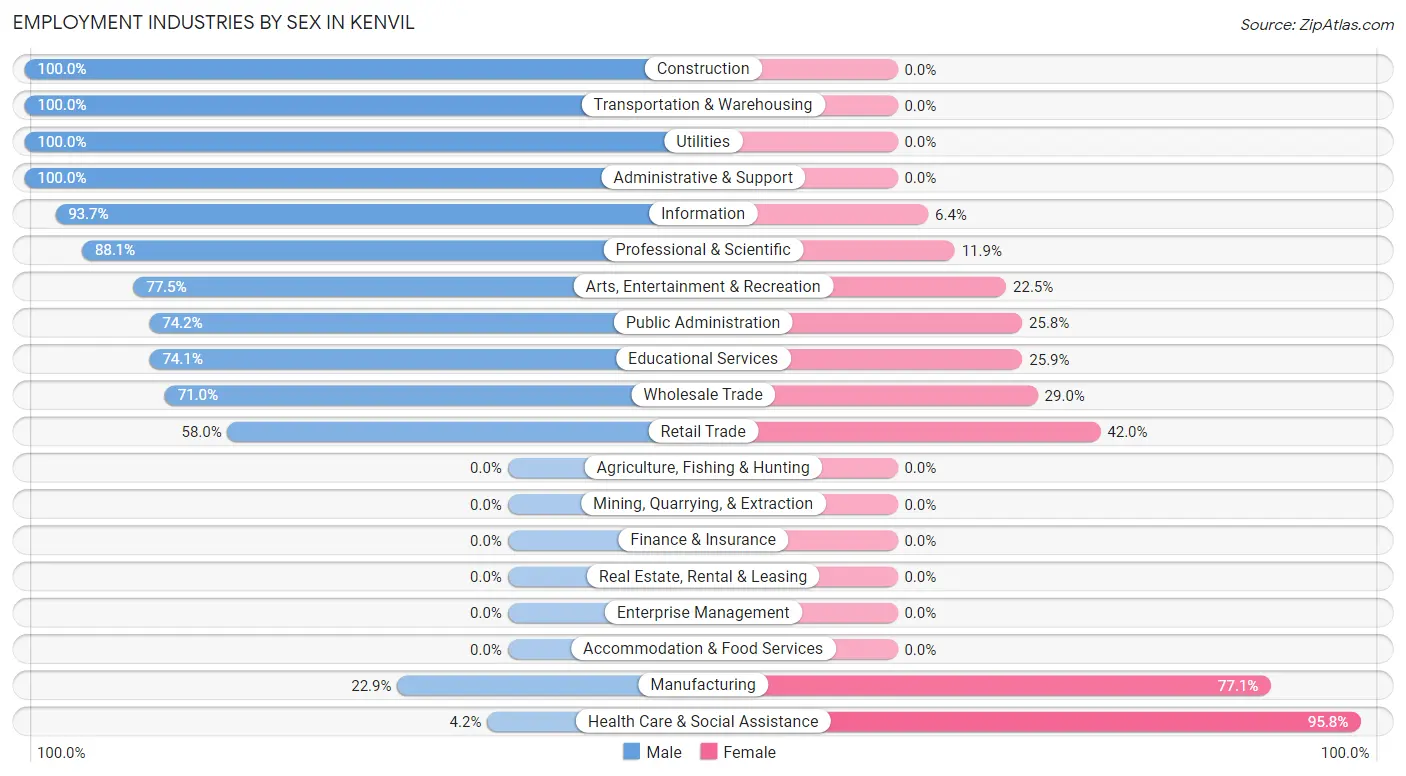
| Industry | Male | Female |
| Agriculture, Fishing & Hunting | 0 (0.0%) | 0 (0.0%) |
| Mining, Quarrying, & Extraction | 0 (0.0%) | 0 (0.0%) |
| Construction | 82 (100.0%) | 0 (0.0%) |
| Manufacturing | 8 (22.9%) | 27 (77.1%) |
| Wholesale Trade | 22 (71.0%) | 9 (29.0%) |
| Retail Trade | 29 (58.0%) | 21 (42.0%) |
| Transportation & Warehousing | 170 (100.0%) | 0 (0.0%) |
| Utilities | 12 (100.0%) | 0 (0.0%) |
| Information | 59 (93.6%) | 4 (6.4%) |
| Finance & Insurance | 0 (0.0%) | 0 (0.0%) |
| Real Estate, Rental & Leasing | 0 (0.0%) | 0 (0.0%) |
| Professional & Scientific | 52 (88.1%) | 7 (11.9%) |
| Enterprise Management | 0 (0.0%) | 0 (0.0%) |
| Administrative & Support | 7 (100.0%) | 0 (0.0%) |
| Educational Services | 43 (74.1%) | 15 (25.9%) |
| Health Care & Social Assistance | 7 (4.2%) | 158 (95.8%) |
| Arts, Entertainment & Recreation | 31 (77.5%) | 9 (22.5%) |
| Accommodation & Food Services | 0 (0.0%) | 0 (0.0%) |
| Public Administration | 23 (74.2%) | 8 (25.8%) |
| Total | 555 (66.9%) | 275 (33.1%) |
Education in Kenvil
School Enrollment in Kenvil
The most common levels of schooling among the 336 students in Kenvil are middle school (93 | 27.7%), elementary school (81 | 24.1%), and college / undergraduate (59 | 17.6%).
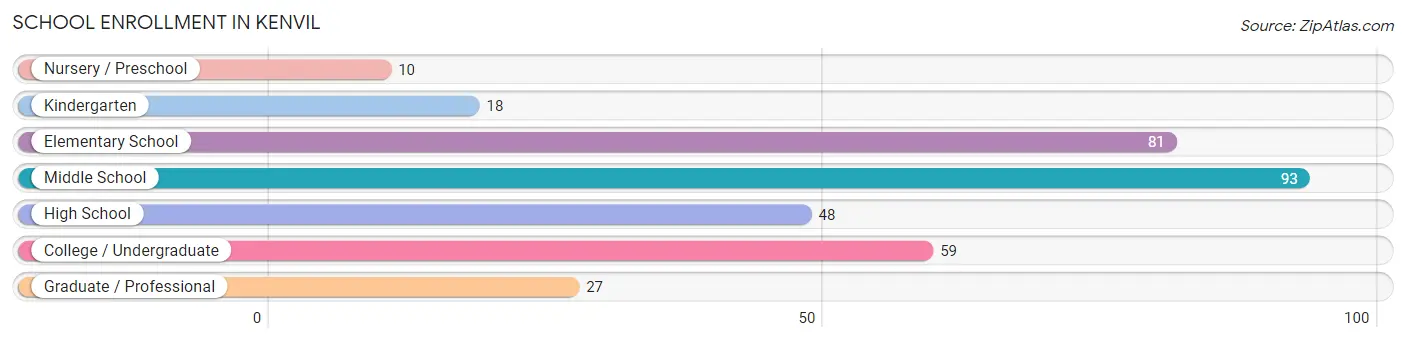
| School Level | # Students | % Students |
| Nursery / Preschool | 10 | 3.0% |
| Kindergarten | 18 | 5.4% |
| Elementary School | 81 | 24.1% |
| Middle School | 93 | 27.7% |
| High School | 48 | 14.3% |
| College / Undergraduate | 59 | 17.6% |
| Graduate / Professional | 27 | 8.0% |
| Total | 336 | 100.0% |
School Enrollment by Age by Funding Source in Kenvil
Out of a total of 336 students who are enrolled in schools in Kenvil, 34 (10.1%) attend a private institution, while the remaining 302 (89.9%) are enrolled in public schools. The age group of 3 to 4 year olds has the highest likelihood of being enrolled in private schools, with 10 (100.0% in the age bracket) enrolled. Conversely, the age group of 5 to 9 year old has the lowest likelihood of being enrolled in a private school, with 87 (100.0% in the age bracket) attending a public institution.
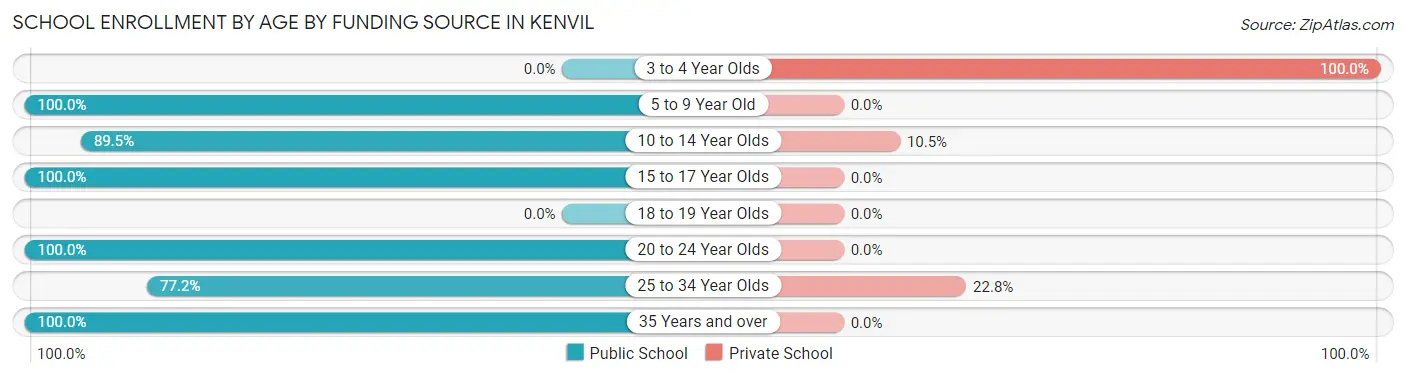
| Age Bracket | Public School | Private School |
| 3 to 4 Year Olds | 0 (0.0%) | 10 (100.0%) |
| 5 to 9 Year Old | 87 (100.0%) | 0 (0.0%) |
| 10 to 14 Year Olds | 94 (89.5%) | 11 (10.5%) |
| 15 to 17 Year Olds | 48 (100.0%) | 0 (0.0%) |
| 18 to 19 Year Olds | 0 (0.0%) | 0 (0.0%) |
| 20 to 24 Year Olds | 14 (100.0%) | 0 (0.0%) |
| 25 to 34 Year Olds | 44 (77.2%) | 13 (22.8%) |
| 35 Years and over | 15 (100.0%) | 0 (0.0%) |
| Total | 302 (89.9%) | 34 (10.1%) |
Educational Attainment by Field of Study in Kenvil
Business (59 | 19.5%), education (51 | 16.8%), psychology (35 | 11.6%), science & technology (31 | 10.2%), and engineering (22 | 7.3%) are the most common fields of study among 303 individuals in Kenvil who have obtained a bachelor's degree or higher.
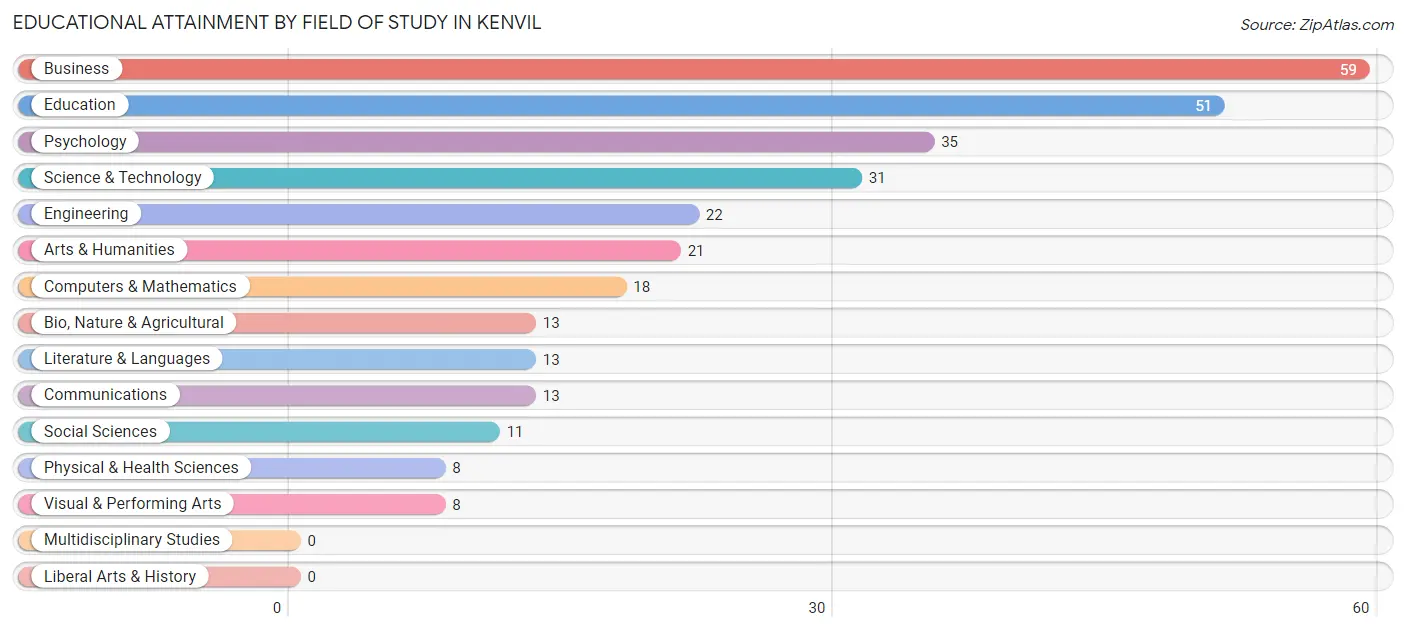
| Field of Study | # Graduates | % Graduates |
| Computers & Mathematics | 18 | 5.9% |
| Bio, Nature & Agricultural | 13 | 4.3% |
| Physical & Health Sciences | 8 | 2.6% |
| Psychology | 35 | 11.6% |
| Social Sciences | 11 | 3.6% |
| Engineering | 22 | 7.3% |
| Multidisciplinary Studies | 0 | 0.0% |
| Science & Technology | 31 | 10.2% |
| Business | 59 | 19.5% |
| Education | 51 | 16.8% |
| Literature & Languages | 13 | 4.3% |
| Liberal Arts & History | 0 | 0.0% |
| Visual & Performing Arts | 8 | 2.6% |
| Communications | 13 | 4.3% |
| Arts & Humanities | 21 | 6.9% |
| Total | 303 | 100.0% |
Transportation & Commute in Kenvil
Vehicle Availability by Sex in Kenvil
The most prevalent vehicle ownership categories in Kenvil are males with 2 vehicles (326, accounting for 59.5%) and females with 2 vehicles (224, making up 118.5%).
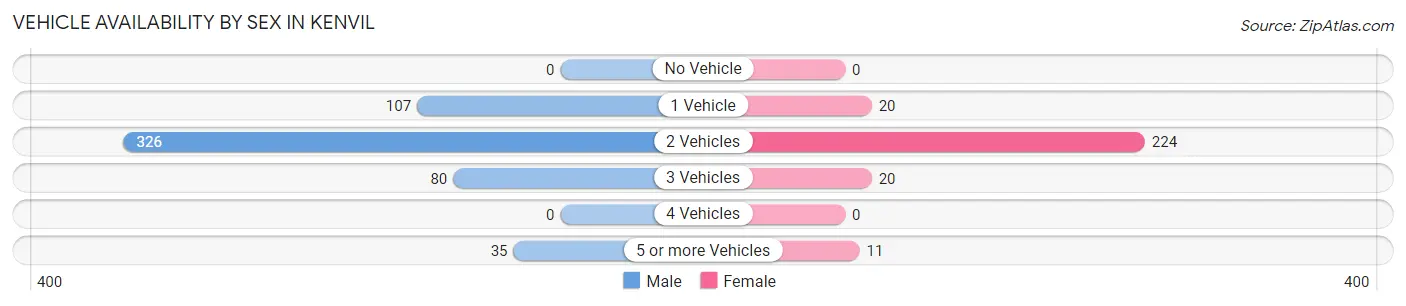
| Vehicles Available | Male | Female |
| No Vehicle | 0 (0.0%) | 0 (0.0%) |
| 1 Vehicle | 107 (19.5%) | 20 (7.3%) |
| 2 Vehicles | 326 (59.5%) | 224 (81.5%) |
| 3 Vehicles | 80 (14.6%) | 20 (7.3%) |
| 4 Vehicles | 0 (0.0%) | 0 (0.0%) |
| 5 or more Vehicles | 35 (6.4%) | 11 (4.0%) |
| Total | 548 (100.0%) | 275 (100.0%) |
Commute Time in Kenvil
The most frequently occuring commute durations in Kenvil are 20 to 24 minutes (131 commuters, 16.5%), 60 to 89 minutes (125 commuters, 15.8%), and 10 to 14 minutes (110 commuters, 13.9%).
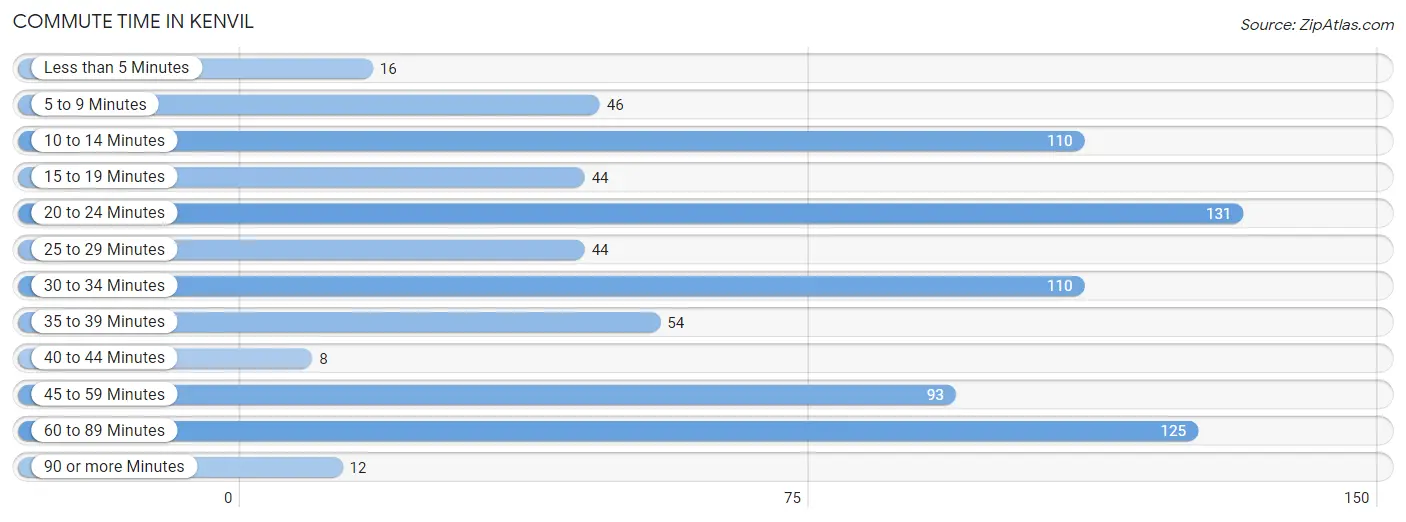
| Commute Time | # Commuters | % Commuters |
| Less than 5 Minutes | 16 | 2.0% |
| 5 to 9 Minutes | 46 | 5.8% |
| 10 to 14 Minutes | 110 | 13.9% |
| 15 to 19 Minutes | 44 | 5.6% |
| 20 to 24 Minutes | 131 | 16.5% |
| 25 to 29 Minutes | 44 | 5.6% |
| 30 to 34 Minutes | 110 | 13.9% |
| 35 to 39 Minutes | 54 | 6.8% |
| 40 to 44 Minutes | 8 | 1.0% |
| 45 to 59 Minutes | 93 | 11.7% |
| 60 to 89 Minutes | 125 | 15.8% |
| 90 or more Minutes | 12 | 1.5% |
Commute Time by Sex in Kenvil
The most common commute times in Kenvil are 20 to 24 minutes (131 commuters, 25.1%) for males and 30 to 34 minutes (106 commuters, 39.1%) for females.
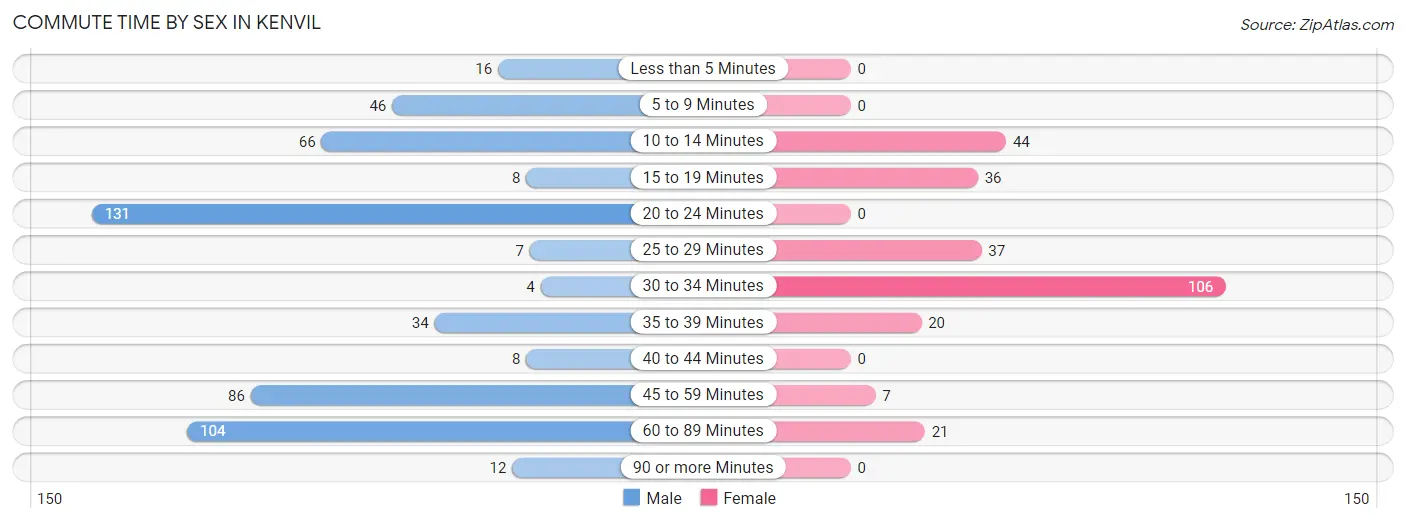
| Commute Time | Male | Female |
| Less than 5 Minutes | 16 (3.1%) | 0 (0.0%) |
| 5 to 9 Minutes | 46 (8.8%) | 0 (0.0%) |
| 10 to 14 Minutes | 66 (12.6%) | 44 (16.2%) |
| 15 to 19 Minutes | 8 (1.5%) | 36 (13.3%) |
| 20 to 24 Minutes | 131 (25.1%) | 0 (0.0%) |
| 25 to 29 Minutes | 7 (1.3%) | 37 (13.7%) |
| 30 to 34 Minutes | 4 (0.8%) | 106 (39.1%) |
| 35 to 39 Minutes | 34 (6.5%) | 20 (7.4%) |
| 40 to 44 Minutes | 8 (1.5%) | 0 (0.0%) |
| 45 to 59 Minutes | 86 (16.5%) | 7 (2.6%) |
| 60 to 89 Minutes | 104 (19.9%) | 21 (7.7%) |
| 90 or more Minutes | 12 (2.3%) | 0 (0.0%) |
Time of Departure to Work by Sex in Kenvil
The most frequent times of departure to work in Kenvil are 8:00 AM to 8:29 AM (94, 18.0%) for males and 8:30 AM to 8:59 AM (83, 30.6%) for females.
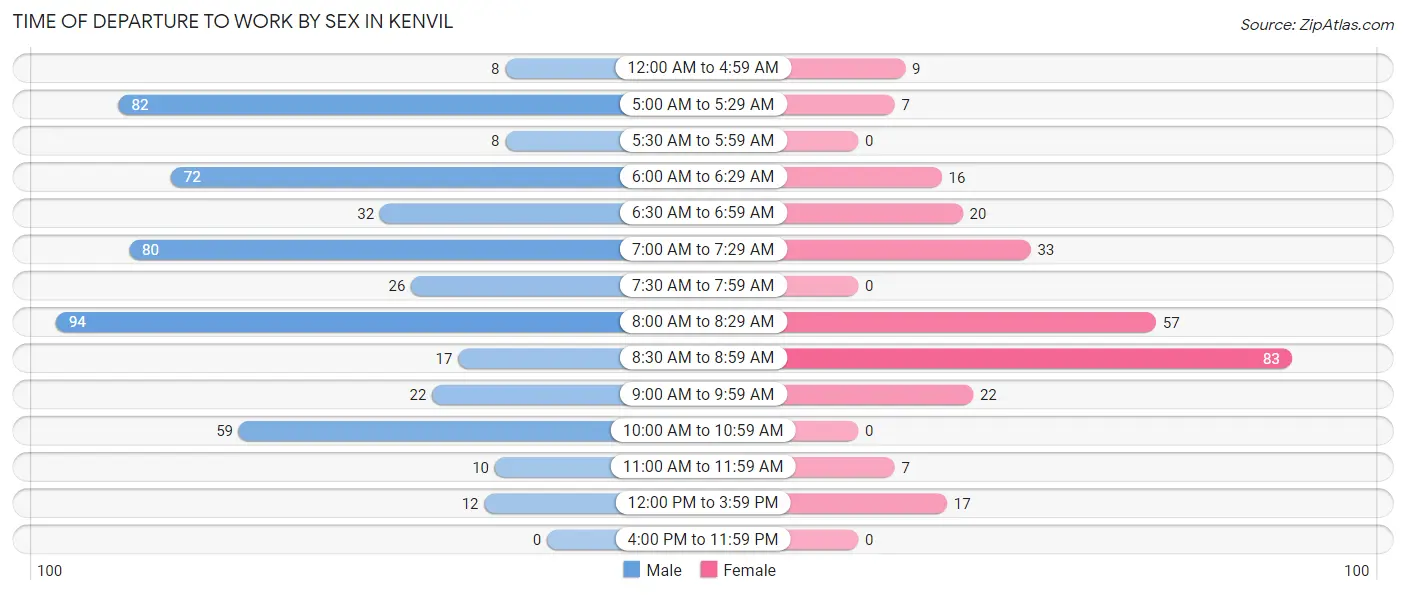
| Time of Departure | Male | Female |
| 12:00 AM to 4:59 AM | 8 (1.5%) | 9 (3.3%) |
| 5:00 AM to 5:29 AM | 82 (15.7%) | 7 (2.6%) |
| 5:30 AM to 5:59 AM | 8 (1.5%) | 0 (0.0%) |
| 6:00 AM to 6:29 AM | 72 (13.8%) | 16 (5.9%) |
| 6:30 AM to 6:59 AM | 32 (6.1%) | 20 (7.4%) |
| 7:00 AM to 7:29 AM | 80 (15.3%) | 33 (12.2%) |
| 7:30 AM to 7:59 AM | 26 (5.0%) | 0 (0.0%) |
| 8:00 AM to 8:29 AM | 94 (18.0%) | 57 (21.0%) |
| 8:30 AM to 8:59 AM | 17 (3.3%) | 83 (30.6%) |
| 9:00 AM to 9:59 AM | 22 (4.2%) | 22 (8.1%) |
| 10:00 AM to 10:59 AM | 59 (11.3%) | 0 (0.0%) |
| 11:00 AM to 11:59 AM | 10 (1.9%) | 7 (2.6%) |
| 12:00 PM to 3:59 PM | 12 (2.3%) | 17 (6.3%) |
| 4:00 PM to 11:59 PM | 0 (0.0%) | 0 (0.0%) |
| Total | 522 (100.0%) | 271 (100.0%) |
Housing Occupancy in Kenvil
Occupancy by Ownership in Kenvil
Of the total 681 dwellings in Kenvil, owner-occupied units account for 553 (81.2%), while renter-occupied units make up 128 (18.8%).
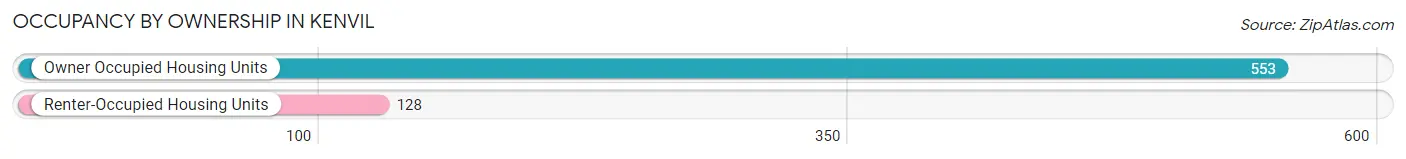
| Occupancy | # Housing Units | % Housing Units |
| Owner Occupied Housing Units | 553 | 81.2% |
| Renter-Occupied Housing Units | 128 | 18.8% |
| Total Occupied Housing Units | 681 | 100.0% |
Occupancy by Household Size in Kenvil
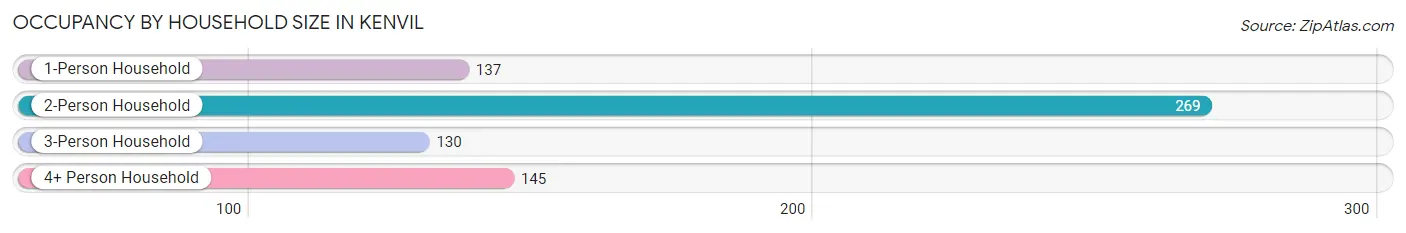
| Household Size | # Housing Units | % Housing Units |
| 1-Person Household | 137 | 20.1% |
| 2-Person Household | 269 | 39.5% |
| 3-Person Household | 130 | 19.1% |
| 4+ Person Household | 145 | 21.3% |
| Total Housing Units | 681 | 100.0% |
Occupancy by Ownership by Household Size in Kenvil
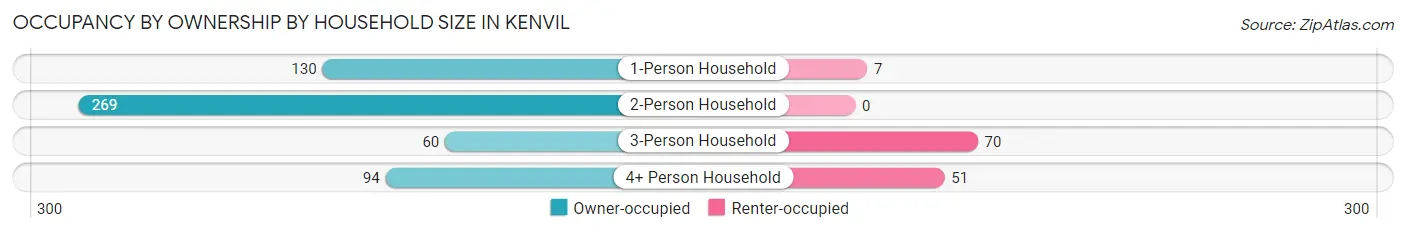
| Household Size | Owner-occupied | Renter-occupied |
| 1-Person Household | 130 (94.9%) | 7 (5.1%) |
| 2-Person Household | 269 (100.0%) | 0 (0.0%) |
| 3-Person Household | 60 (46.2%) | 70 (53.8%) |
| 4+ Person Household | 94 (64.8%) | 51 (35.2%) |
| Total Housing Units | 553 (81.2%) | 128 (18.8%) |
Occupancy by Educational Attainment in Kenvil
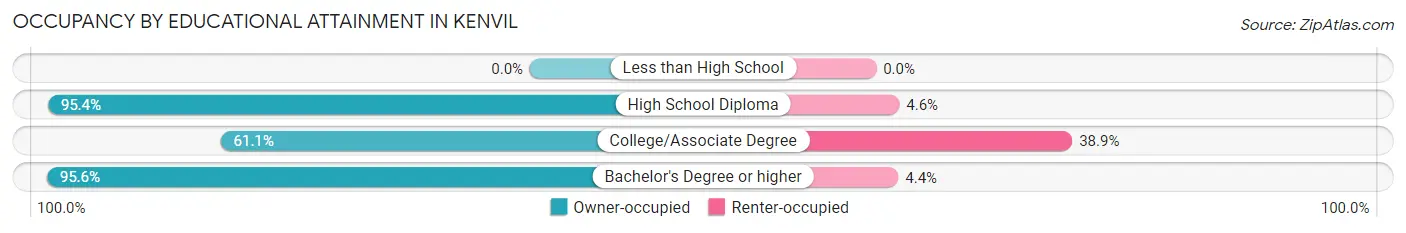
| Household Size | Owner-occupied | Renter-occupied |
| Less than High School | 0 (0.0%) | 0 (0.0%) |
| High School Diploma | 228 (95.4%) | 11 (4.6%) |
| College/Associate Degree | 173 (61.1%) | 110 (38.9%) |
| Bachelor's Degree or higher | 152 (95.6%) | 7 (4.4%) |
Occupancy by Age of Householder in Kenvil
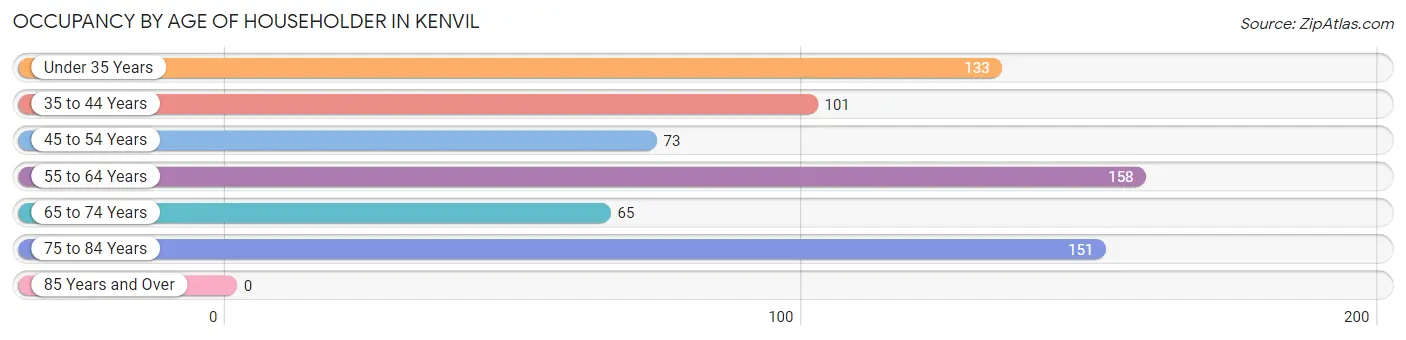
| Age Bracket | # Households | % Households |
| Under 35 Years | 133 | 19.5% |
| 35 to 44 Years | 101 | 14.8% |
| 45 to 54 Years | 73 | 10.7% |
| 55 to 64 Years | 158 | 23.2% |
| 65 to 74 Years | 65 | 9.5% |
| 75 to 84 Years | 151 | 22.2% |
| 85 Years and Over | 0 | 0.0% |
| Total | 681 | 100.0% |
Housing Finances in Kenvil
Median Income by Occupancy in Kenvil
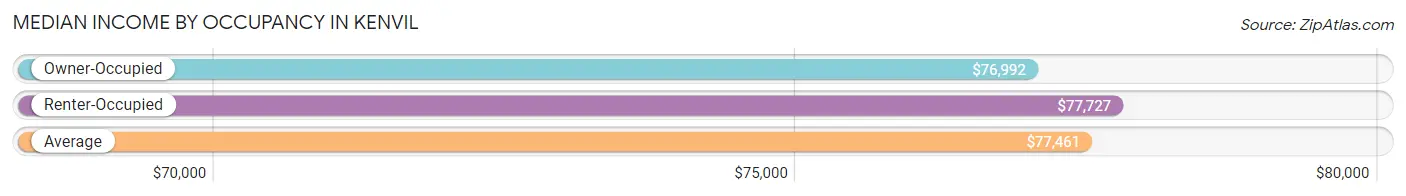
| Occupancy Type | # Households | Median Income |
| Owner-Occupied | 553 (81.2%) | $76,992 |
| Renter-Occupied | 128 (18.8%) | $77,727 |
| Average | 681 (100.0%) | $77,461 |
Occupancy by Householder Income Bracket in Kenvil
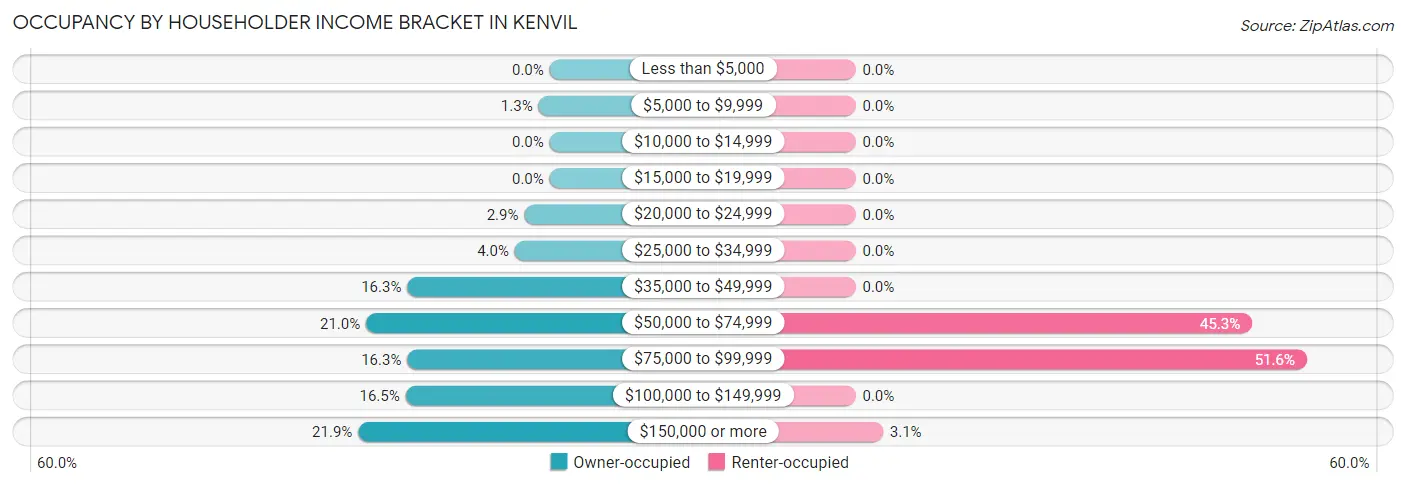
| Income Bracket | Owner-occupied | Renter-occupied |
| Less than $5,000 | 0 (0.0%) | 0 (0.0%) |
| $5,000 to $9,999 | 7 (1.3%) | 0 (0.0%) |
| $10,000 to $14,999 | 0 (0.0%) | 0 (0.0%) |
| $15,000 to $19,999 | 0 (0.0%) | 0 (0.0%) |
| $20,000 to $24,999 | 16 (2.9%) | 0 (0.0%) |
| $25,000 to $34,999 | 22 (4.0%) | 0 (0.0%) |
| $35,000 to $49,999 | 90 (16.3%) | 0 (0.0%) |
| $50,000 to $74,999 | 116 (21.0%) | 58 (45.3%) |
| $75,000 to $99,999 | 90 (16.3%) | 66 (51.6%) |
| $100,000 to $149,999 | 91 (16.5%) | 0 (0.0%) |
| $150,000 or more | 121 (21.9%) | 4 (3.1%) |
| Total | 553 (100.0%) | 128 (100.0%) |
Monthly Housing Cost Tiers in Kenvil
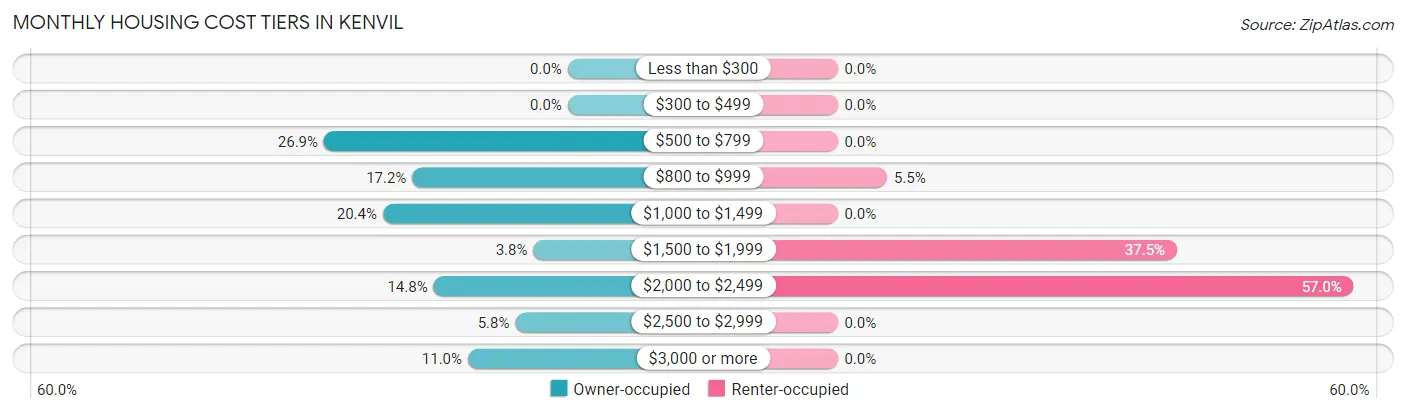
| Monthly Cost | Owner-occupied | Renter-occupied |
| Less than $300 | 0 (0.0%) | 0 (0.0%) |
| $300 to $499 | 0 (0.0%) | 0 (0.0%) |
| $500 to $799 | 149 (26.9%) | 0 (0.0%) |
| $800 to $999 | 95 (17.2%) | 7 (5.5%) |
| $1,000 to $1,499 | 113 (20.4%) | 0 (0.0%) |
| $1,500 to $1,999 | 21 (3.8%) | 48 (37.5%) |
| $2,000 to $2,499 | 82 (14.8%) | 73 (57.0%) |
| $2,500 to $2,999 | 32 (5.8%) | 0 (0.0%) |
| $3,000 or more | 61 (11.0%) | 0 (0.0%) |
| Total | 553 (100.0%) | 128 (100.0%) |
Physical Housing Characteristics in Kenvil
Housing Structures in Kenvil
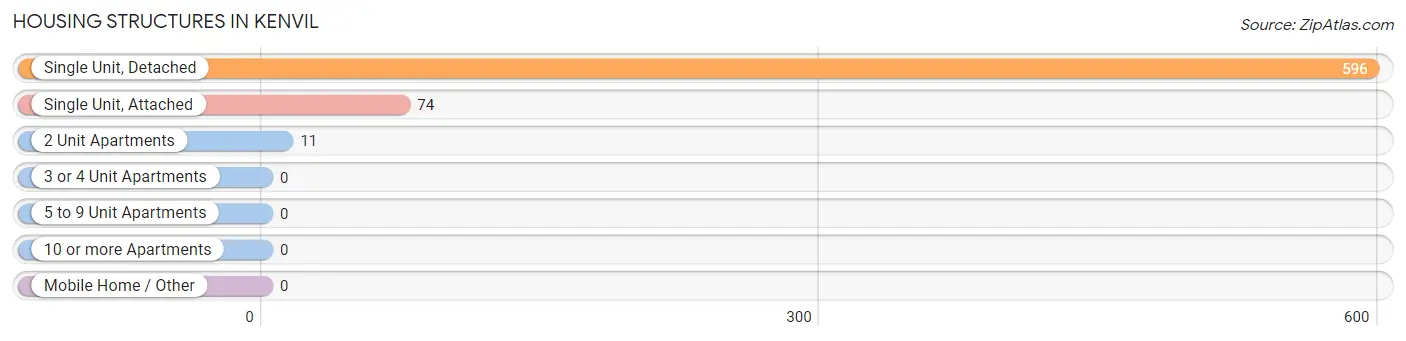
| Structure Type | # Housing Units | % Housing Units |
| Single Unit, Detached | 596 | 87.5% |
| Single Unit, Attached | 74 | 10.9% |
| 2 Unit Apartments | 11 | 1.6% |
| 3 or 4 Unit Apartments | 0 | 0.0% |
| 5 to 9 Unit Apartments | 0 | 0.0% |
| 10 or more Apartments | 0 | 0.0% |
| Mobile Home / Other | 0 | 0.0% |
| Total | 681 | 100.0% |
Housing Structures by Occupancy in Kenvil
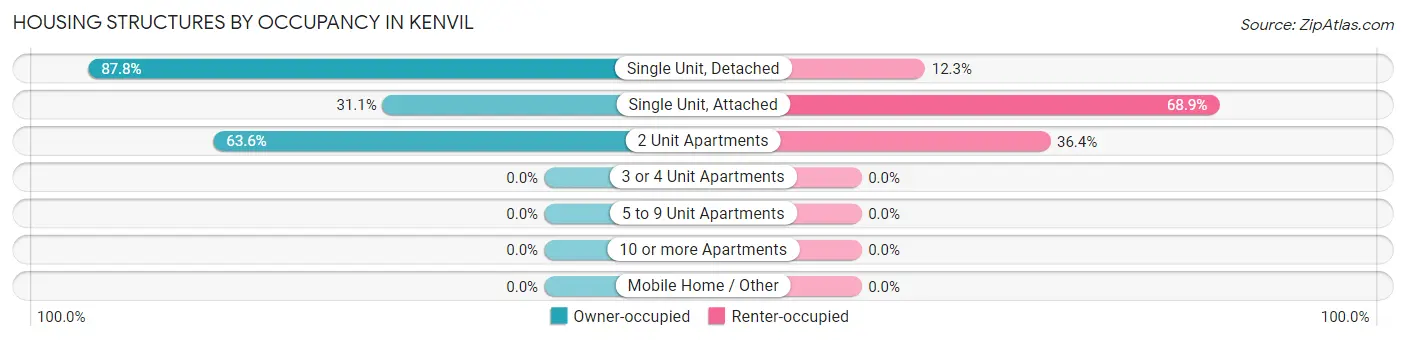
| Structure Type | Owner-occupied | Renter-occupied |
| Single Unit, Detached | 523 (87.7%) | 73 (12.2%) |
| Single Unit, Attached | 23 (31.1%) | 51 (68.9%) |
| 2 Unit Apartments | 7 (63.6%) | 4 (36.4%) |
| 3 or 4 Unit Apartments | 0 (0.0%) | 0 (0.0%) |
| 5 to 9 Unit Apartments | 0 (0.0%) | 0 (0.0%) |
| 10 or more Apartments | 0 (0.0%) | 0 (0.0%) |
| Mobile Home / Other | 0 (0.0%) | 0 (0.0%) |
| Total | 553 (81.2%) | 128 (18.8%) |
Housing Structures by Number of Rooms in Kenvil
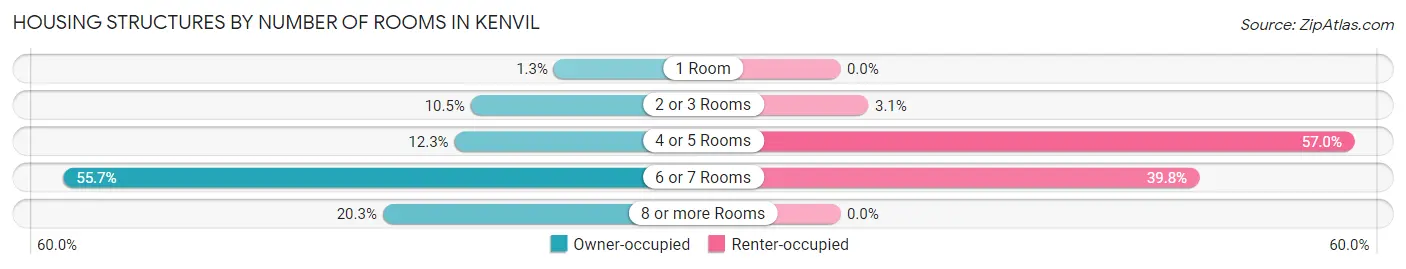
| Number of Rooms | Owner-occupied | Renter-occupied |
| 1 Room | 7 (1.3%) | 0 (0.0%) |
| 2 or 3 Rooms | 58 (10.5%) | 4 (3.1%) |
| 4 or 5 Rooms | 68 (12.3%) | 73 (57.0%) |
| 6 or 7 Rooms | 308 (55.7%) | 51 (39.8%) |
| 8 or more Rooms | 112 (20.3%) | 0 (0.0%) |
| Total | 553 (100.0%) | 128 (100.0%) |
Housing Structure by Heating Type in Kenvil
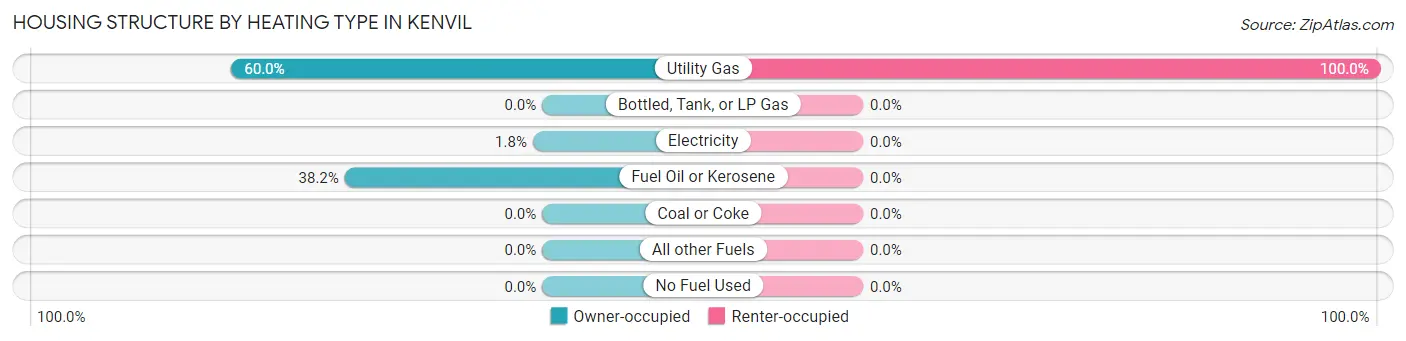
| Heating Type | Owner-occupied | Renter-occupied |
| Utility Gas | 332 (60.0%) | 128 (100.0%) |
| Bottled, Tank, or LP Gas | 0 (0.0%) | 0 (0.0%) |
| Electricity | 10 (1.8%) | 0 (0.0%) |
| Fuel Oil or Kerosene | 211 (38.2%) | 0 (0.0%) |
| Coal or Coke | 0 (0.0%) | 0 (0.0%) |
| All other Fuels | 0 (0.0%) | 0 (0.0%) |
| No Fuel Used | 0 (0.0%) | 0 (0.0%) |
| Total | 553 (100.0%) | 128 (100.0%) |
Household Vehicle Usage in Kenvil
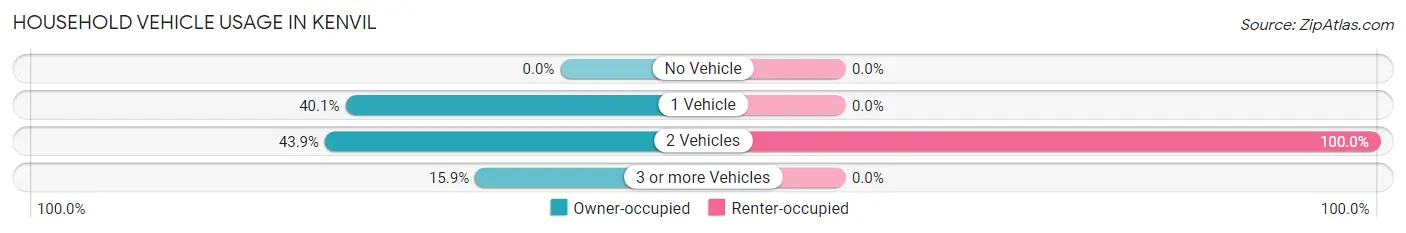
| Vehicles per Household | Owner-occupied | Renter-occupied |
| No Vehicle | 0 (0.0%) | 0 (0.0%) |
| 1 Vehicle | 222 (40.1%) | 0 (0.0%) |
| 2 Vehicles | 243 (43.9%) | 128 (100.0%) |
| 3 or more Vehicles | 88 (15.9%) | 0 (0.0%) |
| Total | 553 (100.0%) | 128 (100.0%) |
Real Estate & Mortgages in Kenvil
Real Estate and Mortgage Overview in Kenvil
| Characteristic | Without Mortgage | With Mortgage |
| Housing Units | 320 | 233 |
| Median Property Value | $291,100 | $365,000 |
| Median Household Income | $52,039 | $80 |
| Monthly Housing Costs | $912 | $61 |
| Real Estate Taxes | $6,397 | $0 |
Property Value by Mortgage Status in Kenvil
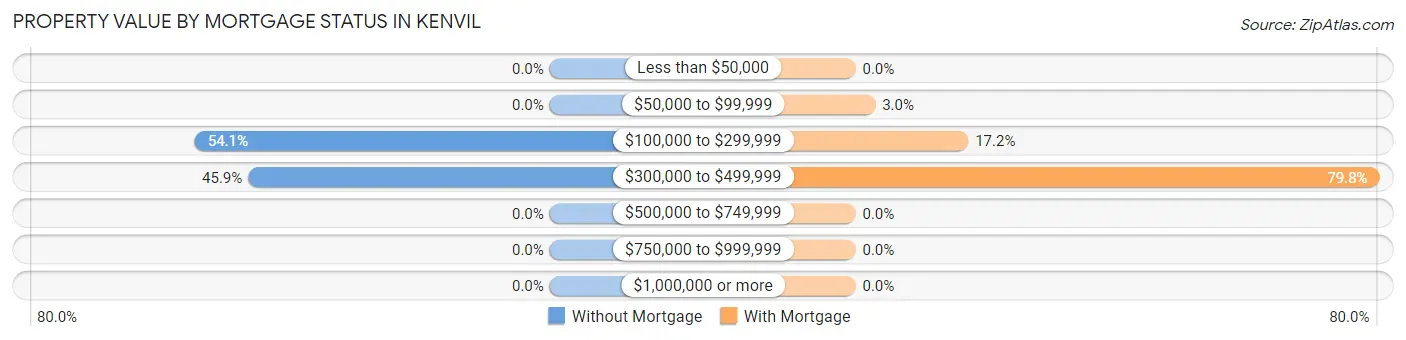
| Property Value | Without Mortgage | With Mortgage |
| Less than $50,000 | 0 (0.0%) | 0 (0.0%) |
| $50,000 to $99,999 | 0 (0.0%) | 7 (3.0%) |
| $100,000 to $299,999 | 173 (54.1%) | 40 (17.2%) |
| $300,000 to $499,999 | 147 (45.9%) | 186 (79.8%) |
| $500,000 to $749,999 | 0 (0.0%) | 0 (0.0%) |
| $750,000 to $999,999 | 0 (0.0%) | 0 (0.0%) |
| $1,000,000 or more | 0 (0.0%) | 0 (0.0%) |
| Total | 320 (100.0%) | 233 (100.0%) |
Household Income by Mortgage Status in Kenvil
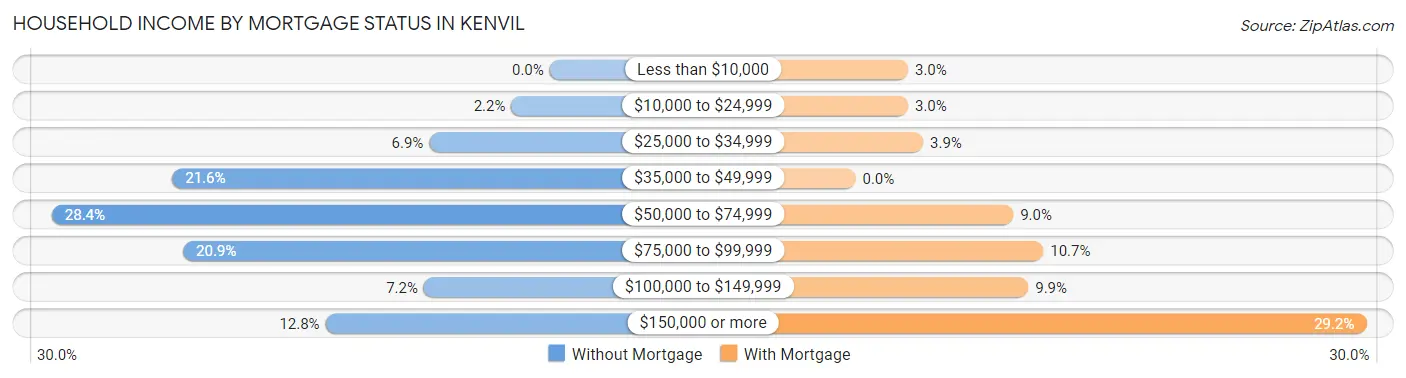
| Household Income | Without Mortgage | With Mortgage |
| Less than $10,000 | 0 (0.0%) | 7 (3.0%) |
| $10,000 to $24,999 | 7 (2.2%) | 7 (3.0%) |
| $25,000 to $34,999 | 22 (6.9%) | 9 (3.9%) |
| $35,000 to $49,999 | 69 (21.6%) | 0 (0.0%) |
| $50,000 to $74,999 | 91 (28.4%) | 21 (9.0%) |
| $75,000 to $99,999 | 67 (20.9%) | 25 (10.7%) |
| $100,000 to $149,999 | 23 (7.2%) | 23 (9.9%) |
| $150,000 or more | 41 (12.8%) | 68 (29.2%) |
| Total | 320 (100.0%) | 233 (100.0%) |
Property Value to Household Income Ratio in Kenvil
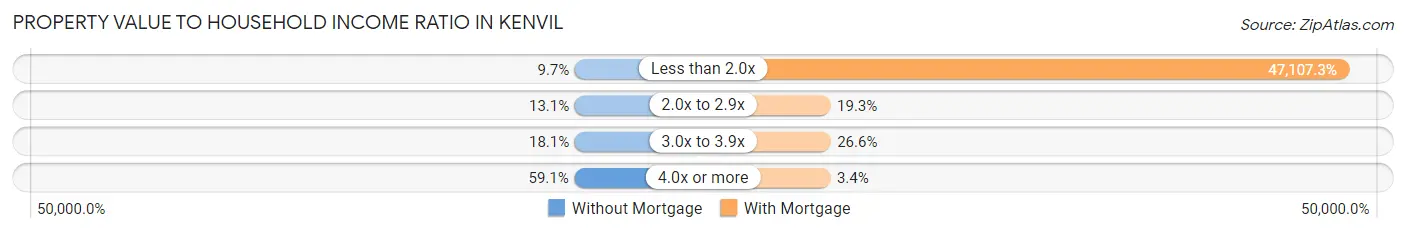
| Value-to-Income Ratio | Without Mortgage | With Mortgage |
| Less than 2.0x | 31 (9.7%) | 109,760 (47,107.3%) |
| 2.0x to 2.9x | 42 (13.1%) | 45 (19.3%) |
| 3.0x to 3.9x | 58 (18.1%) | 62 (26.6%) |
| 4.0x or more | 189 (59.1%) | 8 (3.4%) |
| Total | 320 (100.0%) | 233 (100.0%) |
Real Estate Taxes by Mortgage Status in Kenvil
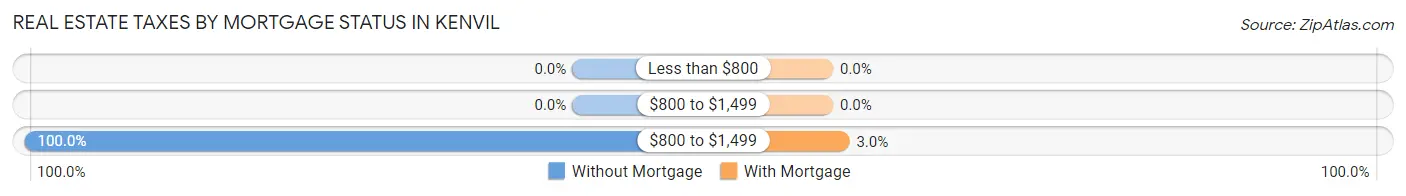
| Property Taxes | Without Mortgage | With Mortgage |
| Less than $800 | 0 (0.0%) | 0 (0.0%) |
| $800 to $1,499 | 0 (0.0%) | 0 (0.0%) |
| $800 to $1,499 | 320 (100.0%) | 7 (3.0%) |
| Total | 320 (100.0%) | 233 (100.0%) |
Health & Disability in Kenvil
Health Insurance Coverage by Age in Kenvil
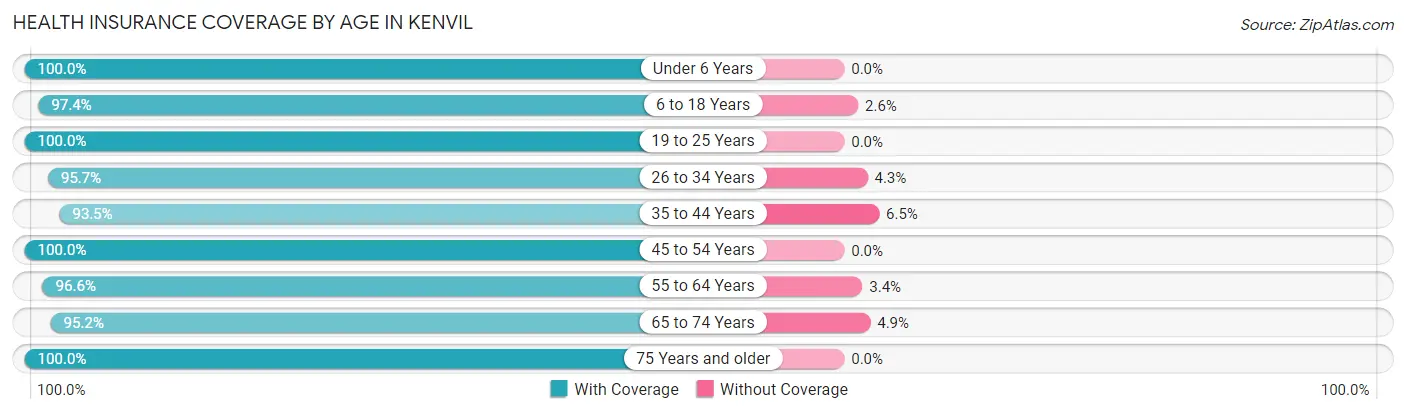
| Age Bracket | With Coverage | Without Coverage |
| Under 6 Years | 115 (100.0%) | 0 (0.0%) |
| 6 to 18 Years | 227 (97.4%) | 6 (2.6%) |
| 19 to 25 Years | 41 (100.0%) | 0 (0.0%) |
| 26 to 34 Years | 199 (95.7%) | 9 (4.3%) |
| 35 to 44 Years | 245 (93.5%) | 17 (6.5%) |
| 45 to 54 Years | 238 (100.0%) | 0 (0.0%) |
| 55 to 64 Years | 201 (96.6%) | 7 (3.4%) |
| 65 to 74 Years | 157 (95.2%) | 8 (4.9%) |
| 75 Years and older | 166 (100.0%) | 0 (0.0%) |
| Total | 1,589 (97.1%) | 47 (2.9%) |
Health Insurance Coverage by Citizenship Status in Kenvil
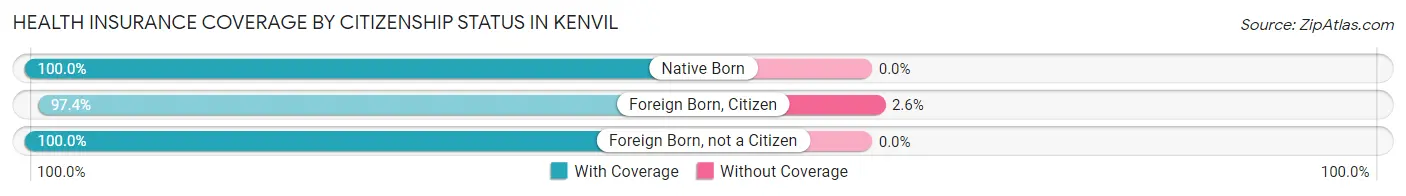
| Citizenship Status | With Coverage | Without Coverage |
| Native Born | 115 (100.0%) | 0 (0.0%) |
| Foreign Born, Citizen | 227 (97.4%) | 6 (2.6%) |
| Foreign Born, not a Citizen | 41 (100.0%) | 0 (0.0%) |
Health Insurance Coverage by Household Income in Kenvil
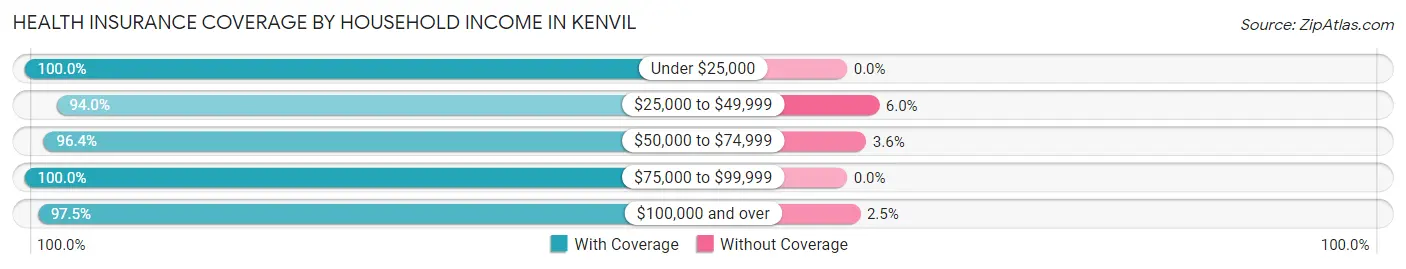
| Household Income | With Coverage | Without Coverage |
| Under $25,000 | 31 (100.0%) | 0 (0.0%) |
| $25,000 to $49,999 | 235 (94.0%) | 15 (6.0%) |
| $50,000 to $74,999 | 431 (96.4%) | 16 (3.6%) |
| $75,000 to $99,999 | 230 (100.0%) | 0 (0.0%) |
| $100,000 and over | 634 (97.5%) | 16 (2.5%) |
Public vs Private Health Insurance Coverage by Age in Kenvil
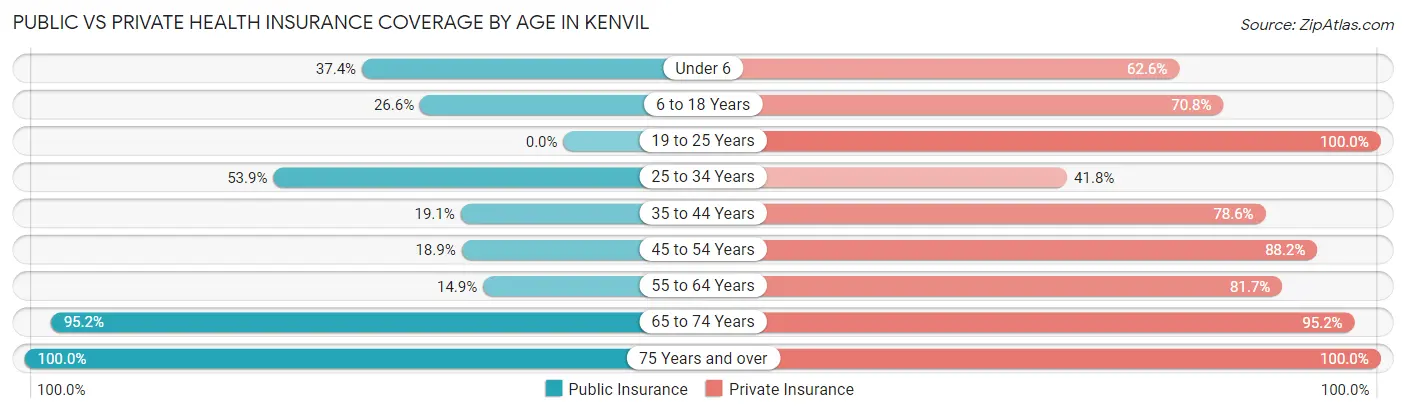
| Age Bracket | Public Insurance | Private Insurance |
| Under 6 | 43 (37.4%) | 72 (62.6%) |
| 6 to 18 Years | 62 (26.6%) | 165 (70.8%) |
| 19 to 25 Years | 0 (0.0%) | 41 (100.0%) |
| 25 to 34 Years | 112 (53.8%) | 87 (41.8%) |
| 35 to 44 Years | 50 (19.1%) | 206 (78.6%) |
| 45 to 54 Years | 45 (18.9%) | 210 (88.2%) |
| 55 to 64 Years | 31 (14.9%) | 170 (81.7%) |
| 65 to 74 Years | 157 (95.2%) | 157 (95.2%) |
| 75 Years and over | 166 (100.0%) | 166 (100.0%) |
| Total | 666 (40.7%) | 1,274 (77.9%) |
Disability Status by Sex by Age in Kenvil
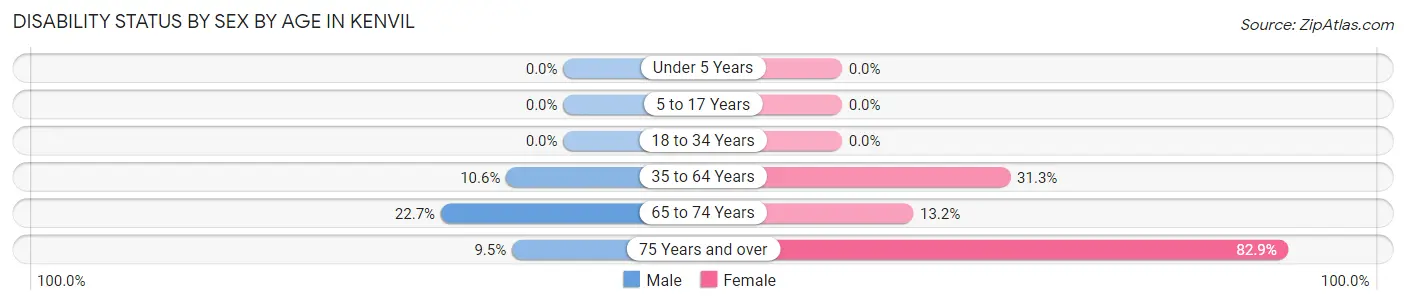
| Age Bracket | Male | Female |
| Under 5 Years | 0 (0.0%) | 0 (0.0%) |
| 5 to 17 Years | 0 (0.0%) | 0 (0.0%) |
| 18 to 34 Years | 0 (0.0%) | 0 (0.0%) |
| 35 to 64 Years | 53 (10.6%) | 65 (31.2%) |
| 65 to 74 Years | 10 (22.7%) | 16 (13.2%) |
| 75 Years and over | 8 (9.5%) | 68 (82.9%) |
Disability Class by Sex by Age in Kenvil
Disability Class: Hearing Difficulty
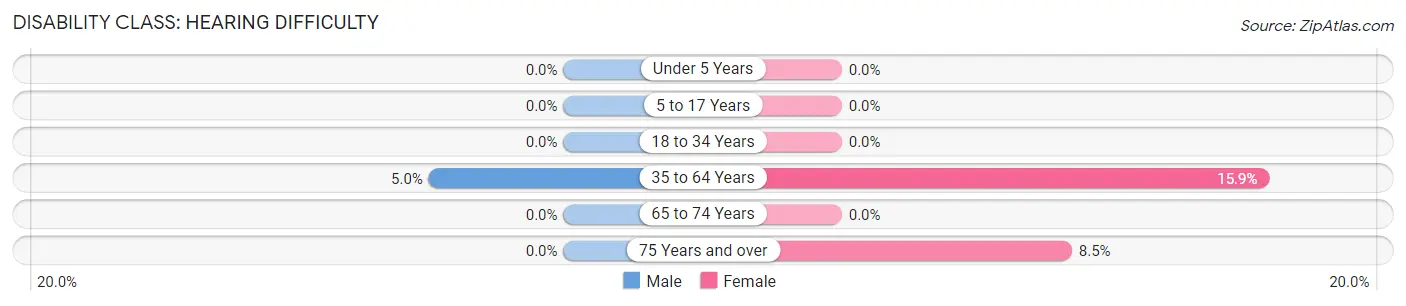
| Age Bracket | Male | Female |
| Under 5 Years | 0 (0.0%) | 0 (0.0%) |
| 5 to 17 Years | 0 (0.0%) | 0 (0.0%) |
| 18 to 34 Years | 0 (0.0%) | 0 (0.0%) |
| 35 to 64 Years | 25 (5.0%) | 33 (15.9%) |
| 65 to 74 Years | 0 (0.0%) | 0 (0.0%) |
| 75 Years and over | 0 (0.0%) | 7 (8.5%) |
Disability Class: Vision Difficulty
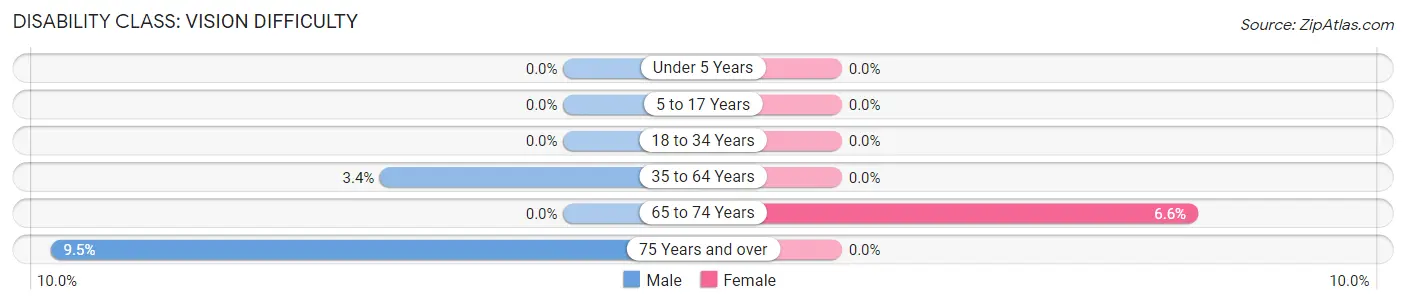
| Age Bracket | Male | Female |
| Under 5 Years | 0 (0.0%) | 0 (0.0%) |
| 5 to 17 Years | 0 (0.0%) | 0 (0.0%) |
| 18 to 34 Years | 0 (0.0%) | 0 (0.0%) |
| 35 to 64 Years | 17 (3.4%) | 0 (0.0%) |
| 65 to 74 Years | 0 (0.0%) | 8 (6.6%) |
| 75 Years and over | 8 (9.5%) | 0 (0.0%) |
Disability Class: Cognitive Difficulty
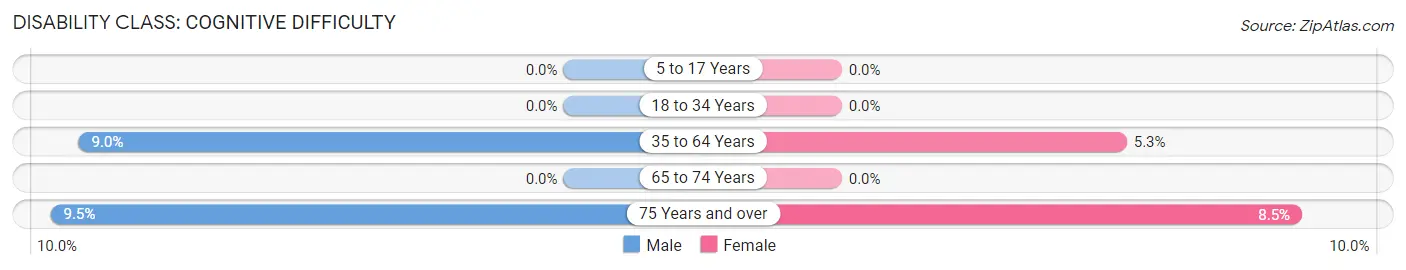
| Age Bracket | Male | Female |
| 5 to 17 Years | 0 (0.0%) | 0 (0.0%) |
| 18 to 34 Years | 0 (0.0%) | 0 (0.0%) |
| 35 to 64 Years | 45 (9.0%) | 11 (5.3%) |
| 65 to 74 Years | 0 (0.0%) | 0 (0.0%) |
| 75 Years and over | 8 (9.5%) | 7 (8.5%) |
Disability Class: Ambulatory Difficulty
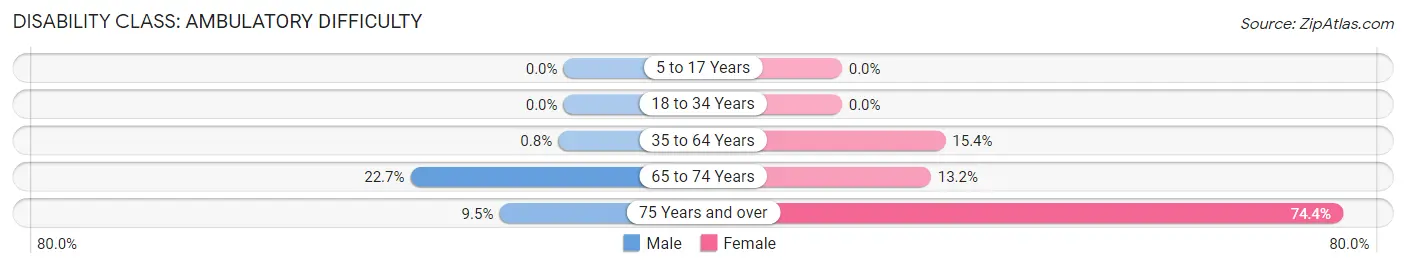
| Age Bracket | Male | Female |
| 5 to 17 Years | 0 (0.0%) | 0 (0.0%) |
| 18 to 34 Years | 0 (0.0%) | 0 (0.0%) |
| 35 to 64 Years | 4 (0.8%) | 32 (15.4%) |
| 65 to 74 Years | 10 (22.7%) | 16 (13.2%) |
| 75 Years and over | 8 (9.5%) | 61 (74.4%) |
Disability Class: Self-Care Difficulty
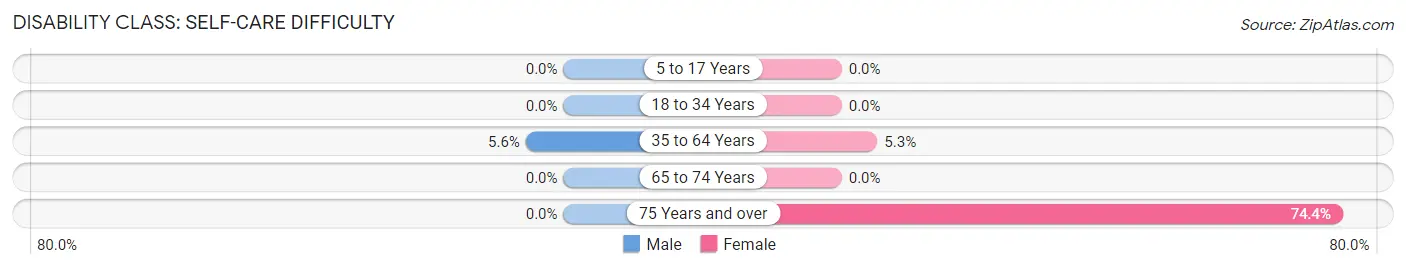
| Age Bracket | Male | Female |
| 5 to 17 Years | 0 (0.0%) | 0 (0.0%) |
| 18 to 34 Years | 0 (0.0%) | 0 (0.0%) |
| 35 to 64 Years | 28 (5.6%) | 11 (5.3%) |
| 65 to 74 Years | 0 (0.0%) | 0 (0.0%) |
| 75 Years and over | 0 (0.0%) | 61 (74.4%) |
Technology Access in Kenvil
Computing Device Access in Kenvil
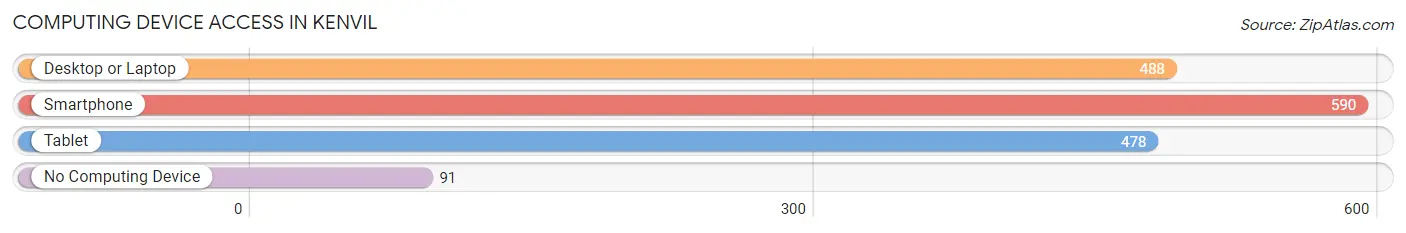
| Device Type | # Households | % Households |
| Desktop or Laptop | 488 | 71.7% |
| Smartphone | 590 | 86.6% |
| Tablet | 478 | 70.2% |
| No Computing Device | 91 | 13.4% |
| Total | 681 | 100.0% |
Internet Access in Kenvil
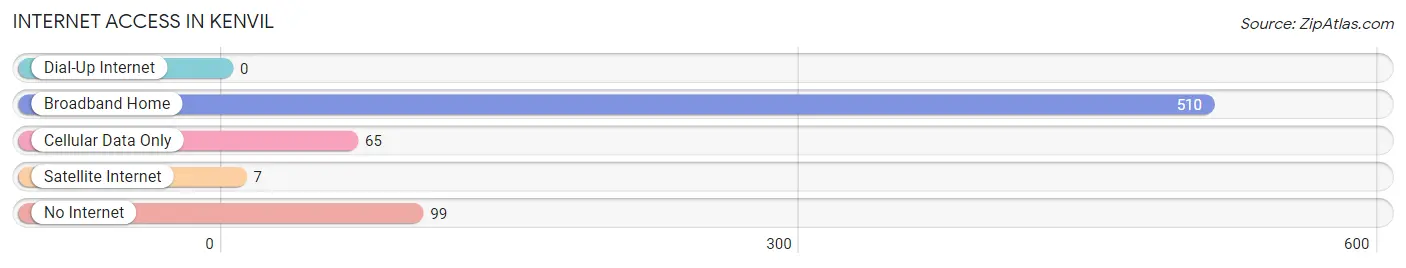
| Internet Type | # Households | % Households |
| Dial-Up Internet | 0 | 0.0% |
| Broadband Home | 510 | 74.9% |
| Cellular Data Only | 65 | 9.5% |
| Satellite Internet | 7 | 1.0% |
| No Internet | 99 | 14.5% |
| Total | 681 | 100.0% |
Kenvil Summary
Kenvil is a small borough located in Morris County, New Jersey. It is situated in the northern part of the state, about 25 miles west of New York City. The borough is bordered by Roxbury Township to the north, Mount Olive Township to the east, and Washington Township to the south. The population of Kenvil was 5,945 as of the 2010 census.
Geography
Kenvil is located at 40°51'25" North, 74°41'45" West (40.856944, -74.695833). According to the United States Census Bureau, the borough has a total area of 1.3 square miles, all of which is land.
The borough is located in the Kittatinny Valley, which is part of the Great Appalachian Valley. The valley is surrounded by the Kittatinny Mountains, which are part of the Appalachian Mountains. The highest point in the borough is the summit of Mine Hill, which is 845 feet above sea level.
Demographics
As of the 2010 census, there were 5,945 people, 2,093 households, and 1,541 families residing in the borough. The population density was 4,541.5 people per square mile. There were 2,209 housing units at an average density of 1,689.2 per square mile. The racial makeup of the borough was 87.2% White, 5.2% African American, 0.2% Native American, 4.2% Asian, 0.1% Pacific Islander, 1.3% from other races, and 2.0% from two or more races. Hispanic or Latino of any race were 6.7% of the population.
There were 2,093 households, out of which 33.2% had children under the age of 18 living with them, 57.2% were married couples living together, 11.2% had a female householder with no husband present, and 27.2% were non-families. 22.2% of all households were made up of individuals, and 9.2% had someone living alone who was 65 years of age or older. The average household size was 2.83 and the average family size was 3.35.
In the borough, the population was spread out, with 24.7% under the age of 18, 7.2% from 18 to 24, 28.2% from 25 to 44, 27.2% from 45 to 64, and 12.7% who were 65 years of age or older. The median age was 38.4 years. For every 100 females, there were 95.2 males. For every 100 females age 18 and over, there were 92.2 males.
The median income for a household in the borough was $76,944, and the median income for a family was $86,944. Males had a median income of $60,000 versus $41,250 for females. The per capita income for the borough was $30,944. About 2.2% of families and 3.2% of the population were below the poverty line, including 3.7% of those under age 18 and 4.2% of those age 65 or over.
Economy
Kenvil is home to several small businesses, including a few restaurants, a hardware store, and a few auto repair shops. The borough is also home to a few industrial parks, which are home to a variety of businesses, including a printing company, a plastics manufacturer, and a food processing plant.
The borough is also home to a few large employers, including a medical device manufacturer, a pharmaceutical company, and a telecommunications company. The largest employer in the borough is the pharmaceutical company, which employs over 1,000 people.
The borough is served by the Morris County Transit bus system, which provides service to the surrounding towns and cities. The nearest airport is the Morristown Municipal Airport, which is located about 10 miles away.
Conclusion
Kenvil is a small borough located in Morris County, New Jersey. It is situated in the northern part of the state, about 25 miles west of New York City. The population of Kenvil was 5,945 as of the 2010 census. The borough is located in the Kittatinny Valley, which is part of the Great Appalachian Valley. The borough is home to several small businesses, as well as a few large employers. The borough is served by the Morris County Transit bus system, which provides service to the surrounding towns and cities.
Common Questions
What is Per Capita Income in Kenvil?
Per Capita income in Kenvil is $39,301.
What is the Median Family Income in Kenvil?
Median Family Income in Kenvil is $72,404.
What is the Median Household income in Kenvil?
Median Household Income in Kenvil is $77,461.
What is Income or Wage Gap in Kenvil?
Income or Wage Gap in Kenvil is 8.8%.
Women in Kenvil earn 91.2 cents for every dollar earned by a man.
What is Inequality or Gini Index in Kenvil?
Inequality or Gini Index in Kenvil is 0.34.
What is the Total Population of Kenvil?
Total Population of Kenvil is 1,636.
What is the Total Male Population of Kenvil?
Total Male Population of Kenvil is 924.
What is the Total Female Population of Kenvil?
Total Female Population of Kenvil is 712.
What is the Ratio of Males per 100 Females in Kenvil?
There are 129.78 Males per 100 Females in Kenvil.
What is the Ratio of Females per 100 Males in Kenvil?
There are 77.06 Females per 100 Males in Kenvil.
What is the Median Population Age in Kenvil?
Median Population Age in Kenvil is 42.8 Years.
What is the Average Family Size in Kenvil
Average Family Size in Kenvil is 2.7 People.
What is the Average Household Size in Kenvil
Average Household Size in Kenvil is 2.4 People.
How Large is the Labor Force in Kenvil?
There are 838 People in the Labor Forcein in Kenvil.
What is the Percentage of People in the Labor Force in Kenvil?
64.0% of People are in the Labor Force in Kenvil.
What is the Unemployment Rate in Kenvil?
Unemployment Rate in Kenvil is 1.1%.