Cities with the Highest Percentage of Romanian Population in New Jersey
RELATED REPORTS & OPTIONS
Romanian
New Jersey
Compare Cities
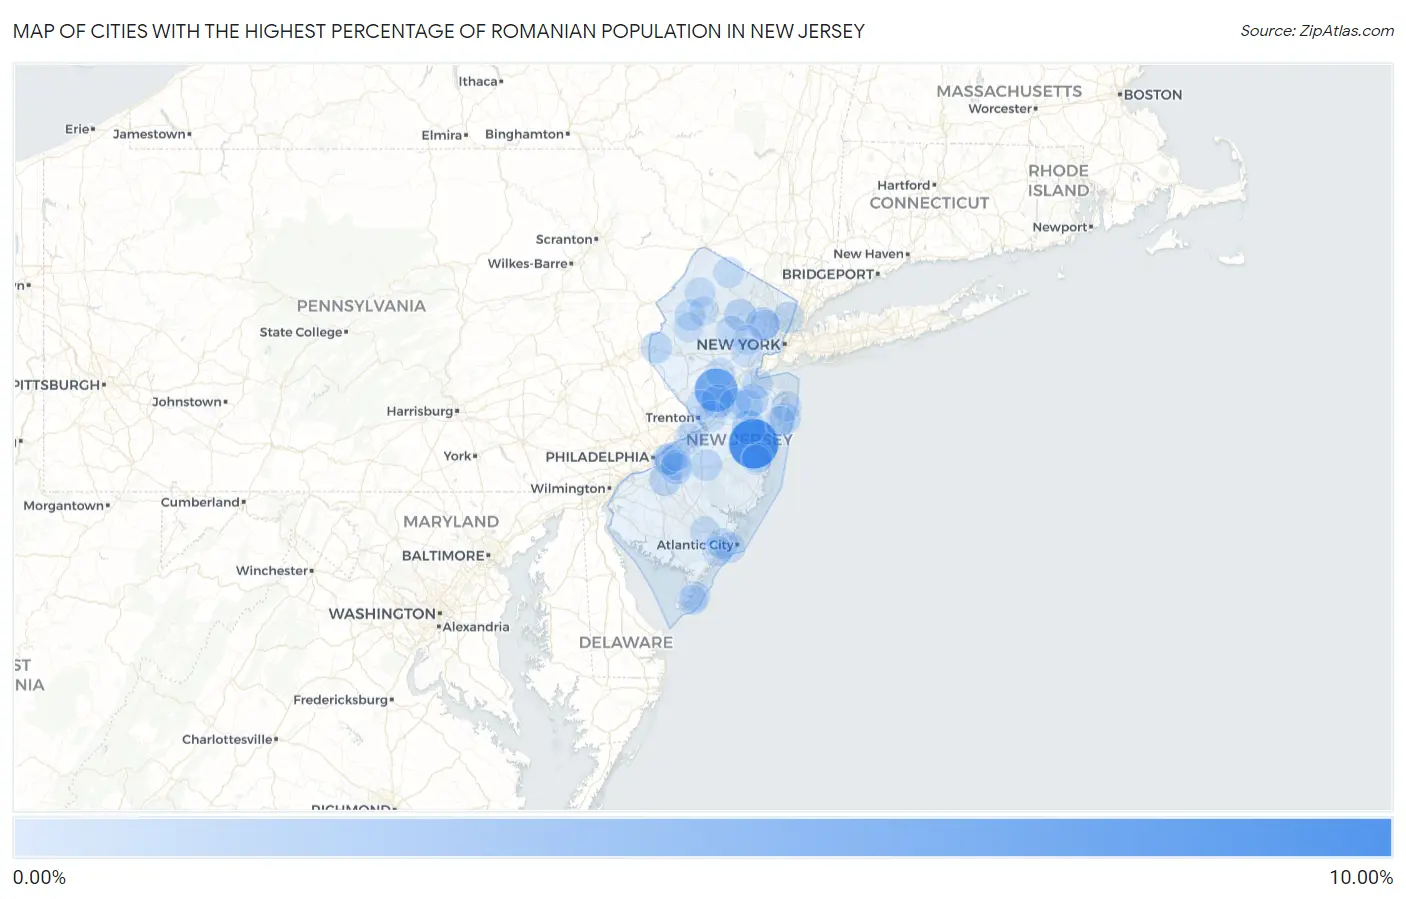
Map of Cities with the Highest Percentage of Romanian Population in New Jersey
0.00%
10.00%
Cities with the Highest Percentage of Romanian Population in New Jersey
| City | Romanian | vs State | vs National | |
| 1. | Cedar Glen West | 9.30% | 0.21%(+9.09)#1 | 0.14%(+9.16)#15 |
| 2. | Renaissance At Monroe | 6.66% | 0.21%(+6.45)#2 | 0.14%(+6.52)#21 |
| 3. | Allenhurst Borough | 6.55% | 0.21%(+6.34)#3 | 0.14%(+6.41)#22 |
| 4. | East Rocky Hill | 6.33% | 0.21%(+6.12)#4 | 0.14%(+6.19)#24 |
| 5. | Stonebridge | 2.87% | 0.21%(+2.66)#5 | 0.14%(+2.73)#123 |
| 6. | Great Notch | 2.51% | 0.21%(+2.30)#6 | 0.14%(+2.38)#149 |
| 7. | Lyons | 2.36% | 0.21%(+2.15)#7 | 0.14%(+2.23)#158 |
| 8. | Encore At Monroe | 2.18% | 0.21%(+1.97)#8 | 0.14%(+2.04)#184 |
| 9. | Vista Center | 2.16% | 0.21%(+1.95)#9 | 0.14%(+2.02)#186 |
| 10. | Franklinville | 2.10% | 0.21%(+1.89)#10 | 0.14%(+1.96)#192 |
| 11. | Clayton Borough | 2.00% | 0.21%(+1.79)#11 | 0.14%(+1.86)#204 |
| 12. | Cape May Point Borough | 1.94% | 0.21%(+1.73)#12 | 0.14%(+1.80)#220 |
| 13. | Regency At Monroe | 1.92% | 0.21%(+1.71)#13 | 0.14%(+1.78)#225 |
| 14. | Plainsboro Center | 1.81% | 0.21%(+1.60)#14 | 0.14%(+1.67)#243 |
| 15. | Upper Montclair | 1.78% | 0.21%(+1.57)#15 | 0.14%(+1.65)#248 |
| 16. | Glen Ridge Borough | 1.72% | 0.21%(+1.51)#16 | 0.14%(+1.58)#266 |
| 17. | Closter Borough | 1.58% | 0.21%(+1.37)#17 | 0.14%(+1.44)#290 |
| 18. | Robertsville | 1.51% | 0.21%(+1.30)#18 | 0.14%(+1.37)#309 |
| 19. | Boonton | 1.39% | 0.21%(+1.18)#19 | 0.14%(+1.25)#342 |
| 20. | Andover Borough | 1.34% | 0.21%(+1.13)#20 | 0.14%(+1.20)#360 |
| 21. | Flagtown | 1.31% | 0.21%(+1.10)#21 | 0.14%(+1.17)#373 |
| 22. | Blackwood | 1.29% | 0.21%(+1.08)#22 | 0.14%(+1.15)#381 |
| 23. | Helmetta Borough | 1.26% | 0.21%(+1.05)#23 | 0.14%(+1.12)#395 |
| 24. | Cologne | 1.25% | 0.21%(+1.04)#24 | 0.14%(+1.11)#400 |
| 25. | Greenwich | 1.22% | 0.21%(+1.01)#25 | 0.14%(+1.08)#412 |
| 26. | Leisuretowne | 1.21% | 0.21%(+1.00)#26 | 0.14%(+1.08)#419 |
| 27. | Cherry Hill Mall | 1.21% | 0.21%(+0.999)#27 | 0.14%(+1.07)#421 |
| 28. | Mount Hope | 1.20% | 0.21%(+0.987)#28 | 0.14%(+1.06)#425 |
| 29. | Newfoundland | 1.19% | 0.21%(+0.984)#29 | 0.14%(+1.06)#426 |
| 30. | Ocean Grove | 1.18% | 0.21%(+0.973)#30 | 0.14%(+1.04)#430 |
| 31. | Essex Fells Borough | 1.18% | 0.21%(+0.969)#31 | 0.14%(+1.04)#431 |
| 32. | Springdale | 1.17% | 0.21%(+0.964)#32 | 0.14%(+1.04)#434 |
| 33. | Englewood | 1.17% | 0.21%(+0.961)#33 | 0.14%(+1.03)#436 |
| 34. | Tenafly Borough | 1.14% | 0.21%(+0.927)#34 | 0.14%(+0.999)#454 |
| 35. | Longport Borough | 1.03% | 0.21%(+0.821)#35 | 0.14%(+0.892)#526 |
| 36. | Panther Valley | 0.99% | 0.21%(+0.776)#36 | 0.14%(+0.848)#555 |
| 37. | Yorketown | 0.99% | 0.21%(+0.775)#37 | 0.14%(+0.847)#557 |
| 38. | Edgewater Borough | 0.94% | 0.21%(+0.728)#38 | 0.14%(+0.799)#593 |
| 39. | Concordia | 0.92% | 0.21%(+0.713)#39 | 0.14%(+0.784)#609 |
| 40. | Morristown | 0.91% | 0.21%(+0.704)#40 | 0.14%(+0.776)#616 |
| 41. | Washington Borough | 0.91% | 0.21%(+0.702)#41 | 0.14%(+0.773)#620 |
| 42. | Hamilton Square | 0.91% | 0.21%(+0.698)#42 | 0.14%(+0.769)#621 |
| 43. | Golden Triangle | 0.91% | 0.21%(+0.697)#43 | 0.14%(+0.769)#622 |
| 44. | Northfield | 0.87% | 0.21%(+0.656)#44 | 0.14%(+0.727)#660 |
| 45. | Pennington Borough | 0.86% | 0.21%(+0.653)#45 | 0.14%(+0.725)#665 |
| 46. | Cliffside Park Borough | 0.86% | 0.21%(+0.647)#46 | 0.14%(+0.719)#670 |
| 47. | Beach Haven Borough | 0.85% | 0.21%(+0.638)#47 | 0.14%(+0.710)#678 |
| 48. | North Caldwell Borough | 0.85% | 0.21%(+0.635)#48 | 0.14%(+0.707)#679 |
| 49. | Newton | 0.81% | 0.21%(+0.602)#49 | 0.14%(+0.674)#711 |
| 50. | Vernon Center | 0.80% | 0.21%(+0.594)#50 | 0.14%(+0.665)#722 |
| 51. | Ventnor City | 0.80% | 0.21%(+0.587)#51 | 0.14%(+0.658)#730 |
| 52. | Laurence Harbor | 0.79% | 0.21%(+0.585)#52 | 0.14%(+0.656)#732 |
| 53. | Hopewell Borough | 0.77% | 0.21%(+0.557)#53 | 0.14%(+0.629)#767 |
| 54. | Fort Lee Borough | 0.77% | 0.21%(+0.556)#54 | 0.14%(+0.628)#768 |
| 55. | Far Hills Borough | 0.76% | 0.21%(+0.554)#55 | 0.14%(+0.625)#774 |
| 56. | Long Branch | 0.75% | 0.21%(+0.542)#56 | 0.14%(+0.613)#783 |
| 57. | Greentree | 0.73% | 0.21%(+0.516)#57 | 0.14%(+0.588)#808 |
| 58. | Butler Borough | 0.72% | 0.21%(+0.511)#58 | 0.14%(+0.582)#811 |
| 59. | Mountain Lakes Borough | 0.71% | 0.21%(+0.501)#59 | 0.14%(+0.573)#828 |
| 60. | Shark River Hills | 0.70% | 0.21%(+0.488)#60 | 0.14%(+0.559)#843 |
| 61. | Stanhope Borough | 0.68% | 0.21%(+0.469)#61 | 0.14%(+0.541)#867 |
| 62. | Somers Point | 0.68% | 0.21%(+0.467)#62 | 0.14%(+0.539)#871 |
| 63. | Chester Borough | 0.68% | 0.21%(+0.466)#63 | 0.14%(+0.537)#874 |
| 64. | Berlin Borough | 0.67% | 0.21%(+0.458)#64 | 0.14%(+0.529)#888 |
| 65. | The Hills | 0.67% | 0.21%(+0.457)#65 | 0.14%(+0.529)#889 |
| 66. | Hampton Borough | 0.66% | 0.21%(+0.448)#66 | 0.14%(+0.519)#907 |
| 67. | Bradley Beach Borough | 0.66% | 0.21%(+0.446)#67 | 0.14%(+0.517)#910 |
| 68. | Glen Rock Borough | 0.65% | 0.21%(+0.444)#68 | 0.14%(+0.515)#916 |
| 69. | Highlands Borough | 0.65% | 0.21%(+0.436)#69 | 0.14%(+0.507)#929 |
| 70. | Florence | 0.64% | 0.21%(+0.434)#70 | 0.14%(+0.505)#931 |
| 71. | North Wildwood | 0.63% | 0.21%(+0.422)#71 | 0.14%(+0.493)#954 |
| 72. | Stockton Borough | 0.63% | 0.21%(+0.422)#72 | 0.14%(+0.493)#956 |
| 73. | Emerson Borough | 0.62% | 0.21%(+0.408)#73 | 0.14%(+0.479)#978 |
| 74. | Fairview Borough | 0.62% | 0.21%(+0.406)#74 | 0.14%(+0.477)#982 |
| 75. | Sea Bright Borough | 0.61% | 0.21%(+0.404)#75 | 0.14%(+0.475)#987 |
| 76. | Little Silver Borough | 0.61% | 0.21%(+0.396)#76 | 0.14%(+0.468)#1,001 |
| 77. | Farmingdale Borough | 0.60% | 0.21%(+0.393)#77 | 0.14%(+0.465)#1,005 |
| 78. | Mays Landing | 0.60% | 0.21%(+0.388)#78 | 0.14%(+0.460)#1,014 |
| 79. | Holiday Heights | 0.59% | 0.21%(+0.376)#79 | 0.14%(+0.447)#1,046 |
| 80. | Brookdale | 0.58% | 0.21%(+0.372)#80 | 0.14%(+0.443)#1,051 |
| 81. | Bloomsbury Borough | 0.58% | 0.21%(+0.371)#81 | 0.14%(+0.443)#1,052 |
| 82. | Dumont Borough | 0.57% | 0.21%(+0.362)#82 | 0.14%(+0.433)#1,069 |
| 83. | Wildwood | 0.56% | 0.21%(+0.352)#83 | 0.14%(+0.423)#1,096 |
| 84. | Harrington Park Borough | 0.56% | 0.21%(+0.349)#84 | 0.14%(+0.421)#1,102 |
| 85. | Frenchtown Borough | 0.55% | 0.21%(+0.339)#85 | 0.14%(+0.411)#1,126 |
| 86. | Holiday City South | 0.54% | 0.21%(+0.334)#86 | 0.14%(+0.405)#1,142 |
| 87. | Short Hills | 0.53% | 0.21%(+0.323)#87 | 0.14%(+0.394)#1,169 |
| 88. | Lawrenceville | 0.53% | 0.21%(+0.322)#88 | 0.14%(+0.393)#1,170 |
| 89. | Wood Ridge Borough | 0.53% | 0.21%(+0.321)#89 | 0.14%(+0.393)#1,173 |
| 90. | Leonia Borough | 0.52% | 0.21%(+0.308)#90 | 0.14%(+0.379)#1,200 |
| 91. | Lake Hopatcong | 0.52% | 0.21%(+0.305)#91 | 0.14%(+0.377)#1,202 |
| 92. | Weston | 0.51% | 0.21%(+0.303)#92 | 0.14%(+0.374)#1,205 |
| 93. | Burlington | 0.51% | 0.21%(+0.299)#93 | 0.14%(+0.370)#1,219 |
| 94. | Byram Center | 0.51% | 0.21%(+0.298)#94 | 0.14%(+0.369)#1,221 |
| 95. | Moorestown Lenola | 0.50% | 0.21%(+0.291)#95 | 0.14%(+0.362)#1,236 |
| 96. | Westfield | 0.50% | 0.21%(+0.286)#96 | 0.14%(+0.358)#1,248 |
| 97. | Beattystown | 0.50% | 0.21%(+0.286)#97 | 0.14%(+0.357)#1,249 |
| 98. | Runnemede Borough | 0.49% | 0.21%(+0.284)#98 | 0.14%(+0.355)#1,258 |
| 99. | Lakehurst Borough | 0.49% | 0.21%(+0.280)#99 | 0.14%(+0.351)#1,270 |
| 100. | Seaville | 0.47% | 0.21%(+0.264)#100 | 0.14%(+0.335)#1,300 |
Common Questions
What are the Top 10 Cities with the Highest Percentage of Romanian Population in New Jersey?
Top 10 Cities with the Highest Percentage of Romanian Population in New Jersey are:
#1
9.30%
#2
6.33%
#3
2.16%
#4
1.81%
#5
1.78%
#6
1.51%
#7
1.39%
#8
1.29%
#9
1.22%
#10
1.21%
What city has the Highest Percentage of Romanian Population in New Jersey?
Cedar Glen West has the Highest Percentage of Romanian Population in New Jersey with 9.30%.
What is the Percentage of Romanian Population in the State of New Jersey?
Percentage of Romanian Population in New Jersey is 0.21%.
What is the Percentage of Romanian Population in the United States?
Percentage of Romanian Population in the United States is 0.14%.