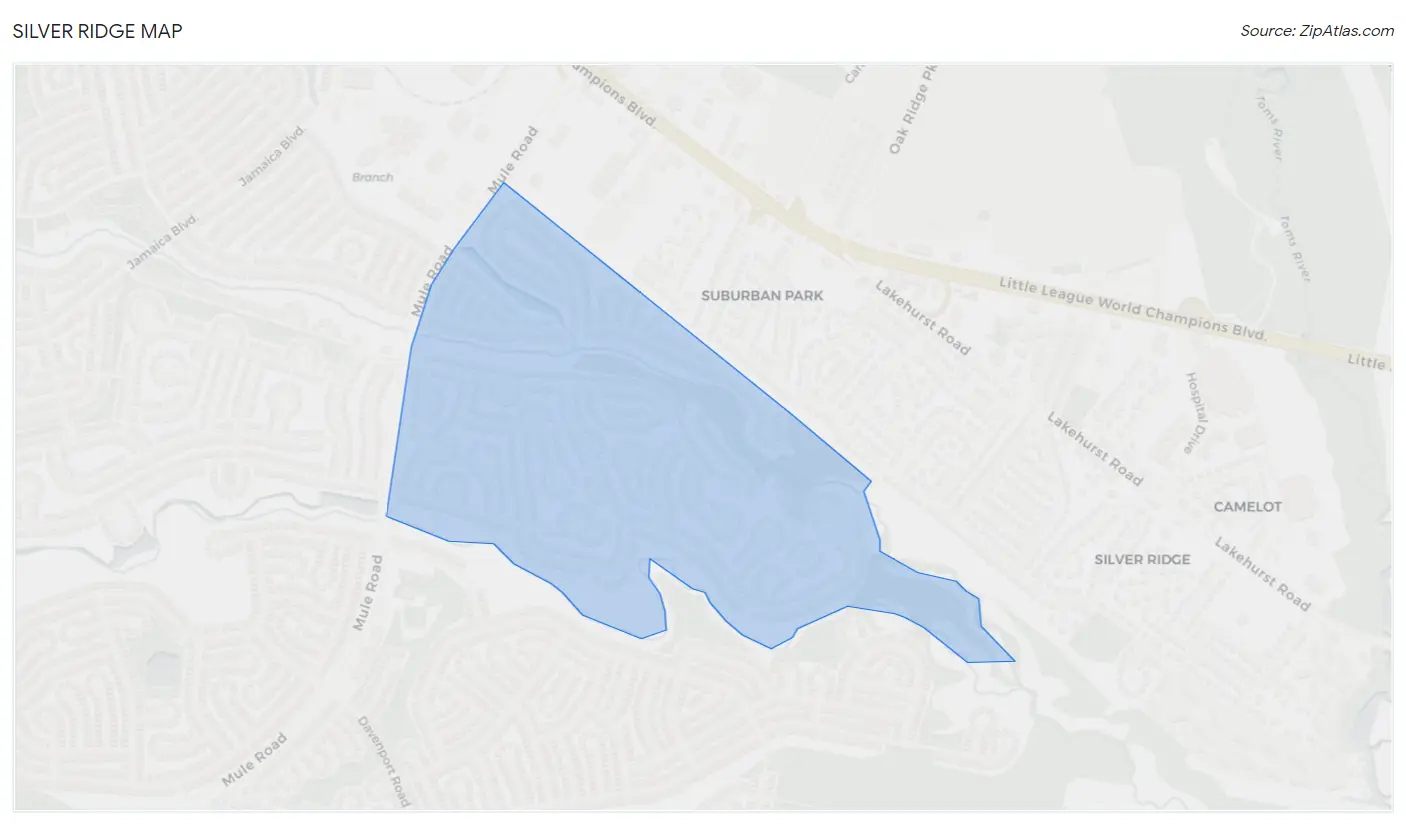
Silver Ridge, NJ Map & Demographics
Silver Ridge Map
Silver Ridge Overview
$88,677
PER CAPITA INCOME
$78,188
AVG FAMILY INCOME
$33,625
AVG HOUSEHOLD INCOME
0.72
INEQUALITY / GINI INDEX
1,063
TOTAL POPULATION
520
MALE POPULATION
543
FEMALE POPULATION
95.76
MALES / 100 FEMALES
104.42
FEMALES / 100 MALES
74.3
MEDIAN AGE
2.0
AVG FAMILY SIZE
1.3
AVG HOUSEHOLD SIZE
279
LABOR FORCE [ PEOPLE ]
26.2%
PERCENT IN LABOR FORCE
Income in Silver Ridge
Income Overview in Silver Ridge
Per Capita Income in Silver Ridge is $88,677, while median incomes of families and households are $78,188 and $33,625 respectively.
| Characteristic | Number | Measure |
| Per Capita Income | 1,063 | $88,677 |
| Median Family Income | 213 | $78,188 |
| Mean Family Income | 213 | $316,840 |
| Median Household Income | 813 | $33,625 |
| Mean Household Income | 813 | $114,947 |
| Income Deficit | 213 | $0 |
| Wage / Income Gap (%) | 1,063 | 0.00% |
| Wage / Income Gap ($) | 1,063 | 100.00¢ per $1 |
| Gini / Inequality Index | 1,063 | 0.72 |
Earnings by Sex in Silver Ridge
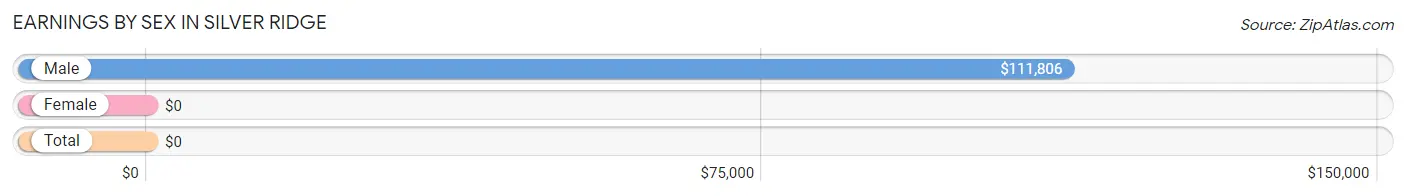
| Sex | Number | Average Earnings |
| Male | 198 (71.0%) | $111,806 |
| Female | 81 (29.0%) | $0 |
| Total | 279 (100.0%) | $0 |
Earnings by Sex by Income Bracket in Silver Ridge
The most common earnings brackets in Silver Ridge are $100,000+ for men (112 | 56.6%) and $2,499 or less for women (24 | 29.6%).
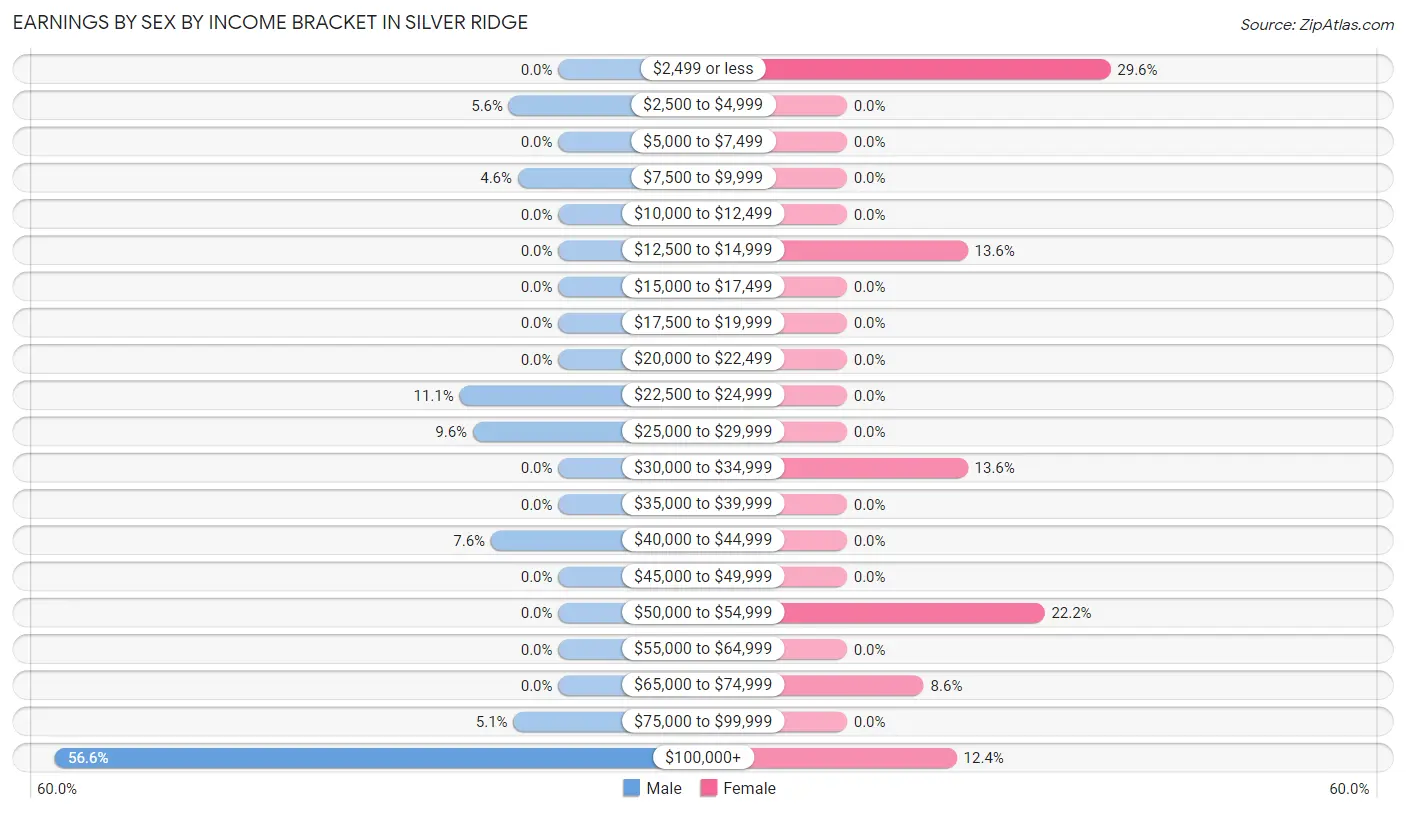
| Income | Male | Female |
| $2,499 or less | 0 (0.0%) | 24 (29.6%) |
| $2,500 to $4,999 | 11 (5.6%) | 0 (0.0%) |
| $5,000 to $7,499 | 0 (0.0%) | 0 (0.0%) |
| $7,500 to $9,999 | 9 (4.5%) | 0 (0.0%) |
| $10,000 to $12,499 | 0 (0.0%) | 0 (0.0%) |
| $12,500 to $14,999 | 0 (0.0%) | 11 (13.6%) |
| $15,000 to $17,499 | 0 (0.0%) | 0 (0.0%) |
| $17,500 to $19,999 | 0 (0.0%) | 0 (0.0%) |
| $20,000 to $22,499 | 0 (0.0%) | 0 (0.0%) |
| $22,500 to $24,999 | 22 (11.1%) | 0 (0.0%) |
| $25,000 to $29,999 | 19 (9.6%) | 0 (0.0%) |
| $30,000 to $34,999 | 0 (0.0%) | 11 (13.6%) |
| $35,000 to $39,999 | 0 (0.0%) | 0 (0.0%) |
| $40,000 to $44,999 | 15 (7.6%) | 0 (0.0%) |
| $45,000 to $49,999 | 0 (0.0%) | 0 (0.0%) |
| $50,000 to $54,999 | 0 (0.0%) | 18 (22.2%) |
| $55,000 to $64,999 | 0 (0.0%) | 0 (0.0%) |
| $65,000 to $74,999 | 0 (0.0%) | 7 (8.6%) |
| $75,000 to $99,999 | 10 (5.1%) | 0 (0.0%) |
| $100,000+ | 112 (56.6%) | 10 (12.3%) |
| Total | 198 (100.0%) | 81 (100.0%) |
Earnings by Sex by Educational Attainment in Silver Ridge
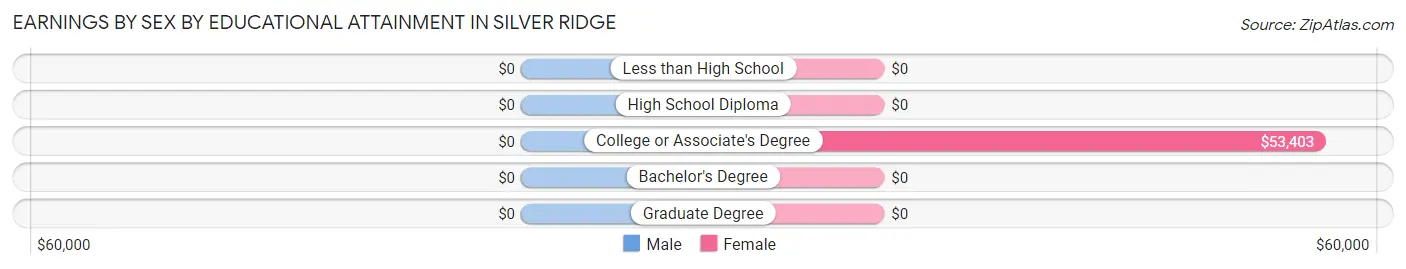
| Educational Attainment | Male Income | Female Income |
| Less than High School | - | - |
| High School Diploma | - | - |
| College or Associate's Degree | - | - |
| Bachelor's Degree | - | - |
| Graduate Degree | - | - |
| Total | $111,806 | $0 |
Family Income in Silver Ridge
Family Income Brackets in Silver Ridge
According to the Silver Ridge family income data, there are 61 families falling into the $35,000 to $49,999 income range, which is the most common income bracket and makes up 28.6% of all families.
| Income Bracket | # Families | % Families |
| Less than $10,000 | 0 | 0.0% |
| $10,000 to $14,999 | 0 | 0.0% |
| $15,000 to $24,999 | 11 | 5.2% |
| $25,000 to $34,999 | 0 | 0.0% |
| $35,000 to $49,999 | 61 | 28.6% |
| $50,000 to $74,999 | 29 | 13.6% |
| $75,000 to $99,999 | 31 | 14.6% |
| $100,000 to $149,999 | 28 | 13.1% |
| $150,000 to $199,999 | 0 | 0.0% |
| $200,000+ | 53 | 24.9% |
Family Income by Famaliy Size in Silver Ridge
2-person families (213 | 100.0%) account for the highest median family income in Silver Ridge with $78,188 per family, while 2-person families (213 | 100.0%) have the highest median income of $39,094 per family member.
| Income Bracket | # Families | Median Income |
| 2-Person Families | 213 (100.0%) | $78,188 |
| 3-Person Families | 0 (0.0%) | $0 |
| 4-Person Families | 0 (0.0%) | $0 |
| 5-Person Families | 0 (0.0%) | $0 |
| 6-Person Families | 0 (0.0%) | $0 |
| 7+ Person Families | 0 (0.0%) | $0 |
| Total | 213 (100.0%) | $78,188 |
Family Income by Number of Earners in Silver Ridge
| Number of Earners | # Families | Median Income |
| No Earners | 88 (41.3%) | $43,304 |
| 1 Earner | 93 (43.7%) | $0 |
| 2 Earners | 32 (15.0%) | $0 |
| 3+ Earners | 0 (0.0%) | $0 |
| Total | 213 (100.0%) | $78,188 |
Household Income in Silver Ridge
Household Income Brackets in Silver Ridge
With 247 households falling in the category, the $25,000 to $34,999 income range is the most frequent in Silver Ridge, accounting for 30.4% of all households.
| Income Bracket | # Households | % Households |
| Less than $10,000 | 90 | 11.1% |
| $10,000 to $14,999 | 0 | 0.0% |
| $15,000 to $24,999 | 97 | 11.9% |
| $25,000 to $34,999 | 247 | 30.4% |
| $35,000 to $49,999 | 70 | 8.6% |
| $50,000 to $74,999 | 126 | 15.5% |
| $75,000 to $99,999 | 31 | 3.8% |
| $100,000 to $149,999 | 68 | 8.4% |
| $150,000 to $199,999 | 31 | 3.8% |
| $200,000+ | 53 | 6.5% |
Household Income by Householder Age in Silver Ridge
The median household income in Silver Ridge is $33,625, with the highest median household income of $32,550 found in the 65+ years age bracket for the primary householder. A total of 574 households (70.6%) fall into this category.
| Income Bracket | # Households | Median Income |
| 15 to 24 Years | 0 (0.0%) | $0 |
| 25 to 44 Years | 0 (0.0%) | $0 |
| 45 to 64 Years | 239 (29.4%) | $0 |
| 65+ Years | 574 (70.6%) | $32,550 |
| Total | 813 (100.0%) | $33,625 |
Poverty in Silver Ridge
Income Below Poverty by Sex and Age in Silver Ridge
With 16.9% poverty level for males and 4.4% for females among the residents of Silver Ridge, 55 to 64 year old males and 75 year old and over females are the most vulnerable to poverty, with 77 males (40.7%) and 13 females (6.0%) in their respective age groups living below the poverty level.
| Age Bracket | Male | Female |
| Under 5 Years | 0 (0.0%) | 0 (0.0%) |
| 5 Years | 0 (0.0%) | 0 (0.0%) |
| 6 to 11 Years | 0 (0.0%) | 0 (0.0%) |
| 12 to 14 Years | 0 (0.0%) | 0 (0.0%) |
| 15 Years | 0 (0.0%) | 0 (0.0%) |
| 16 and 17 Years | 0 (0.0%) | 0 (0.0%) |
| 18 to 24 Years | 0 (0.0%) | 0 (0.0%) |
| 25 to 34 Years | 0 (0.0%) | 0 (0.0%) |
| 35 to 44 Years | 0 (0.0%) | 0 (0.0%) |
| 45 to 54 Years | 0 (0.0%) | 0 (0.0%) |
| 55 to 64 Years | 77 (40.7%) | 0 (0.0%) |
| 65 to 74 Years | 11 (12.5%) | 11 (4.4%) |
| 75 Years and over | 0 (0.0%) | 13 (6.0%) |
| Total | 88 (16.9%) | 24 (4.4%) |
Income Above Poverty by Sex and Age in Silver Ridge
According to the poverty statistics in Silver Ridge, males aged 25 to 34 years and females aged 45 to 54 years are the age groups that are most secure financially, with 100.0% of males and 100.0% of females in these age groups living above the poverty line.
| Age Bracket | Male | Female |
| Under 5 Years | 0 (0.0%) | 0 (0.0%) |
| 5 Years | 0 (0.0%) | 0 (0.0%) |
| 6 to 11 Years | 0 (0.0%) | 0 (0.0%) |
| 12 to 14 Years | 0 (0.0%) | 0 (0.0%) |
| 15 Years | 0 (0.0%) | 0 (0.0%) |
| 16 and 17 Years | 0 (0.0%) | 0 (0.0%) |
| 18 to 24 Years | 0 (0.0%) | 0 (0.0%) |
| 25 to 34 Years | 15 (100.0%) | 0 (0.0%) |
| 35 to 44 Years | 0 (0.0%) | 0 (0.0%) |
| 45 to 54 Years | 10 (100.0%) | 10 (100.0%) |
| 55 to 64 Years | 112 (59.3%) | 66 (100.0%) |
| 65 to 74 Years | 77 (87.5%) | 239 (95.6%) |
| 75 Years and over | 218 (100.0%) | 204 (94.0%) |
| Total | 432 (83.1%) | 519 (95.6%) |
Income Below Poverty Among Married-Couple Families in Silver Ridge
| Children | Above Poverty | Below Poverty |
| No Children | 191 (100.0%) | 0 (0.0%) |
| 1 or 2 Children | 0 (0.0%) | 0 (0.0%) |
| 3 or 4 Children | 0 (0.0%) | 0 (0.0%) |
| 5 or more Children | 0 (0.0%) | 0 (0.0%) |
| Total | 191 (100.0%) | 0 (0.0%) |
Income Below Poverty Among Single-Parent Households in Silver Ridge
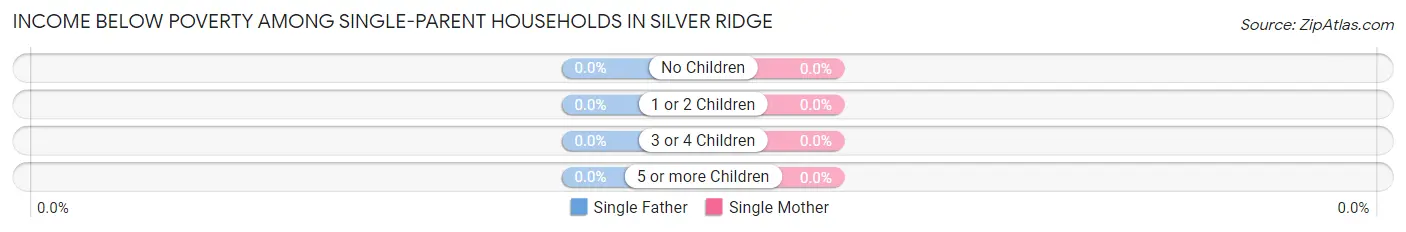
| Children | Single Father | Single Mother |
| No Children | 0 (0.0%) | 0 (0.0%) |
| 1 or 2 Children | 0 (0.0%) | 0 (0.0%) |
| 3 or 4 Children | 0 (0.0%) | 0 (0.0%) |
| 5 or more Children | 0 (0.0%) | 0 (0.0%) |
| Total | 0 (0.0%) | 0 (0.0%) |
Income Below Poverty Among Married-Couple vs Single-Parent Households in Silver Ridge
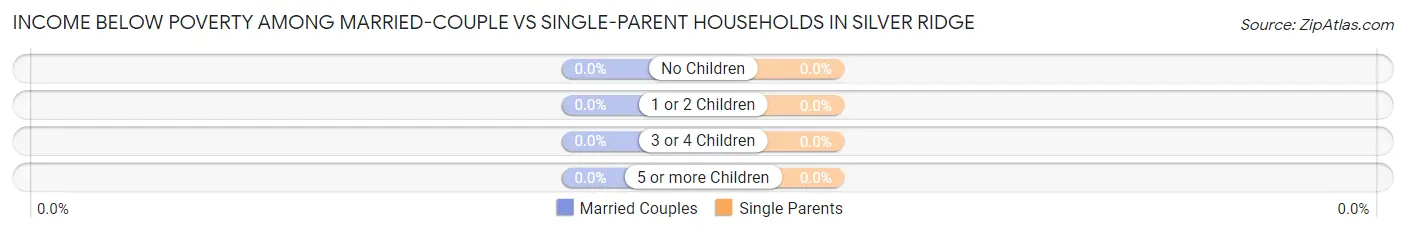
| Children | Married-Couple Families | Single-Parent Households |
| No Children | 0 (0.0%) | 0 (0.0%) |
| 1 or 2 Children | 0 (0.0%) | 0 (0.0%) |
| 3 or 4 Children | 0 (0.0%) | 0 (0.0%) |
| 5 or more Children | 0 (0.0%) | 0 (0.0%) |
| Total | 0 (0.0%) | 0 (0.0%) |
Race in Silver Ridge
The most populous races in Silver Ridge are White / Caucasian (1,012 | 95.2%), Some other Race (26 | 2.5%), and Two or more Races (18 | 1.7%).
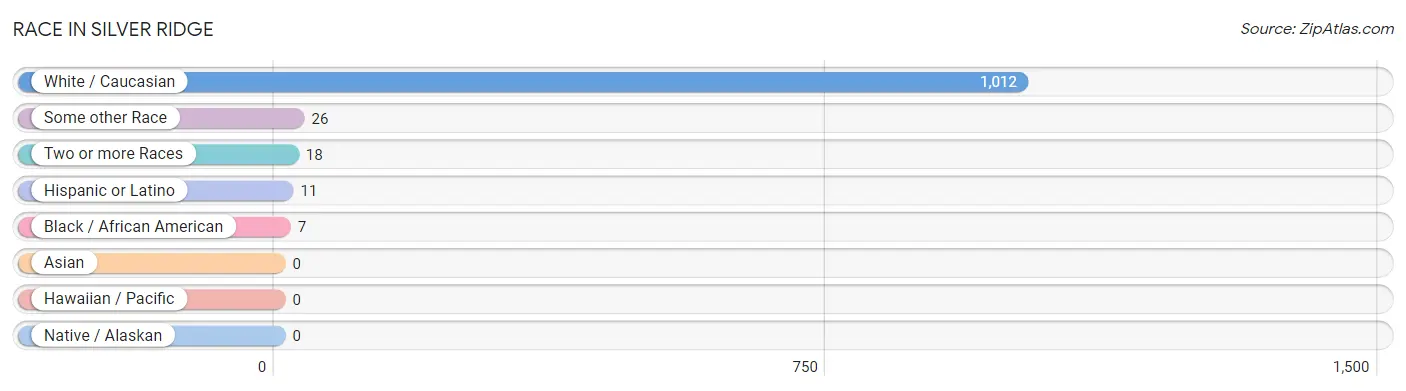
| Race | # Population | % Population |
| Asian | 0 | 0.0% |
| Black / African American | 7 | 0.7% |
| Hawaiian / Pacific | 0 | 0.0% |
| Hispanic or Latino | 11 | 1.0% |
| Native / Alaskan | 0 | 0.0% |
| White / Caucasian | 1,012 | 95.2% |
| Two or more Races | 18 | 1.7% |
| Some other Race | 26 | 2.5% |
| Total | 1,063 | 100.0% |
Ancestry in Silver Ridge
The most populous ancestries reported in Silver Ridge are Italian (486 | 45.7%), Irish (121 | 11.4%), American (118 | 11.1%), English (96 | 9.0%), and Polish (92 | 8.6%), together accounting for 85.9% of all Silver Ridge residents.
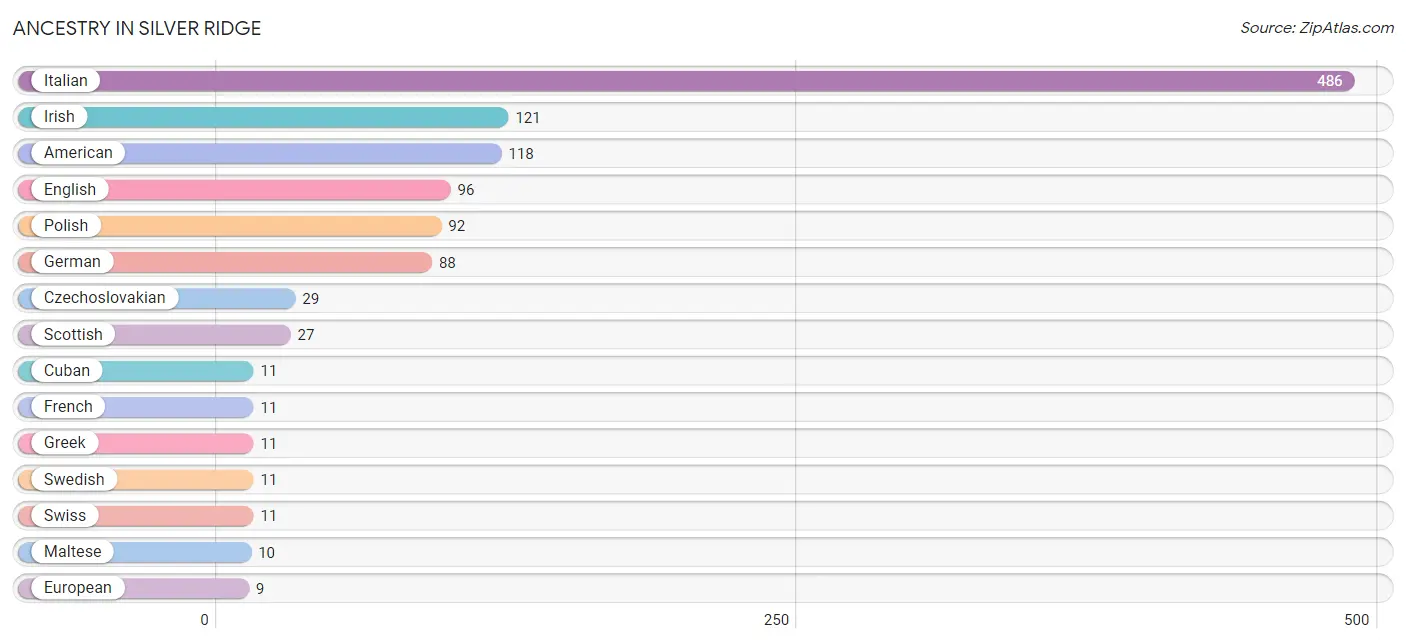
| Ancestry | # Population | % Population |
| American | 118 | 11.1% |
| Cuban | 11 | 1.0% |
| Czechoslovakian | 29 | 2.7% |
| English | 96 | 9.0% |
| European | 9 | 0.9% |
| French | 11 | 1.0% |
| German | 88 | 8.3% |
| Greek | 11 | 1.0% |
| Irish | 121 | 11.4% |
| Italian | 486 | 45.7% |
| Maltese | 10 | 0.9% |
| Polish | 92 | 8.6% |
| Russian | 9 | 0.9% |
| Scottish | 27 | 2.5% |
| Swedish | 11 | 1.0% |
| Swiss | 11 | 1.0% | View All 16 Rows |
Immigrants in Silver Ridge
The most numerous immigrant groups reported in Silver Ridge came from Europe (118 | 11.1%), Eastern Europe (49 | 4.6%), Southern Europe (41 | 3.9%), Italy (31 | 2.9%), and Poland (31 | 2.9%), together accounting for 25.4% of all Silver Ridge residents.
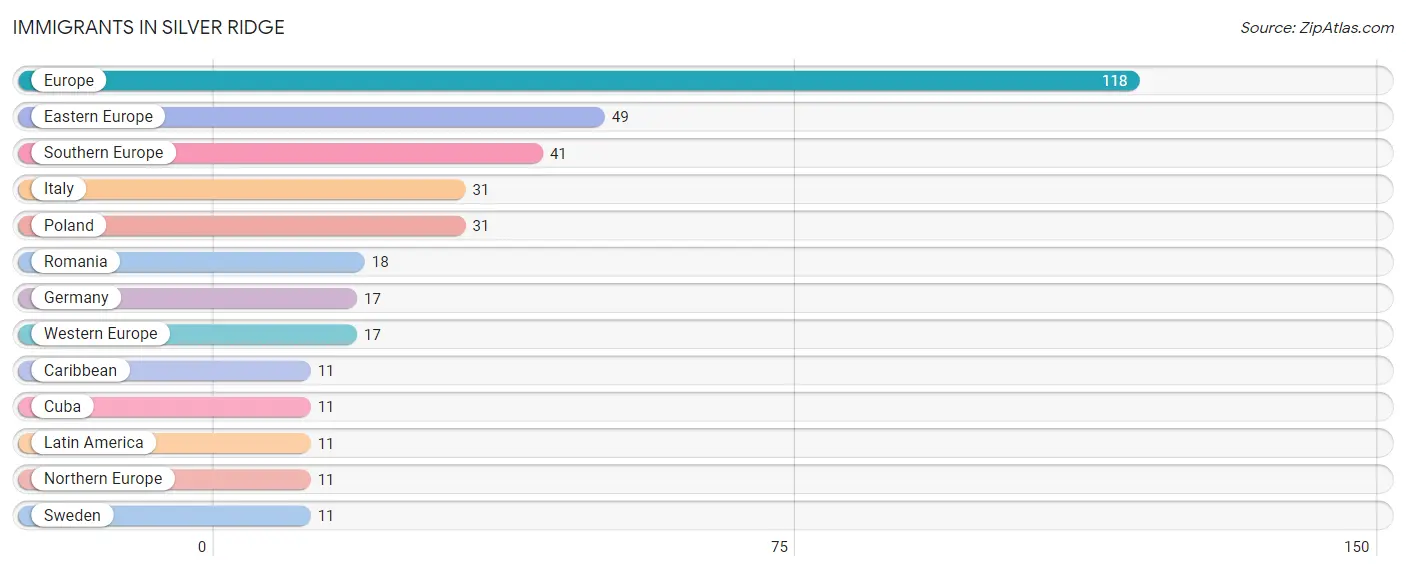
| Immigration Origin | # Population | % Population |
| Caribbean | 11 | 1.0% |
| Cuba | 11 | 1.0% |
| Eastern Europe | 49 | 4.6% |
| Europe | 118 | 11.1% |
| Germany | 17 | 1.6% |
| Italy | 31 | 2.9% |
| Latin America | 11 | 1.0% |
| Northern Europe | 11 | 1.0% |
| Poland | 31 | 2.9% |
| Romania | 18 | 1.7% |
| Southern Europe | 41 | 3.9% |
| Sweden | 11 | 1.0% |
| Western Europe | 17 | 1.6% | View All 13 Rows |
Sex and Age in Silver Ridge
Sex and Age in Silver Ridge
The most populous age groups in Silver Ridge are 55 to 59 Years (111 | 21.3%) for men and 70 to 74 Years (200 | 36.8%) for women.
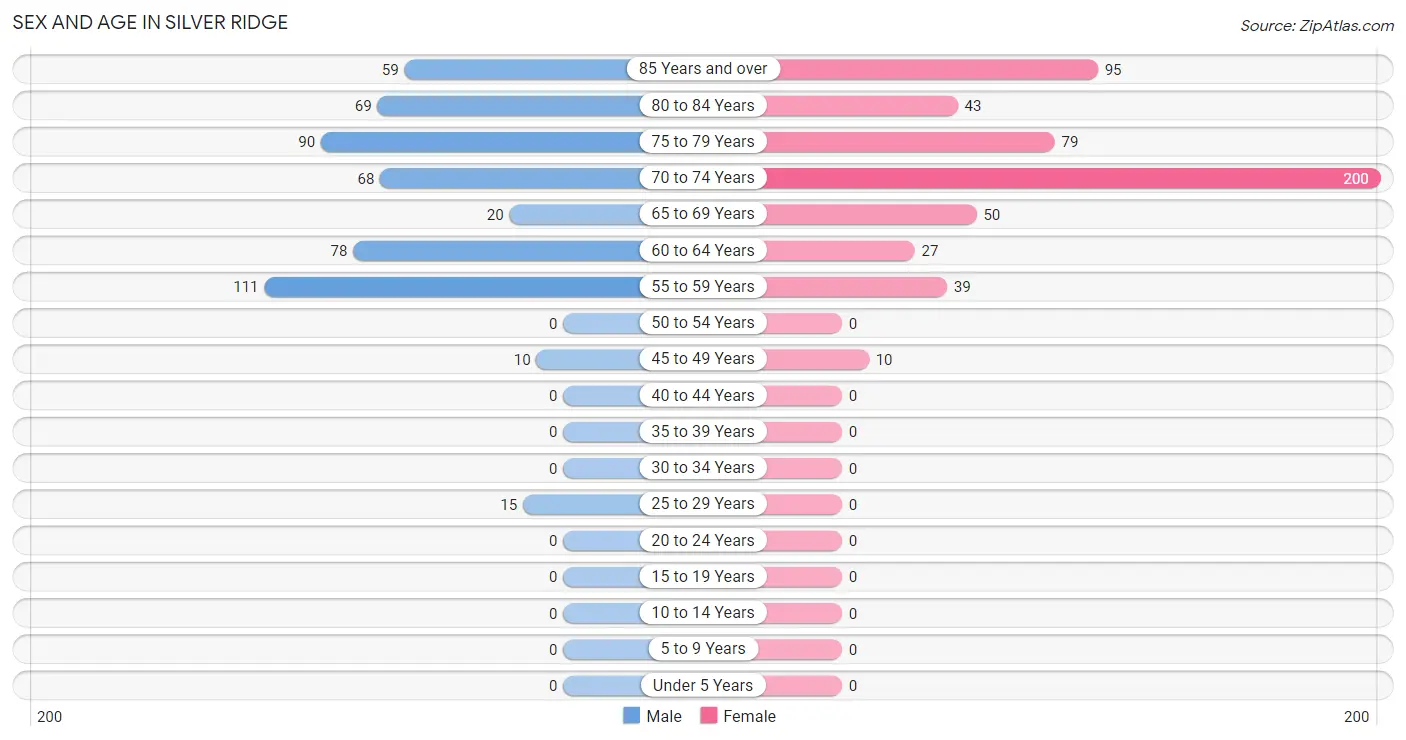
| Age Bracket | Male | Female |
| Under 5 Years | 0 (0.0%) | 0 (0.0%) |
| 5 to 9 Years | 0 (0.0%) | 0 (0.0%) |
| 10 to 14 Years | 0 (0.0%) | 0 (0.0%) |
| 15 to 19 Years | 0 (0.0%) | 0 (0.0%) |
| 20 to 24 Years | 0 (0.0%) | 0 (0.0%) |
| 25 to 29 Years | 15 (2.9%) | 0 (0.0%) |
| 30 to 34 Years | 0 (0.0%) | 0 (0.0%) |
| 35 to 39 Years | 0 (0.0%) | 0 (0.0%) |
| 40 to 44 Years | 0 (0.0%) | 0 (0.0%) |
| 45 to 49 Years | 10 (1.9%) | 10 (1.8%) |
| 50 to 54 Years | 0 (0.0%) | 0 (0.0%) |
| 55 to 59 Years | 111 (21.3%) | 39 (7.2%) |
| 60 to 64 Years | 78 (15.0%) | 27 (5.0%) |
| 65 to 69 Years | 20 (3.8%) | 50 (9.2%) |
| 70 to 74 Years | 68 (13.1%) | 200 (36.8%) |
| 75 to 79 Years | 90 (17.3%) | 79 (14.5%) |
| 80 to 84 Years | 69 (13.3%) | 43 (7.9%) |
| 85 Years and over | 59 (11.4%) | 95 (17.5%) |
| Total | 520 (100.0%) | 543 (100.0%) |
Families and Households in Silver Ridge
Median Family Size in Silver Ridge
The median family size in Silver Ridge is 2.04 persons per family, with single female/mother families (11 | 5.2%) accounting for the largest median family size of 2.36 persons per family. On the other hand, single male/father families (11 | 5.2%) represent the smallest median family size with 2.00 persons per family.
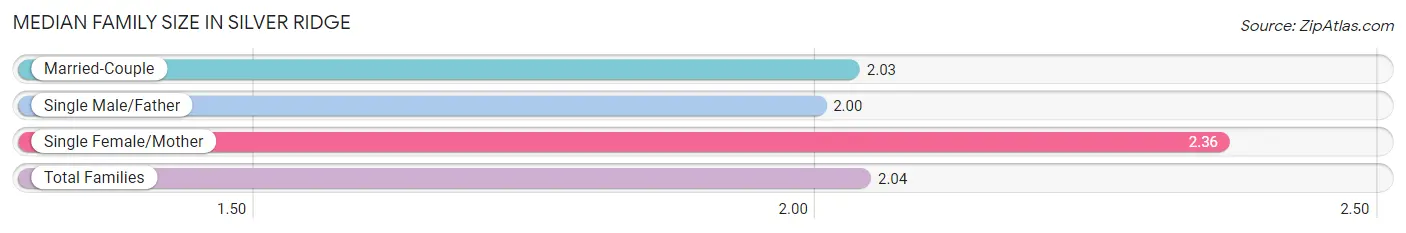
| Family Type | # Families | Family Size |
| Married-Couple | 191 (89.7%) | 2.03 |
| Single Male/Father | 11 (5.2%) | 2.00 |
| Single Female/Mother | 11 (5.2%) | 2.36 |
| Total Families | 213 (100.0%) | 2.04 |
Median Household Size in Silver Ridge
The median household size in Silver Ridge is 1.31 persons per household, with single female/mother households (11 | 1.3%) accounting for the largest median household size of 2.36 persons per household. non-family households (600 | 73.8%) represent the smallest median household size with 1.03 persons per household.
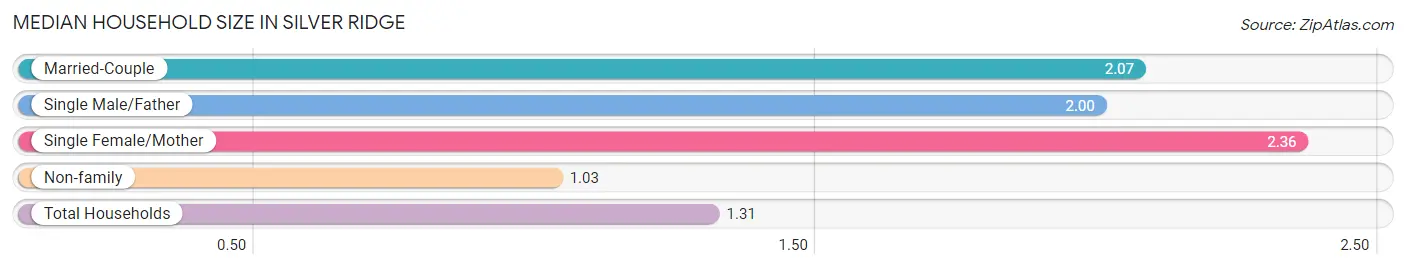
| Household Type | # Households | Household Size |
| Married-Couple | 191 (23.5%) | 2.07 |
| Single Male/Father | 11 (1.3%) | 2.00 |
| Single Female/Mother | 11 (1.3%) | 2.36 |
| Non-family | 600 (73.8%) | 1.03 |
| Total Households | 813 (100.0%) | 1.31 |
Household Size by Marriage Status in Silver Ridge
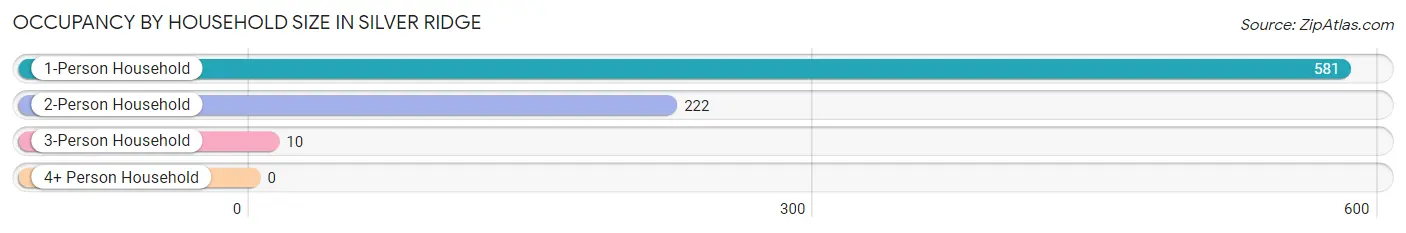
Out of a total of 813 households in Silver Ridge, 213 (26.2%) are family households, while 600 (73.8%) are nonfamily households. The most numerous type of family households are 2-person households, comprising 203, and the most common type of nonfamily households are 1-person households, comprising 581.
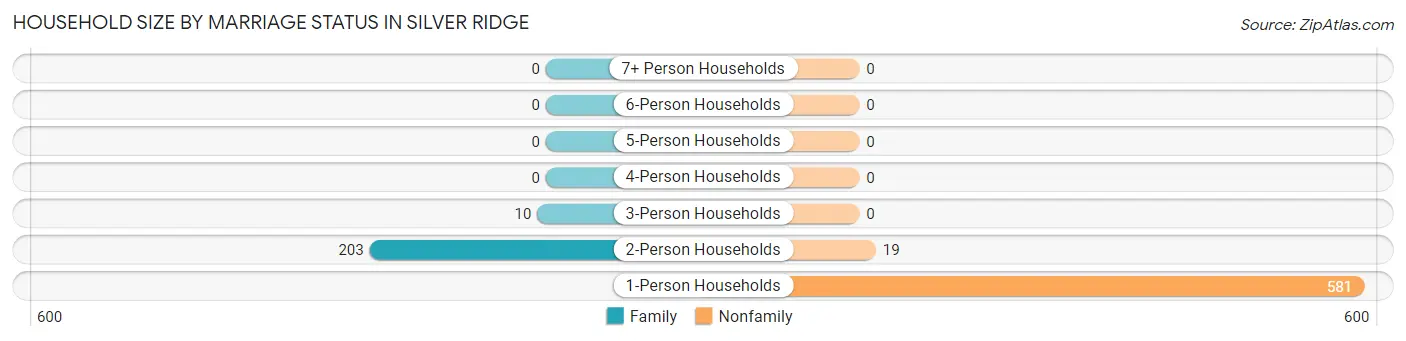
| Household Size | Family Households | Nonfamily Households |
| 1-Person Households | - | 581 (71.5%) |
| 2-Person Households | 203 (25.0%) | 19 (2.3%) |
| 3-Person Households | 10 (1.2%) | 0 (0.0%) |
| 4-Person Households | 0 (0.0%) | 0 (0.0%) |
| 5-Person Households | 0 (0.0%) | 0 (0.0%) |
| 6-Person Households | 0 (0.0%) | 0 (0.0%) |
| 7+ Person Households | 0 (0.0%) | 0 (0.0%) |
| Total | 213 (26.2%) | 600 (73.8%) |
Female Fertility in Silver Ridge
Fertility by Age in Silver Ridge
| Age Bracket | Women with Births | Births / 1,000 Women |
| 15 to 19 years | 0 (0.0%) | 0.0 |
| 20 to 34 years | 0 (0.0%) | 0.0 |
| 35 to 50 years | 0 (0.0%) | 0.0 |
| Total | 0 (0.0%) | 0.0 |
Fertility by Age by Marriage Status in Silver Ridge
| Age Bracket | Married | Unmarried |
| 15 to 19 years | 0 (0.0%) | 0 (0.0%) |
| 20 to 34 years | 0 (0.0%) | 0 (0.0%) |
| 35 to 50 years | 0 (0.0%) | 0 (0.0%) |
| Total | 0 (0.0%) | 0 (0.0%) |
Fertility by Education in Silver Ridge
| Educational Attainment | Women with Births | Births / 1,000 Women |
| Less than High School | 0 (0.0%) | 0.0 |
| High School Diploma | 0 (0.0%) | 0.0 |
| College or Associate's Degree | 0 (0.0%) | 0.0 |
| Bachelor's Degree | 0 (0.0%) | 0.0 |
| Graduate Degree | 0 (0.0%) | 0.0 |
| Total | 0 (0.0%) | 0.0 |
Fertility by Education by Marriage Status in Silver Ridge
| Educational Attainment | Married | Unmarried |
| Less than High School | 0 (0.0%) | 0 (0.0%) |
| High School Diploma | 0 (0.0%) | 0 (0.0%) |
| College or Associate's Degree | 0 (0.0%) | 0 (0.0%) |
| Bachelor's Degree | 0 (0.0%) | 0 (0.0%) |
| Graduate Degree | 0 (0.0%) | 0 (0.0%) |
| Total | 0 (0.0%) | 0 (0.0%) |
Employment Characteristics in Silver Ridge
Employment by Class of Employer in Silver Ridge
Among the 279 employed individuals in Silver Ridge, private company employees (206 | 73.8%), local government employees (21 | 7.5%), and self-employed (not incorporated) (13 | 4.7%) make up the most common classes of employment.
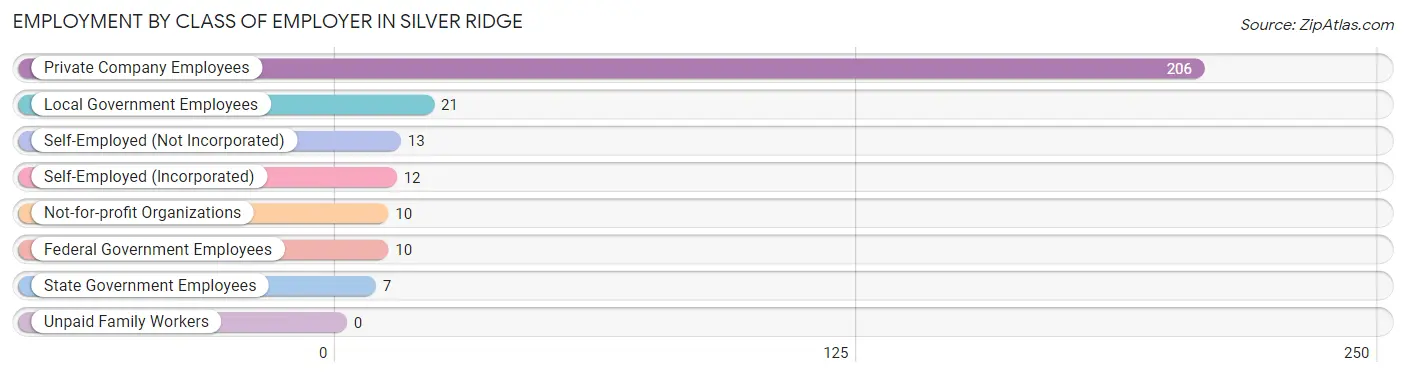
| Employer Class | # Employees | % Employees |
| Private Company Employees | 206 | 73.8% |
| Self-Employed (Incorporated) | 12 | 4.3% |
| Self-Employed (Not Incorporated) | 13 | 4.7% |
| Not-for-profit Organizations | 10 | 3.6% |
| Local Government Employees | 21 | 7.5% |
| State Government Employees | 7 | 2.5% |
| Federal Government Employees | 10 | 3.6% |
| Unpaid Family Workers | 0 | 0.0% |
| Total | 279 | 100.0% |
Employment Status by Age in Silver Ridge
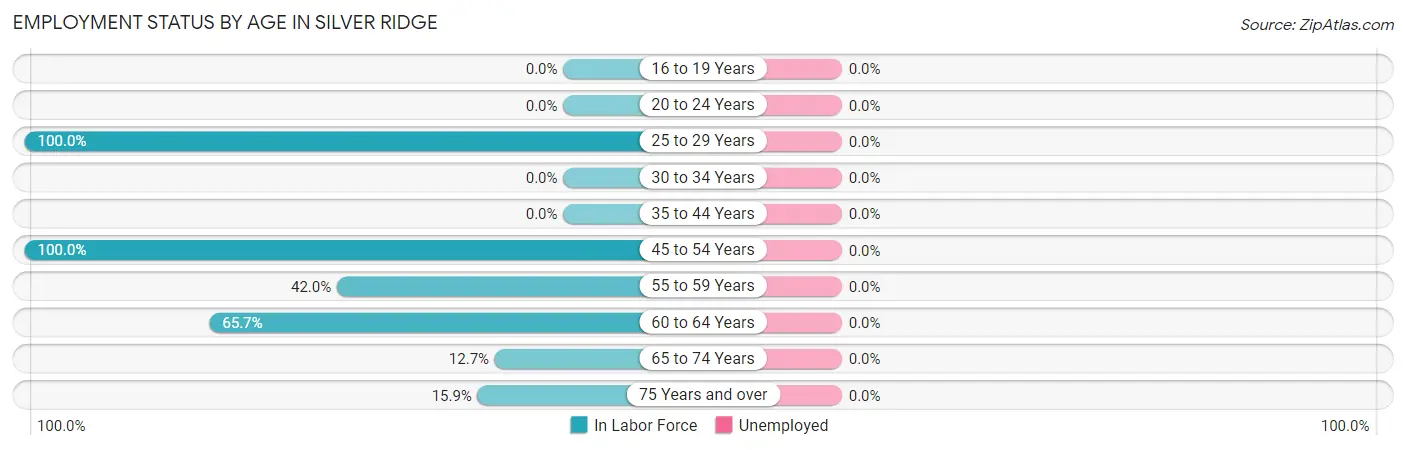
| Age Bracket | In Labor Force | Unemployed |
| 16 to 19 Years | 0 (0.0%) | 0 (0.0%) |
| 20 to 24 Years | 0 (0.0%) | 0 (0.0%) |
| 25 to 29 Years | 15 (100.0%) | 0 (0.0%) |
| 30 to 34 Years | 0 (0.0%) | 0 (0.0%) |
| 35 to 44 Years | 0 (0.0%) | 0 (0.0%) |
| 45 to 54 Years | 20 (100.0%) | 0 (0.0%) |
| 55 to 59 Years | 63 (42.0%) | 0 (0.0%) |
| 60 to 64 Years | 69 (65.7%) | 0 (0.0%) |
| 65 to 74 Years | 43 (12.7%) | 0 (0.0%) |
| 75 Years and over | 69 (15.9%) | 0 (0.0%) |
| Total | 279 (26.2%) | 0 (0.0%) |
Employment Status by Educational Attainment in Silver Ridge
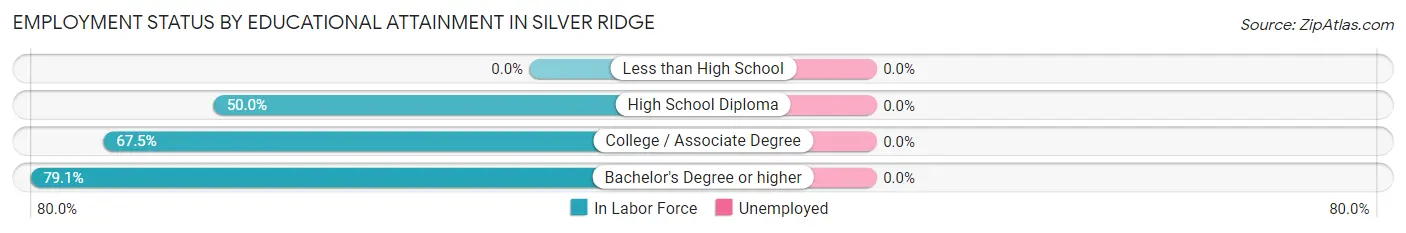
| Educational Attainment | In Labor Force | Unemployed |
| Less than High School | 0 (0.0%) | 0 (0.0%) |
| High School Diploma | 77 (50.0%) | 0 (0.0%) |
| College / Associate Degree | 56 (67.5%) | 0 (0.0%) |
| Bachelor's Degree or higher | 34 (79.1%) | 0 (0.0%) |
| Total | 167 (57.6%) | 0 (0.0%) |
Employment Occupations by Sex in Silver Ridge
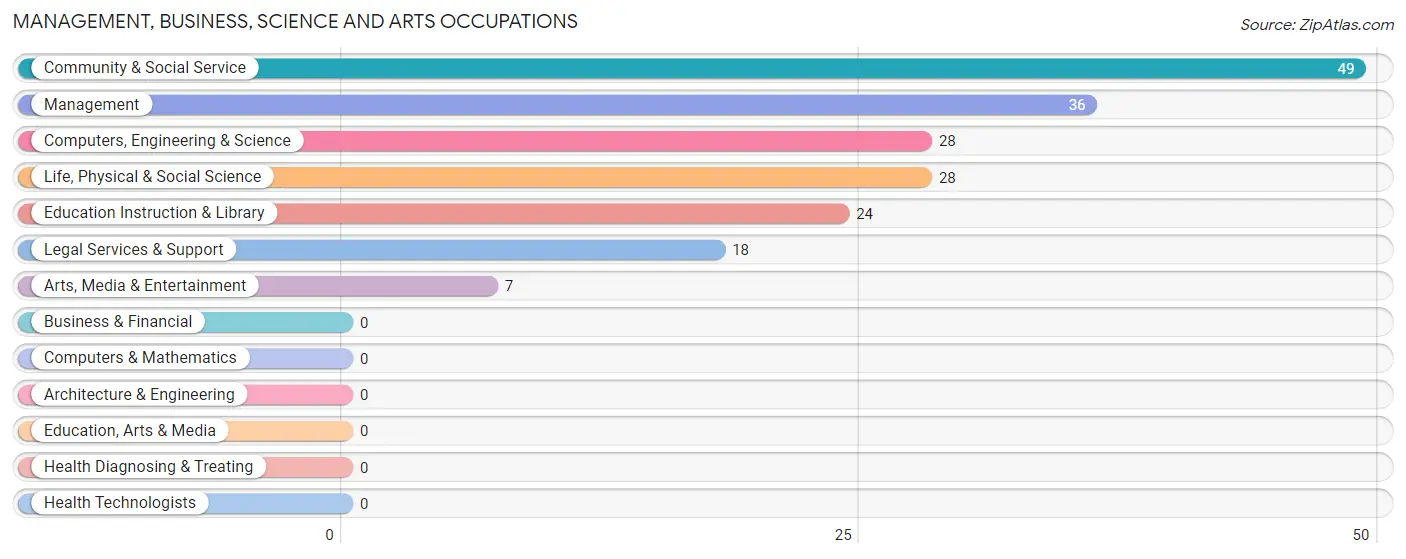
Management, Business, Science and Arts Occupations
The most common Management, Business, Science and Arts occupations in Silver Ridge are Community & Social Service (49 | 17.6%), Management (36 | 12.9%), Computers, Engineering & Science (28 | 10.0%), Life, Physical & Social Science (28 | 10.0%), and Education Instruction & Library (24 | 8.6%).
Management, Business, Science and Arts Occupations by Sex
Within the Management, Business, Science and Arts occupations in Silver Ridge, the most male-oriented occupations are Computers, Engineering & Science (100.0%), Life, Physical & Social Science (100.0%), and Management (72.2%), while the most female-oriented occupations are Community & Social Service (100.0%), Legal Services & Support (100.0%), and Education Instruction & Library (100.0%).
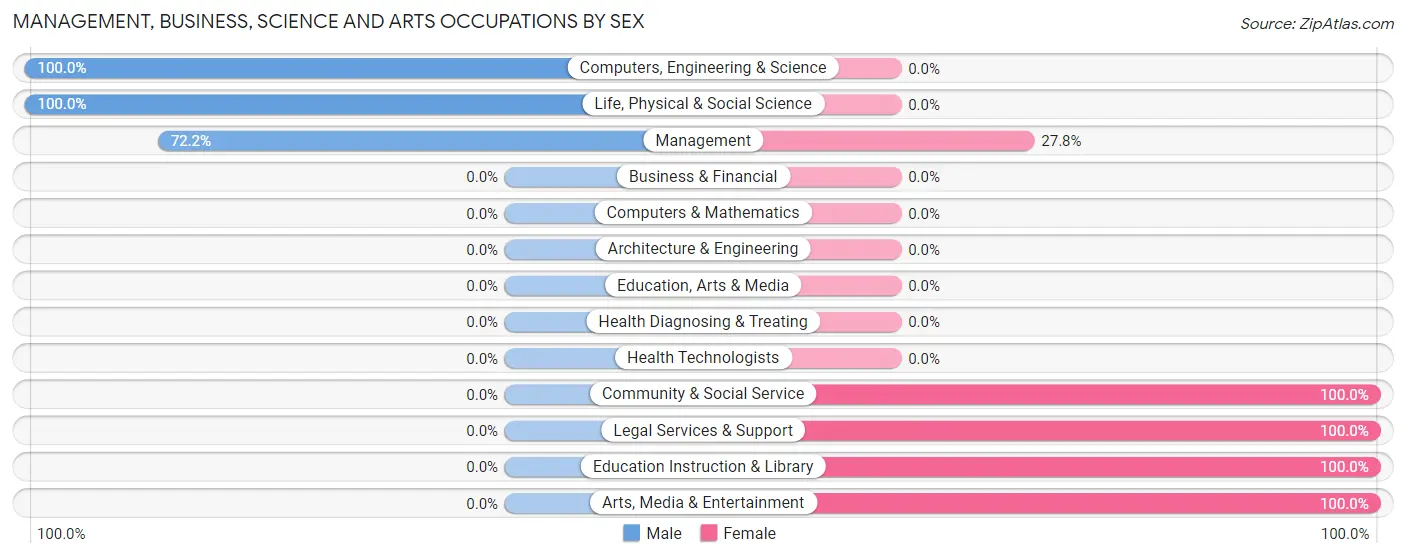
| Occupation | Male | Female |
| Management | 26 (72.2%) | 10 (27.8%) |
| Business & Financial | 0 (0.0%) | 0 (0.0%) |
| Computers, Engineering & Science | 28 (100.0%) | 0 (0.0%) |
| Computers & Mathematics | 0 (0.0%) | 0 (0.0%) |
| Architecture & Engineering | 0 (0.0%) | 0 (0.0%) |
| Life, Physical & Social Science | 28 (100.0%) | 0 (0.0%) |
| Community & Social Service | 0 (0.0%) | 49 (100.0%) |
| Education, Arts & Media | 0 (0.0%) | 0 (0.0%) |
| Legal Services & Support | 0 (0.0%) | 18 (100.0%) |
| Education Instruction & Library | 0 (0.0%) | 24 (100.0%) |
| Arts, Media & Entertainment | 0 (0.0%) | 7 (100.0%) |
| Health Diagnosing & Treating | 0 (0.0%) | 0 (0.0%) |
| Health Technologists | 0 (0.0%) | 0 (0.0%) |
| Total (Category) | 54 (47.8%) | 59 (52.2%) |
| Total (Overall) | 198 (71.0%) | 81 (29.0%) |
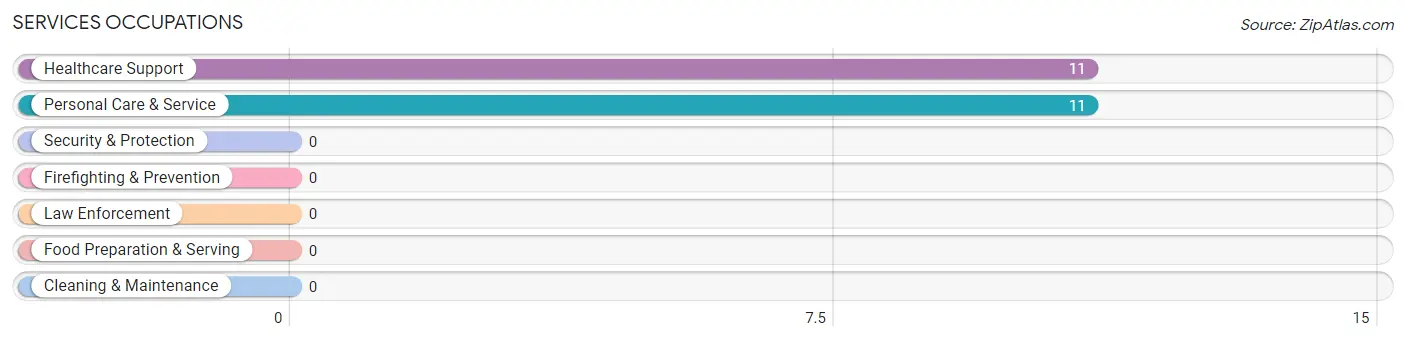
Services Occupations
The most common Services occupations in Silver Ridge are Healthcare Support (11 | 3.9%), and Personal Care & Service (11 | 3.9%).
Services Occupations by Sex
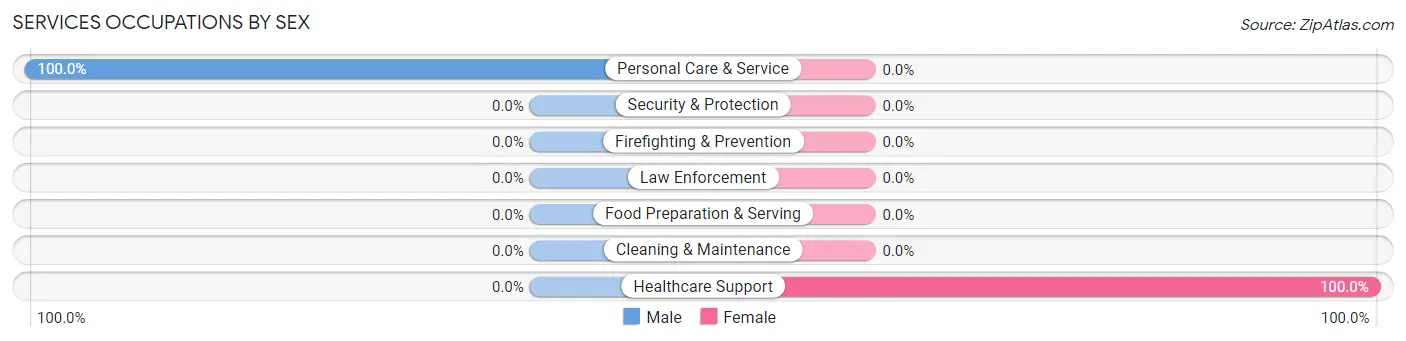
| Occupation | Male | Female |
| Healthcare Support | 0 (0.0%) | 11 (100.0%) |
| Security & Protection | 0 (0.0%) | 0 (0.0%) |
| Firefighting & Prevention | 0 (0.0%) | 0 (0.0%) |
| Law Enforcement | 0 (0.0%) | 0 (0.0%) |
| Food Preparation & Serving | 0 (0.0%) | 0 (0.0%) |
| Cleaning & Maintenance | 0 (0.0%) | 0 (0.0%) |
| Personal Care & Service | 11 (100.0%) | 0 (0.0%) |
| Total (Category) | 11 (50.0%) | 11 (50.0%) |
| Total (Overall) | 198 (71.0%) | 81 (29.0%) |
Sales and Office Occupations
The most common Sales and Office occupations in Silver Ridge are , and Office & Administration (11 | 3.9%).
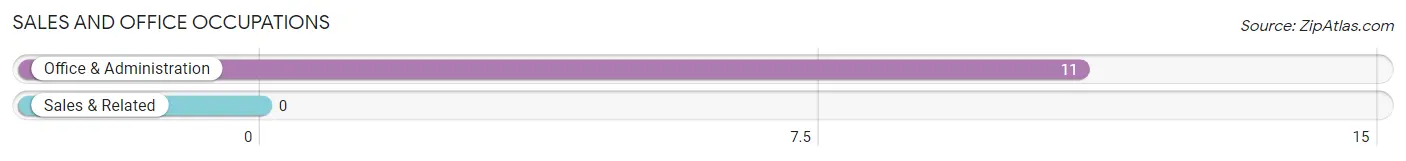
Sales and Office Occupations by Sex
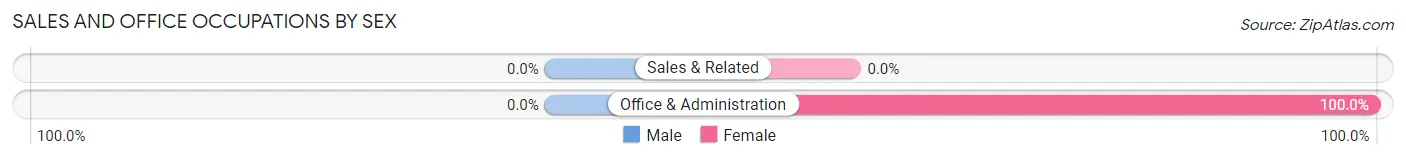
| Occupation | Male | Female |
| Sales & Related | 0 (0.0%) | 0 (0.0%) |
| Office & Administration | 0 (0.0%) | 11 (100.0%) |
| Total (Category) | 0 (0.0%) | 11 (100.0%) |
| Total (Overall) | 198 (71.0%) | 81 (29.0%) |
Natural Resources, Construction and Maintenance Occupations
The most common Natural Resources, Construction and Maintenance occupations in Silver Ridge are Construction & Extraction (43 | 15.4%), and Installation, Maintenance & Repair (25 | 9.0%).
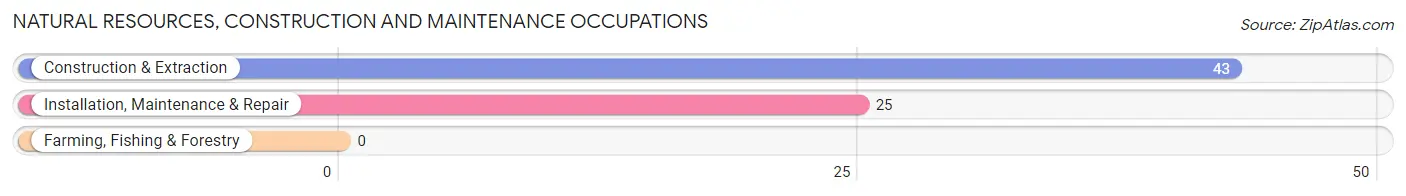
Natural Resources, Construction and Maintenance Occupations by Sex
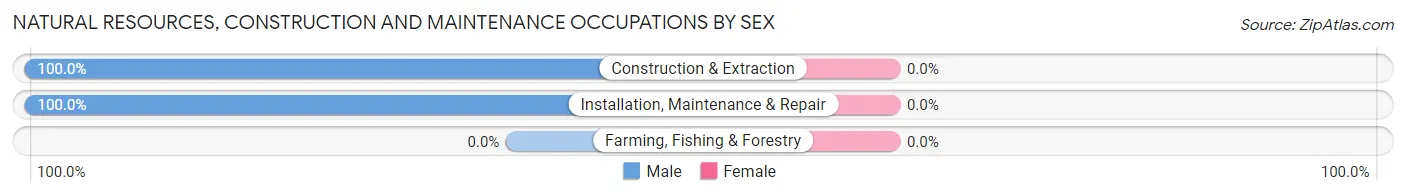
| Occupation | Male | Female |
| Farming, Fishing & Forestry | 0 (0.0%) | 0 (0.0%) |
| Construction & Extraction | 43 (100.0%) | 0 (0.0%) |
| Installation, Maintenance & Repair | 25 (100.0%) | 0 (0.0%) |
| Total (Category) | 68 (100.0%) | 0 (0.0%) |
| Total (Overall) | 198 (71.0%) | 81 (29.0%) |
Production, Transportation and Moving Occupations
The most common Production, Transportation and Moving occupations in Silver Ridge are Transportation (36 | 12.9%), Production (19 | 6.8%), and Material Moving (10 | 3.6%).
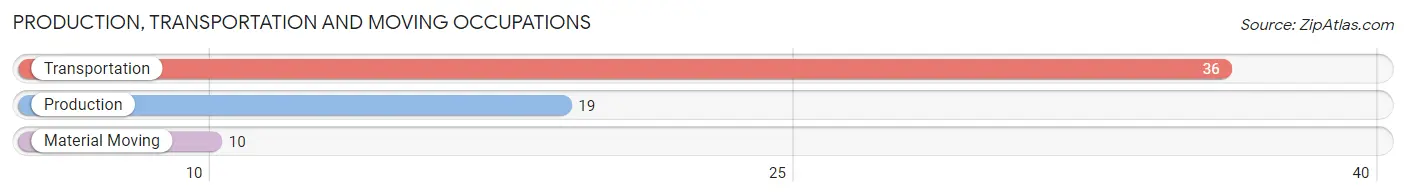
Production, Transportation and Moving Occupations by Sex
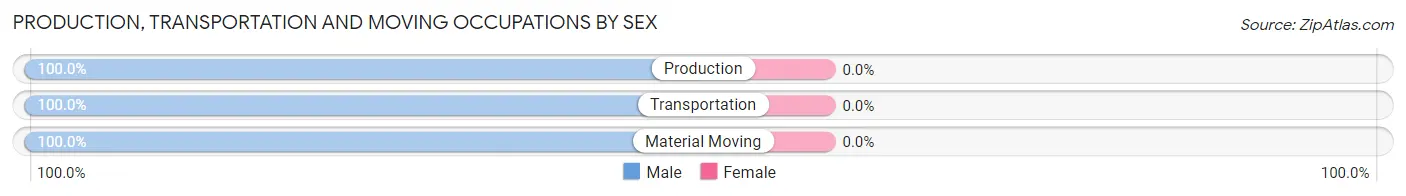
| Occupation | Male | Female |
| Production | 19 (100.0%) | 0 (0.0%) |
| Transportation | 36 (100.0%) | 0 (0.0%) |
| Material Moving | 10 (100.0%) | 0 (0.0%) |
| Total (Category) | 65 (100.0%) | 0 (0.0%) |
| Total (Overall) | 198 (71.0%) | 81 (29.0%) |
Employment Industries by Sex in Silver Ridge
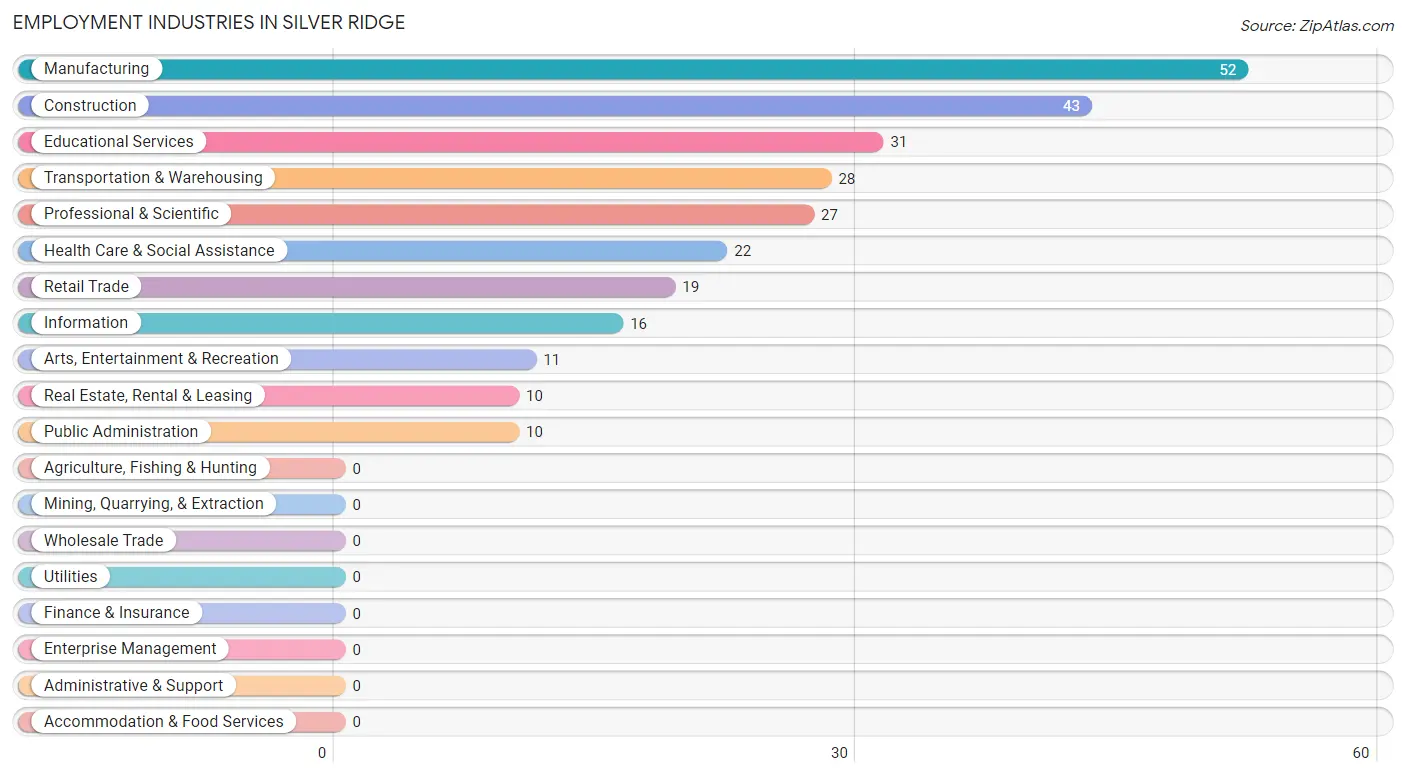
Employment Industries in Silver Ridge
The major employment industries in Silver Ridge include Manufacturing (52 | 18.6%), Construction (43 | 15.4%), Educational Services (31 | 11.1%), Transportation & Warehousing (28 | 10.0%), and Professional & Scientific (27 | 9.7%).
Employment Industries by Sex in Silver Ridge
The Silver Ridge industries that see more men than women are Construction (100.0%), Manufacturing (100.0%), and Retail Trade (100.0%), whereas the industries that tend to have a higher number of women are Educational Services (100.0%), Health Care & Social Assistance (100.0%), and Professional & Scientific (66.7%).
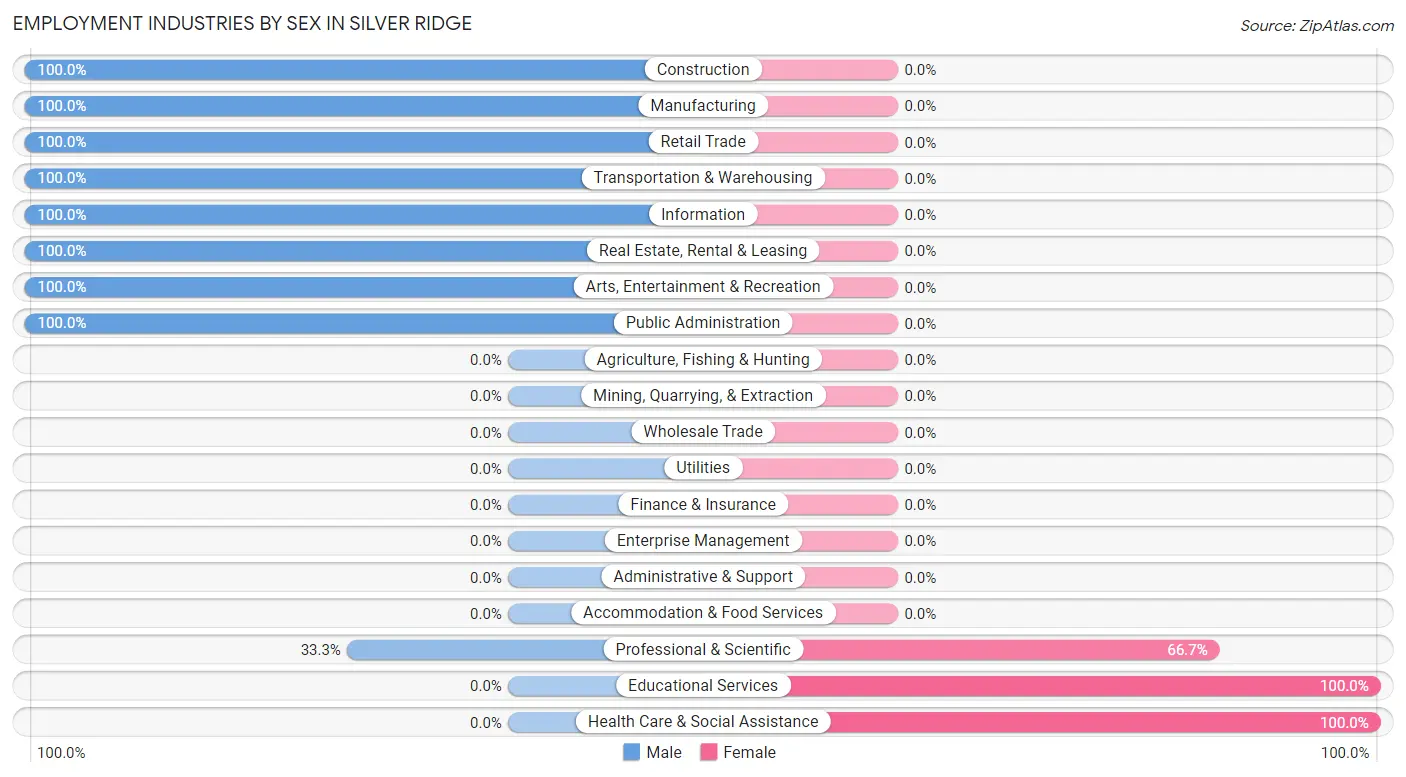
| Industry | Male | Female |
| Agriculture, Fishing & Hunting | 0 (0.0%) | 0 (0.0%) |
| Mining, Quarrying, & Extraction | 0 (0.0%) | 0 (0.0%) |
| Construction | 43 (100.0%) | 0 (0.0%) |
| Manufacturing | 52 (100.0%) | 0 (0.0%) |
| Wholesale Trade | 0 (0.0%) | 0 (0.0%) |
| Retail Trade | 19 (100.0%) | 0 (0.0%) |
| Transportation & Warehousing | 28 (100.0%) | 0 (0.0%) |
| Utilities | 0 (0.0%) | 0 (0.0%) |
| Information | 16 (100.0%) | 0 (0.0%) |
| Finance & Insurance | 0 (0.0%) | 0 (0.0%) |
| Real Estate, Rental & Leasing | 10 (100.0%) | 0 (0.0%) |
| Professional & Scientific | 9 (33.3%) | 18 (66.7%) |
| Enterprise Management | 0 (0.0%) | 0 (0.0%) |
| Administrative & Support | 0 (0.0%) | 0 (0.0%) |
| Educational Services | 0 (0.0%) | 31 (100.0%) |
| Health Care & Social Assistance | 0 (0.0%) | 22 (100.0%) |
| Arts, Entertainment & Recreation | 11 (100.0%) | 0 (0.0%) |
| Accommodation & Food Services | 0 (0.0%) | 0 (0.0%) |
| Public Administration | 10 (100.0%) | 0 (0.0%) |
| Total | 198 (71.0%) | 81 (29.0%) |
Education in Silver Ridge
School Enrollment in Silver Ridge
| School Level | # Students | % Students |
| Nursery / Preschool | 0 | 0.0% |
| Kindergarten | 0 | 0.0% |
| Elementary School | 0 | 0.0% |
| Middle School | 0 | 0.0% |
| High School | 0 | 0.0% |
| College / Undergraduate | 0 | 0.0% |
| Graduate / Professional | 0 | 0.0% |
| Total | 0 | 0.0% |
School Enrollment by Age by Funding Source in Silver Ridge
| Age Bracket | Public School | Private School |
| 3 to 4 Year Olds | 0 (0.0%) | 0 (0.0%) |
| 5 to 9 Year Old | 0 (0.0%) | 0 (0.0%) |
| 10 to 14 Year Olds | 0 (0.0%) | 0 (0.0%) |
| 15 to 17 Year Olds | 0 (0.0%) | 0 (0.0%) |
| 18 to 19 Year Olds | 0 (0.0%) | 0 (0.0%) |
| 20 to 24 Year Olds | 0 (0.0%) | 0 (0.0%) |
| 25 to 34 Year Olds | 0 (0.0%) | 0 (0.0%) |
| 35 Years and over | 0 (0.0%) | 0 (0.0%) |
| Total | 0 (0.0%) | 0 (0.0%) |
Educational Attainment by Field of Study in Silver Ridge
Education (31 | 19.1%), bio, nature & agricultural (28 | 17.3%), business (27 | 16.7%), social sciences (25 | 15.4%), and engineering (24 | 14.8%) are the most common fields of study among 162 individuals in Silver Ridge who have obtained a bachelor's degree or higher.
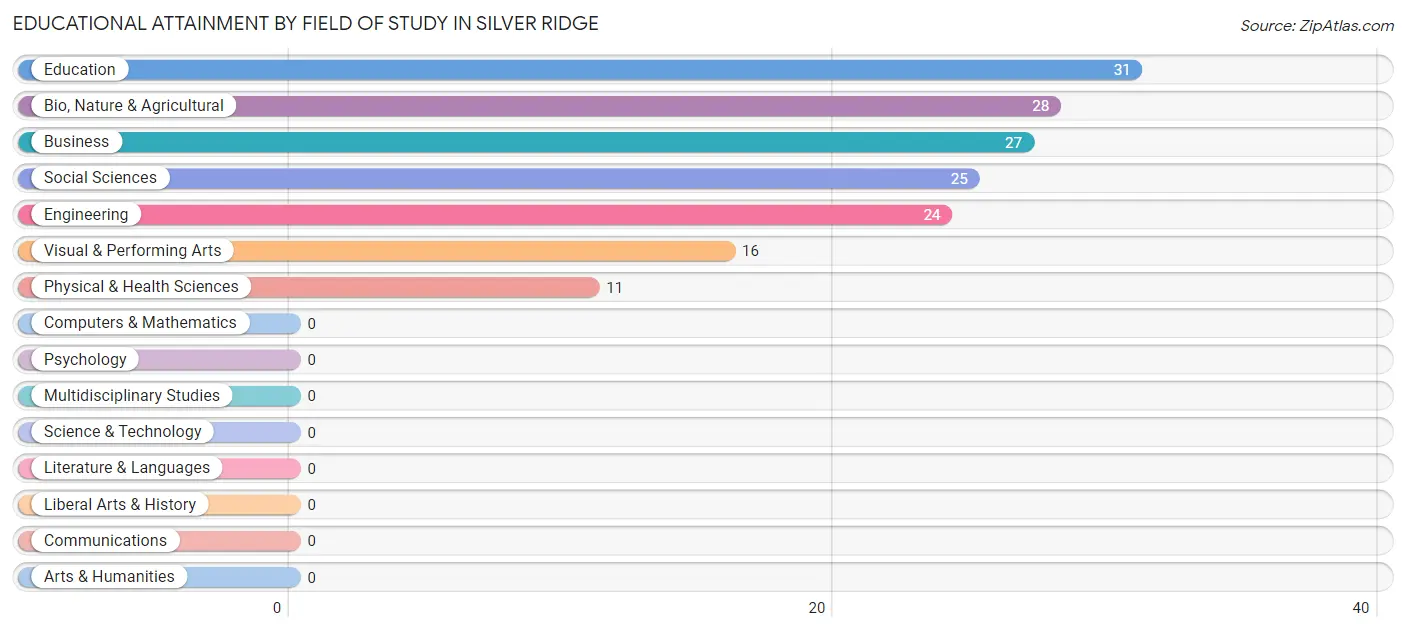
| Field of Study | # Graduates | % Graduates |
| Computers & Mathematics | 0 | 0.0% |
| Bio, Nature & Agricultural | 28 | 17.3% |
| Physical & Health Sciences | 11 | 6.8% |
| Psychology | 0 | 0.0% |
| Social Sciences | 25 | 15.4% |
| Engineering | 24 | 14.8% |
| Multidisciplinary Studies | 0 | 0.0% |
| Science & Technology | 0 | 0.0% |
| Business | 27 | 16.7% |
| Education | 31 | 19.1% |
| Literature & Languages | 0 | 0.0% |
| Liberal Arts & History | 0 | 0.0% |
| Visual & Performing Arts | 16 | 9.9% |
| Communications | 0 | 0.0% |
| Arts & Humanities | 0 | 0.0% |
| Total | 162 | 100.0% |
Transportation & Commute in Silver Ridge
Vehicle Availability by Sex in Silver Ridge
The most prevalent vehicle ownership categories in Silver Ridge are males with 2 vehicles (91, accounting for 46.0%) and females with 2 vehicles (22, making up 112.3%).
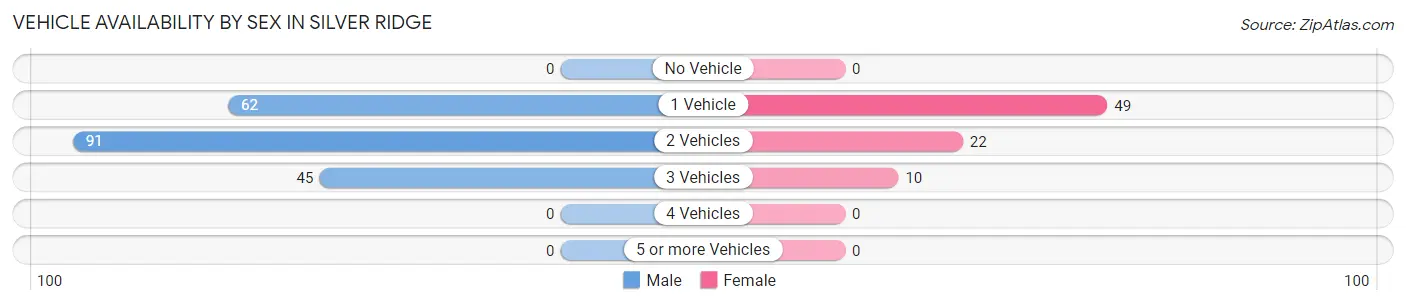
| Vehicles Available | Male | Female |
| No Vehicle | 0 (0.0%) | 0 (0.0%) |
| 1 Vehicle | 62 (31.3%) | 49 (60.5%) |
| 2 Vehicles | 91 (46.0%) | 22 (27.2%) |
| 3 Vehicles | 45 (22.7%) | 10 (12.3%) |
| 4 Vehicles | 0 (0.0%) | 0 (0.0%) |
| 5 or more Vehicles | 0 (0.0%) | 0 (0.0%) |
| Total | 198 (100.0%) | 81 (100.0%) |
Commute Time in Silver Ridge
The most frequently occuring commute durations in Silver Ridge are 15 to 19 minutes (86 commuters, 32.3%), 25 to 29 minutes (67 commuters, 25.2%), and 60 to 89 minutes (31 commuters, 11.7%).
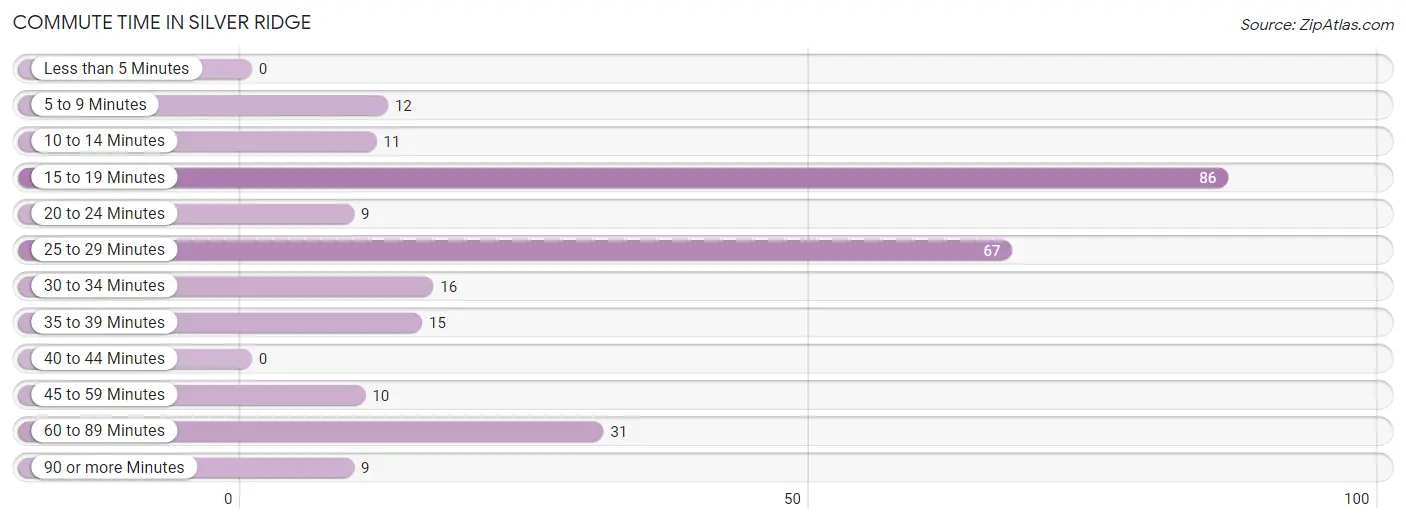
| Commute Time | # Commuters | % Commuters |
| Less than 5 Minutes | 0 | 0.0% |
| 5 to 9 Minutes | 12 | 4.5% |
| 10 to 14 Minutes | 11 | 4.1% |
| 15 to 19 Minutes | 86 | 32.3% |
| 20 to 24 Minutes | 9 | 3.4% |
| 25 to 29 Minutes | 67 | 25.2% |
| 30 to 34 Minutes | 16 | 6.0% |
| 35 to 39 Minutes | 15 | 5.6% |
| 40 to 44 Minutes | 0 | 0.0% |
| 45 to 59 Minutes | 10 | 3.8% |
| 60 to 89 Minutes | 31 | 11.7% |
| 90 or more Minutes | 9 | 3.4% |
Commute Time by Sex in Silver Ridge
The most common commute times in Silver Ridge are 15 to 19 minutes (58 commuters, 29.3%) for males and 25 to 29 minutes (29 commuters, 42.6%) for females.
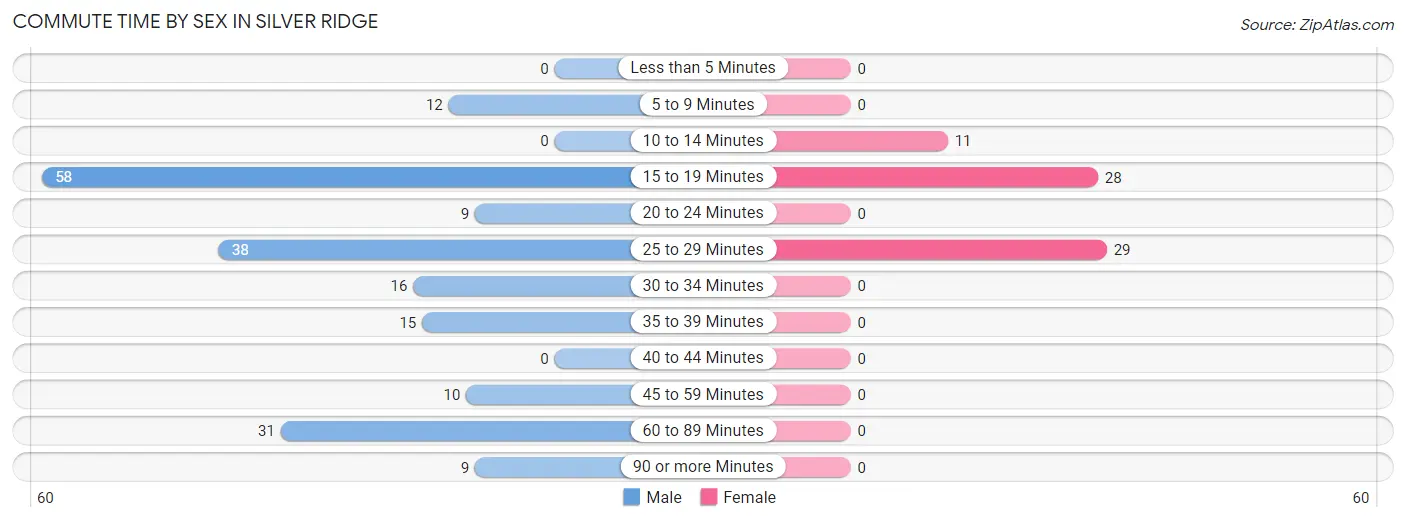
| Commute Time | Male | Female |
| Less than 5 Minutes | 0 (0.0%) | 0 (0.0%) |
| 5 to 9 Minutes | 12 (6.1%) | 0 (0.0%) |
| 10 to 14 Minutes | 0 (0.0%) | 11 (16.2%) |
| 15 to 19 Minutes | 58 (29.3%) | 28 (41.2%) |
| 20 to 24 Minutes | 9 (4.5%) | 0 (0.0%) |
| 25 to 29 Minutes | 38 (19.2%) | 29 (42.6%) |
| 30 to 34 Minutes | 16 (8.1%) | 0 (0.0%) |
| 35 to 39 Minutes | 15 (7.6%) | 0 (0.0%) |
| 40 to 44 Minutes | 0 (0.0%) | 0 (0.0%) |
| 45 to 59 Minutes | 10 (5.1%) | 0 (0.0%) |
| 60 to 89 Minutes | 31 (15.7%) | 0 (0.0%) |
| 90 or more Minutes | 9 (4.5%) | 0 (0.0%) |
Time of Departure to Work by Sex in Silver Ridge
The most frequent times of departure to work in Silver Ridge are 6:00 AM to 6:29 AM (51, 25.8%) for males and 8:30 AM to 8:59 AM (18, 26.5%) for females.
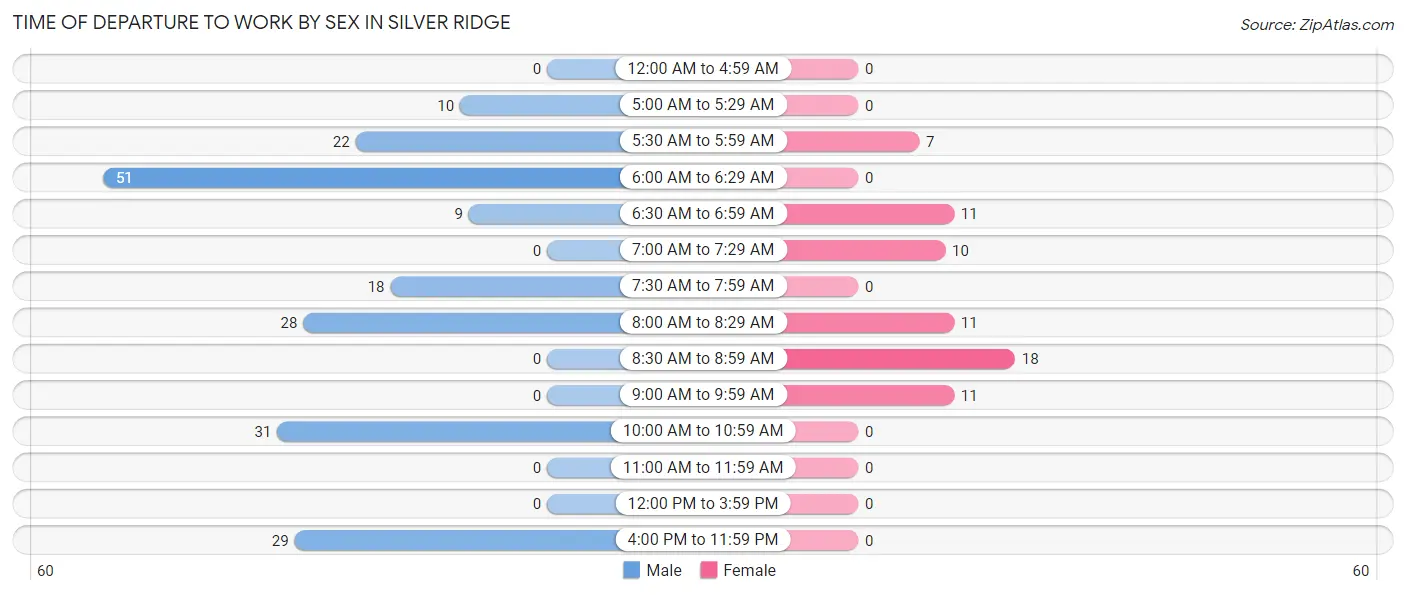
| Time of Departure | Male | Female |
| 12:00 AM to 4:59 AM | 0 (0.0%) | 0 (0.0%) |
| 5:00 AM to 5:29 AM | 10 (5.1%) | 0 (0.0%) |
| 5:30 AM to 5:59 AM | 22 (11.1%) | 7 (10.3%) |
| 6:00 AM to 6:29 AM | 51 (25.8%) | 0 (0.0%) |
| 6:30 AM to 6:59 AM | 9 (4.5%) | 11 (16.2%) |
| 7:00 AM to 7:29 AM | 0 (0.0%) | 10 (14.7%) |
| 7:30 AM to 7:59 AM | 18 (9.1%) | 0 (0.0%) |
| 8:00 AM to 8:29 AM | 28 (14.1%) | 11 (16.2%) |
| 8:30 AM to 8:59 AM | 0 (0.0%) | 18 (26.5%) |
| 9:00 AM to 9:59 AM | 0 (0.0%) | 11 (16.2%) |
| 10:00 AM to 10:59 AM | 31 (15.7%) | 0 (0.0%) |
| 11:00 AM to 11:59 AM | 0 (0.0%) | 0 (0.0%) |
| 12:00 PM to 3:59 PM | 0 (0.0%) | 0 (0.0%) |
| 4:00 PM to 11:59 PM | 29 (14.6%) | 0 (0.0%) |
| Total | 198 (100.0%) | 68 (100.0%) |
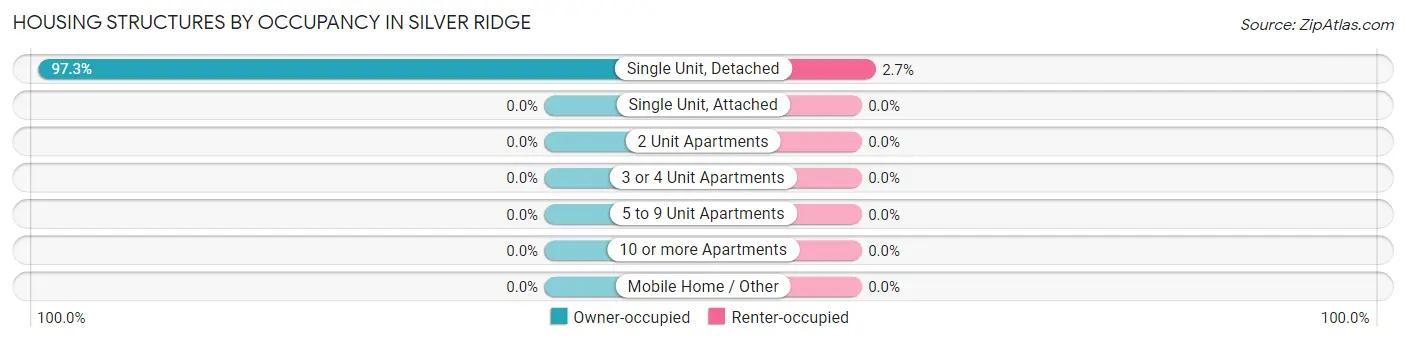
Housing Occupancy in Silver Ridge
Occupancy by Ownership in Silver Ridge
Of the total 813 dwellings in Silver Ridge, owner-occupied units account for 791 (97.3%), while renter-occupied units make up 22 (2.7%).
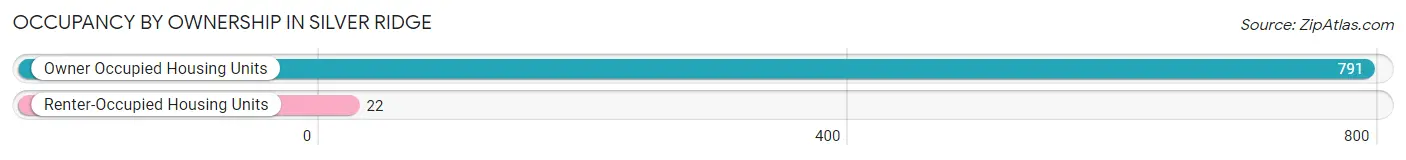
| Occupancy | # Housing Units | % Housing Units |
| Owner Occupied Housing Units | 791 | 97.3% |
| Renter-Occupied Housing Units | 22 | 2.7% |
| Total Occupied Housing Units | 813 | 100.0% |
Occupancy by Household Size in Silver Ridge
| Household Size | # Housing Units | % Housing Units |
| 1-Person Household | 581 | 71.5% |
| 2-Person Household | 222 | 27.3% |
| 3-Person Household | 10 | 1.2% |
| 4+ Person Household | 0 | 0.0% |
| Total Housing Units | 813 | 100.0% |
Occupancy by Ownership by Household Size in Silver Ridge
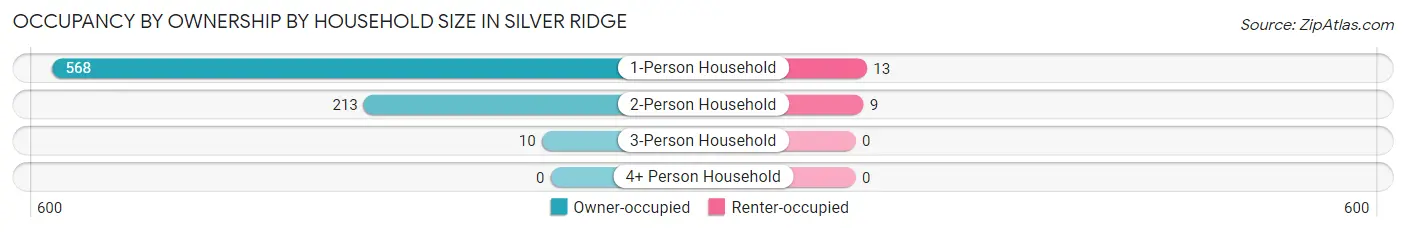
| Household Size | Owner-occupied | Renter-occupied |
| 1-Person Household | 568 (97.8%) | 13 (2.2%) |
| 2-Person Household | 213 (96.0%) | 9 (4.1%) |
| 3-Person Household | 10 (100.0%) | 0 (0.0%) |
| 4+ Person Household | 0 (0.0%) | 0 (0.0%) |
| Total Housing Units | 791 (97.3%) | 22 (2.7%) |
Occupancy by Educational Attainment in Silver Ridge
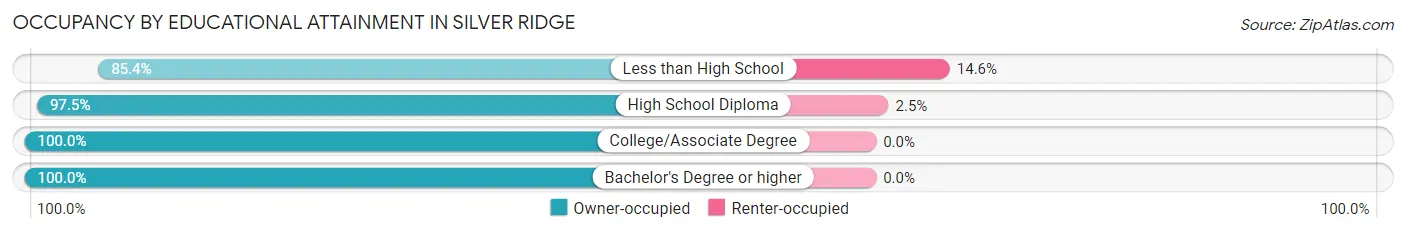
| Household Size | Owner-occupied | Renter-occupied |
| Less than High School | 76 (85.4%) | 13 (14.6%) |
| High School Diploma | 357 (97.5%) | 9 (2.5%) |
| College/Associate Degree | 240 (100.0%) | 0 (0.0%) |
| Bachelor's Degree or higher | 118 (100.0%) | 0 (0.0%) |
Occupancy by Age of Householder in Silver Ridge
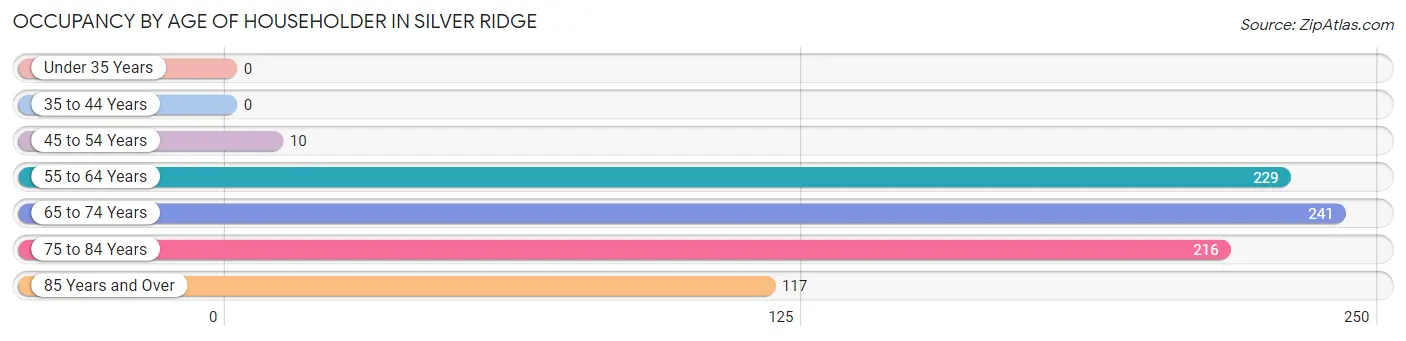
| Age Bracket | # Households | % Households |
| Under 35 Years | 0 | 0.0% |
| 35 to 44 Years | 0 | 0.0% |
| 45 to 54 Years | 10 | 1.2% |
| 55 to 64 Years | 229 | 28.2% |
| 65 to 74 Years | 241 | 29.6% |
| 75 to 84 Years | 216 | 26.6% |
| 85 Years and Over | 117 | 14.4% |
| Total | 813 | 100.0% |
Housing Finances in Silver Ridge
Median Income by Occupancy in Silver Ridge
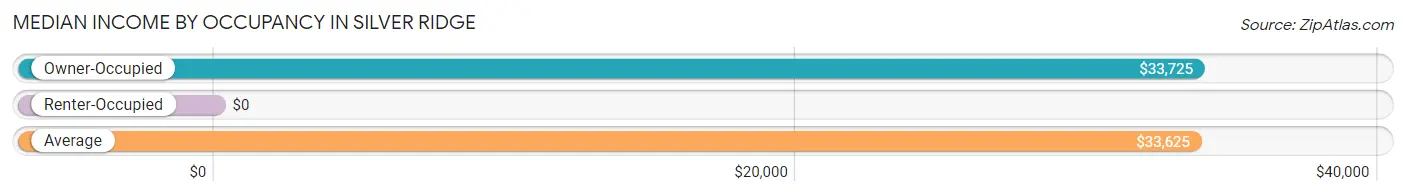
| Occupancy Type | # Households | Median Income |
| Owner-Occupied | 791 (97.3%) | $33,725 |
| Renter-Occupied | 22 (2.7%) | $0 |
| Average | 813 (100.0%) | $33,625 |
Occupancy by Householder Income Bracket in Silver Ridge
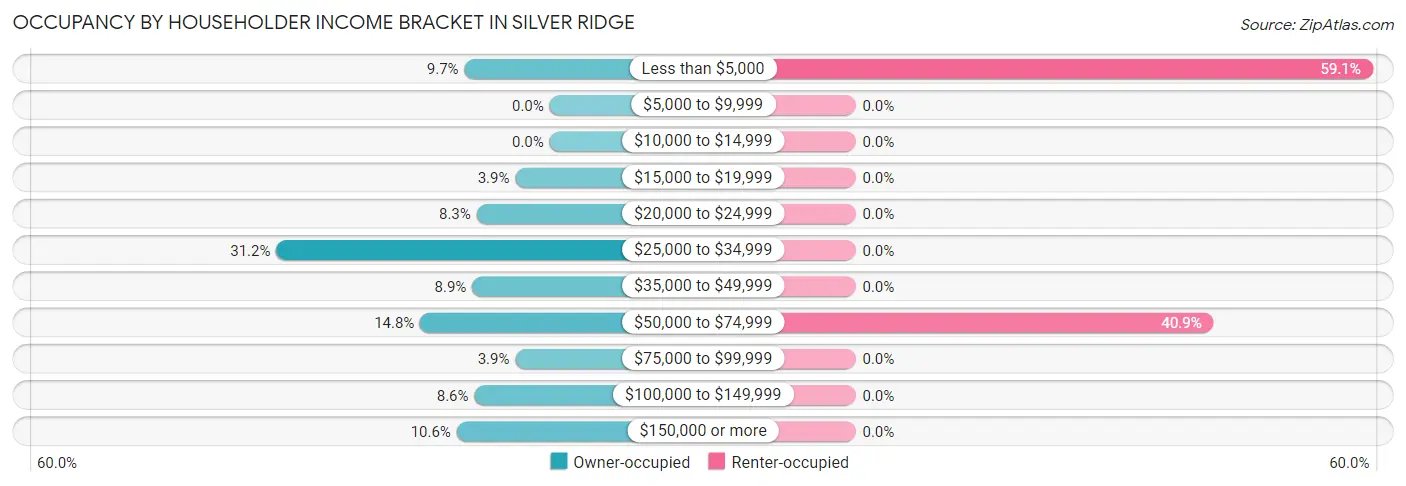
| Income Bracket | Owner-occupied | Renter-occupied |
| Less than $5,000 | 77 (9.7%) | 13 (59.1%) |
| $5,000 to $9,999 | 0 (0.0%) | 0 (0.0%) |
| $10,000 to $14,999 | 0 (0.0%) | 0 (0.0%) |
| $15,000 to $19,999 | 31 (3.9%) | 0 (0.0%) |
| $20,000 to $24,999 | 66 (8.3%) | 0 (0.0%) |
| $25,000 to $34,999 | 247 (31.2%) | 0 (0.0%) |
| $35,000 to $49,999 | 70 (8.8%) | 0 (0.0%) |
| $50,000 to $74,999 | 117 (14.8%) | 9 (40.9%) |
| $75,000 to $99,999 | 31 (3.9%) | 0 (0.0%) |
| $100,000 to $149,999 | 68 (8.6%) | 0 (0.0%) |
| $150,000 or more | 84 (10.6%) | 0 (0.0%) |
| Total | 791 (100.0%) | 22 (100.0%) |
Monthly Housing Cost Tiers in Silver Ridge
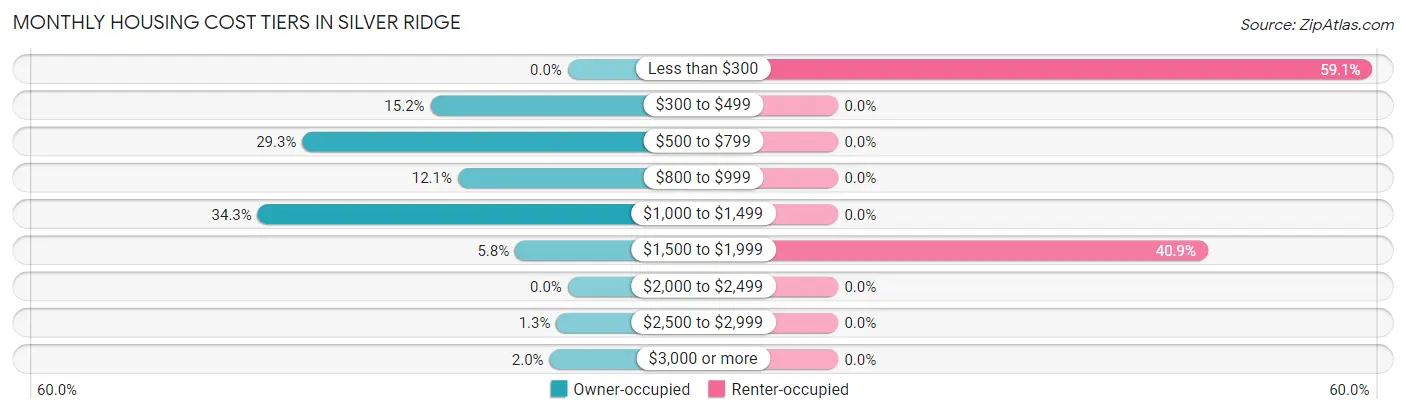
| Monthly Cost | Owner-occupied | Renter-occupied |
| Less than $300 | 0 (0.0%) | 13 (59.1%) |
| $300 to $499 | 120 (15.2%) | 0 (0.0%) |
| $500 to $799 | 232 (29.3%) | 0 (0.0%) |
| $800 to $999 | 96 (12.1%) | 0 (0.0%) |
| $1,000 to $1,499 | 271 (34.3%) | 0 (0.0%) |
| $1,500 to $1,999 | 46 (5.8%) | 9 (40.9%) |
| $2,000 to $2,499 | 0 (0.0%) | 0 (0.0%) |
| $2,500 to $2,999 | 10 (1.3%) | 0 (0.0%) |
| $3,000 or more | 16 (2.0%) | 0 (0.0%) |
| Total | 791 (100.0%) | 22 (100.0%) |
Physical Housing Characteristics in Silver Ridge
Housing Structures in Silver Ridge
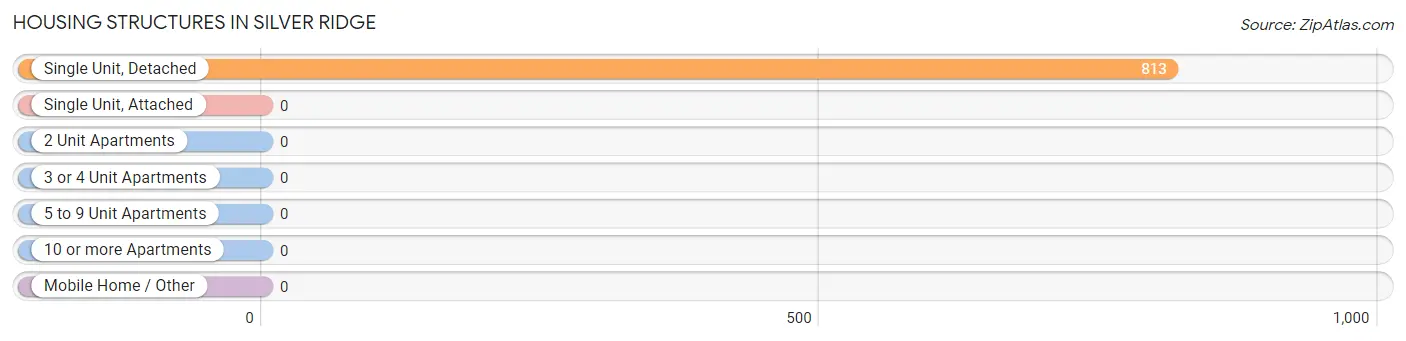
| Structure Type | # Housing Units | % Housing Units |
| Single Unit, Detached | 813 | 100.0% |
| Single Unit, Attached | 0 | 0.0% |
| 2 Unit Apartments | 0 | 0.0% |
| 3 or 4 Unit Apartments | 0 | 0.0% |
| 5 to 9 Unit Apartments | 0 | 0.0% |
| 10 or more Apartments | 0 | 0.0% |
| Mobile Home / Other | 0 | 0.0% |
| Total | 813 | 100.0% |
Housing Structures by Occupancy in Silver Ridge
| Structure Type | Owner-occupied | Renter-occupied |
| Single Unit, Detached | 791 (97.3%) | 22 (2.7%) |
| Single Unit, Attached | 0 (0.0%) | 0 (0.0%) |
| 2 Unit Apartments | 0 (0.0%) | 0 (0.0%) |
| 3 or 4 Unit Apartments | 0 (0.0%) | 0 (0.0%) |
| 5 to 9 Unit Apartments | 0 (0.0%) | 0 (0.0%) |
| 10 or more Apartments | 0 (0.0%) | 0 (0.0%) |
| Mobile Home / Other | 0 (0.0%) | 0 (0.0%) |
| Total | 791 (97.3%) | 22 (2.7%) |
Housing Structures by Number of Rooms in Silver Ridge
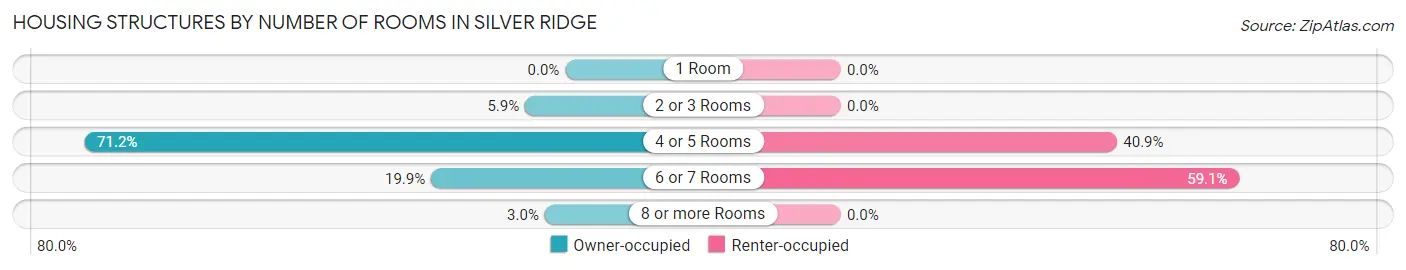
| Number of Rooms | Owner-occupied | Renter-occupied |
| 1 Room | 0 (0.0%) | 0 (0.0%) |
| 2 or 3 Rooms | 47 (5.9%) | 0 (0.0%) |
| 4 or 5 Rooms | 563 (71.2%) | 9 (40.9%) |
| 6 or 7 Rooms | 157 (19.9%) | 13 (59.1%) |
| 8 or more Rooms | 24 (3.0%) | 0 (0.0%) |
| Total | 791 (100.0%) | 22 (100.0%) |
Housing Structure by Heating Type in Silver Ridge
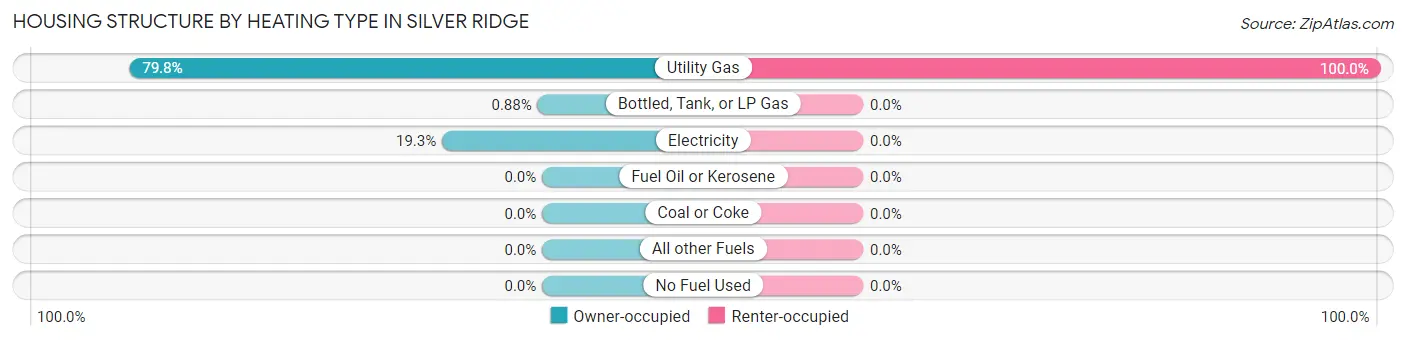
| Heating Type | Owner-occupied | Renter-occupied |
| Utility Gas | 631 (79.8%) | 22 (100.0%) |
| Bottled, Tank, or LP Gas | 7 (0.9%) | 0 (0.0%) |
| Electricity | 153 (19.3%) | 0 (0.0%) |
| Fuel Oil or Kerosene | 0 (0.0%) | 0 (0.0%) |
| Coal or Coke | 0 (0.0%) | 0 (0.0%) |
| All other Fuels | 0 (0.0%) | 0 (0.0%) |
| No Fuel Used | 0 (0.0%) | 0 (0.0%) |
| Total | 791 (100.0%) | 22 (100.0%) |
Household Vehicle Usage in Silver Ridge
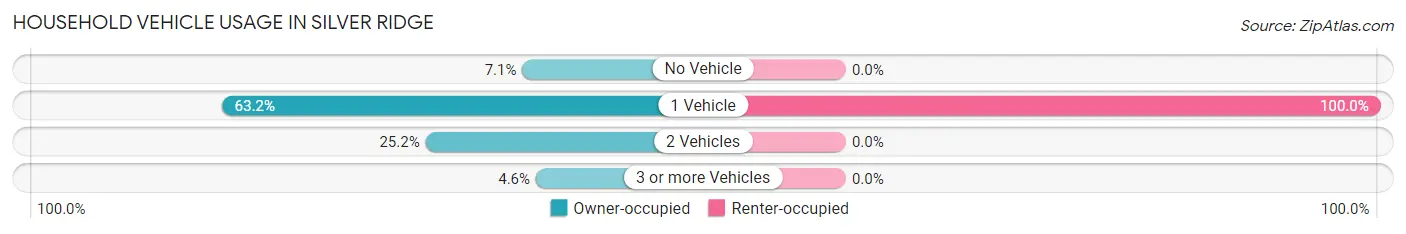
| Vehicles per Household | Owner-occupied | Renter-occupied |
| No Vehicle | 56 (7.1%) | 0 (0.0%) |
| 1 Vehicle | 500 (63.2%) | 22 (100.0%) |
| 2 Vehicles | 199 (25.2%) | 0 (0.0%) |
| 3 or more Vehicles | 36 (4.5%) | 0 (0.0%) |
| Total | 791 (100.0%) | 22 (100.0%) |
Real Estate & Mortgages in Silver Ridge
Real Estate and Mortgage Overview in Silver Ridge
| Characteristic | Without Mortgage | With Mortgage |
| Housing Units | 351 | 440 |
| Median Property Value | $158,000 | $219,200 |
| Median Household Income | $31,971 | $84 |
| Monthly Housing Costs | $538 | $16 |
| Real Estate Taxes | $2,692 | $0 |
Property Value by Mortgage Status in Silver Ridge
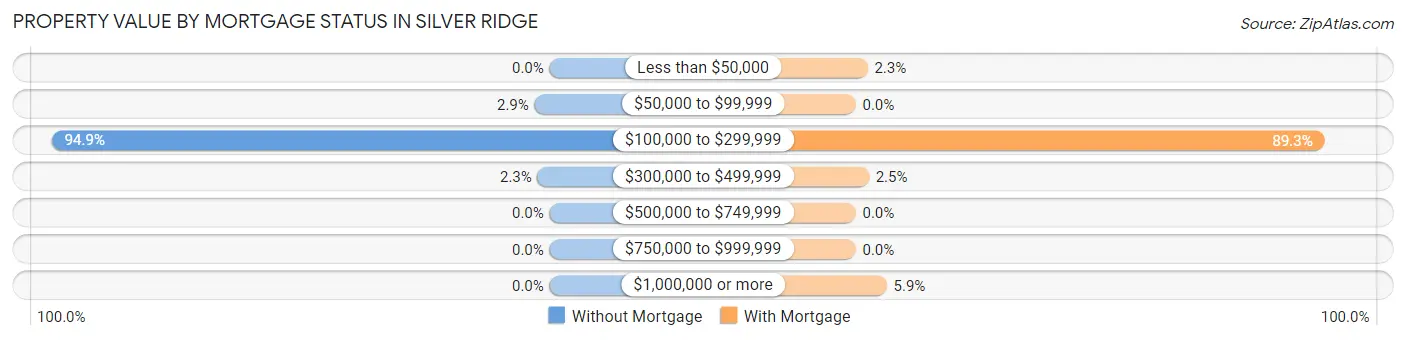
| Property Value | Without Mortgage | With Mortgage |
| Less than $50,000 | 0 (0.0%) | 10 (2.3%) |
| $50,000 to $99,999 | 10 (2.9%) | 0 (0.0%) |
| $100,000 to $299,999 | 333 (94.9%) | 393 (89.3%) |
| $300,000 to $499,999 | 8 (2.3%) | 11 (2.5%) |
| $500,000 to $749,999 | 0 (0.0%) | 0 (0.0%) |
| $750,000 to $999,999 | 0 (0.0%) | 0 (0.0%) |
| $1,000,000 or more | 0 (0.0%) | 26 (5.9%) |
| Total | 351 (100.0%) | 440 (100.0%) |
Household Income by Mortgage Status in Silver Ridge
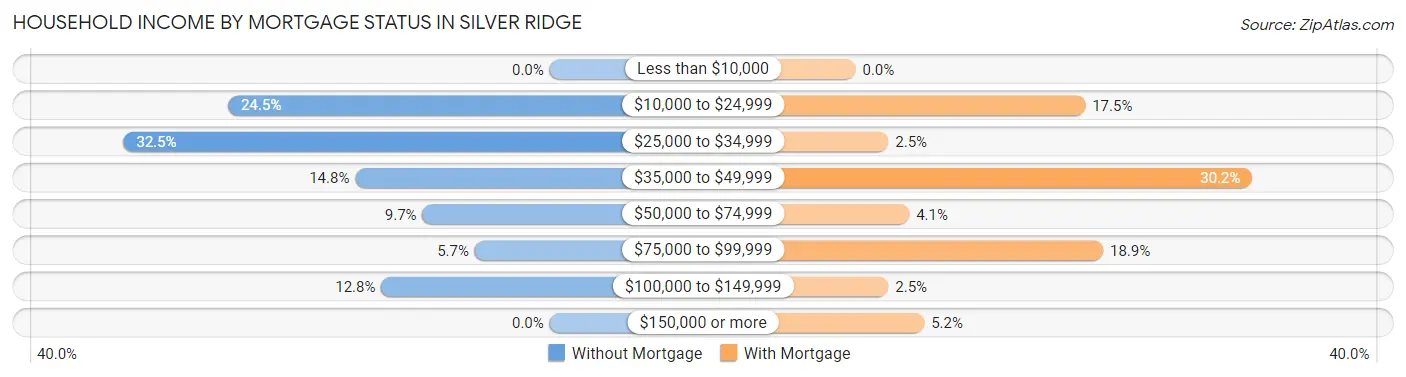
| Household Income | Without Mortgage | With Mortgage |
| Less than $10,000 | 0 (0.0%) | 0 (0.0%) |
| $10,000 to $24,999 | 86 (24.5%) | 77 (17.5%) |
| $25,000 to $34,999 | 114 (32.5%) | 11 (2.5%) |
| $35,000 to $49,999 | 52 (14.8%) | 133 (30.2%) |
| $50,000 to $74,999 | 34 (9.7%) | 18 (4.1%) |
| $75,000 to $99,999 | 20 (5.7%) | 83 (18.9%) |
| $100,000 to $149,999 | 45 (12.8%) | 11 (2.5%) |
| $150,000 or more | 0 (0.0%) | 23 (5.2%) |
| Total | 351 (100.0%) | 440 (100.0%) |
Property Value to Household Income Ratio in Silver Ridge
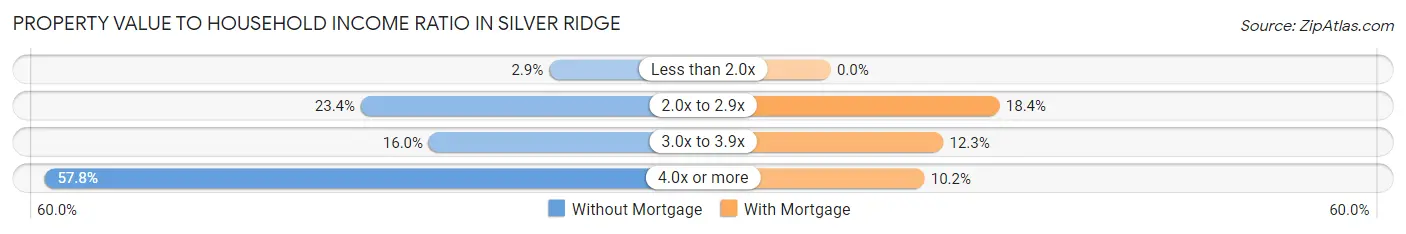
| Value-to-Income Ratio | Without Mortgage | With Mortgage |
| Less than 2.0x | 10 (2.9%) | 0 (0.0%) |
| 2.0x to 2.9x | 82 (23.4%) | 81 (18.4%) |
| 3.0x to 3.9x | 56 (16.0%) | 54 (12.3%) |
| 4.0x or more | 203 (57.8%) | 45 (10.2%) |
| Total | 351 (100.0%) | 440 (100.0%) |
Real Estate Taxes by Mortgage Status in Silver Ridge
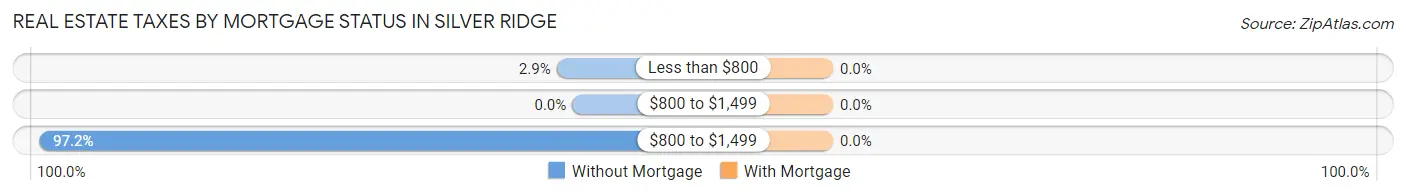
| Property Taxes | Without Mortgage | With Mortgage |
| Less than $800 | 10 (2.9%) | 0 (0.0%) |
| $800 to $1,499 | 0 (0.0%) | 0 (0.0%) |
| $800 to $1,499 | 341 (97.2%) | 0 (0.0%) |
| Total | 351 (100.0%) | 440 (100.0%) |
Health & Disability in Silver Ridge
Health Insurance Coverage by Age in Silver Ridge
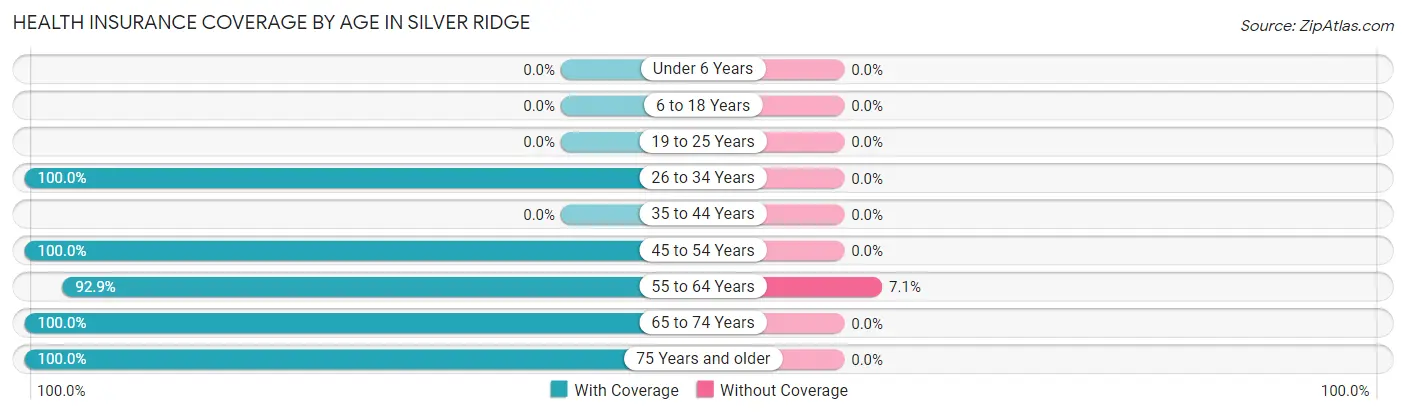
| Age Bracket | With Coverage | Without Coverage |
| Under 6 Years | 0 (0.0%) | 0 (0.0%) |
| 6 to 18 Years | 0 (0.0%) | 0 (0.0%) |
| 19 to 25 Years | 0 (0.0%) | 0 (0.0%) |
| 26 to 34 Years | 15 (100.0%) | 0 (0.0%) |
| 35 to 44 Years | 0 (0.0%) | 0 (0.0%) |
| 45 to 54 Years | 20 (100.0%) | 0 (0.0%) |
| 55 to 64 Years | 237 (92.9%) | 18 (7.1%) |
| 65 to 74 Years | 338 (100.0%) | 0 (0.0%) |
| 75 Years and older | 435 (100.0%) | 0 (0.0%) |
| Total | 1,045 (98.3%) | 18 (1.7%) |
Health Insurance Coverage by Citizenship Status in Silver Ridge
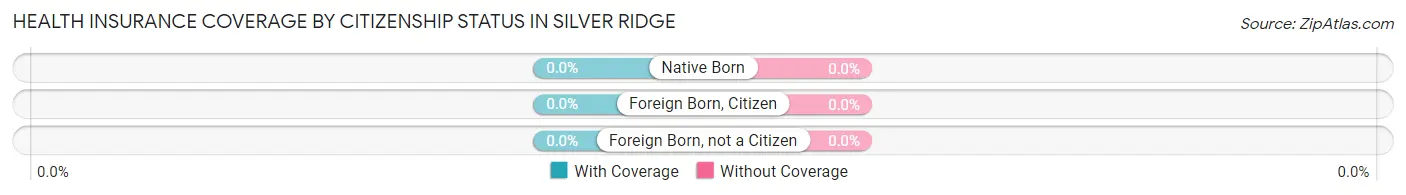
| Citizenship Status | With Coverage | Without Coverage |
| Native Born | 0 (0.0%) | 0 (0.0%) |
| Foreign Born, Citizen | 0 (0.0%) | 0 (0.0%) |
| Foreign Born, not a Citizen | 0 (0.0%) | 0 (0.0%) |
Health Insurance Coverage by Household Income in Silver Ridge
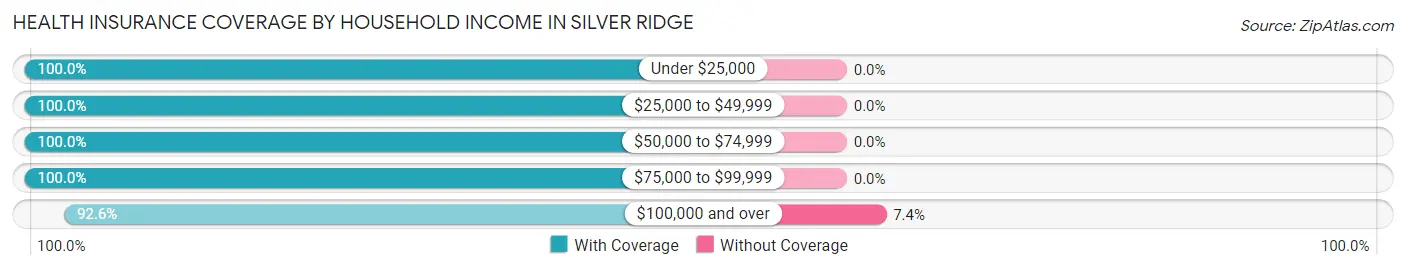
| Household Income | With Coverage | Without Coverage |
| Under $25,000 | 209 (100.0%) | 0 (0.0%) |
| $25,000 to $49,999 | 379 (100.0%) | 0 (0.0%) |
| $50,000 to $74,999 | 163 (100.0%) | 0 (0.0%) |
| $75,000 to $99,999 | 68 (100.0%) | 0 (0.0%) |
| $100,000 and over | 226 (92.6%) | 18 (7.4%) |
Public vs Private Health Insurance Coverage by Age in Silver Ridge
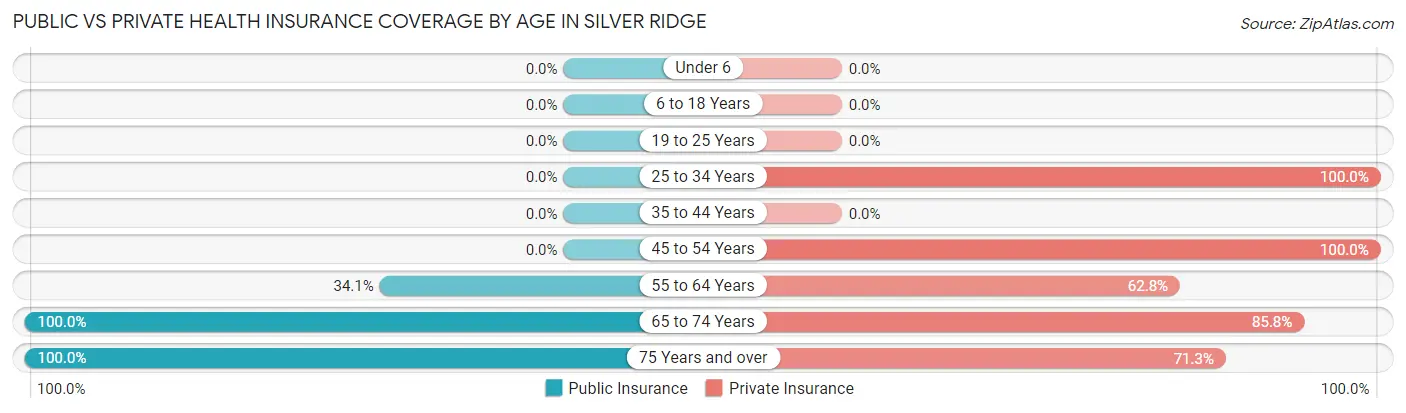
| Age Bracket | Public Insurance | Private Insurance |
| Under 6 | 0 (0.0%) | 0 (0.0%) |
| 6 to 18 Years | 0 (0.0%) | 0 (0.0%) |
| 19 to 25 Years | 0 (0.0%) | 0 (0.0%) |
| 25 to 34 Years | 0 (0.0%) | 15 (100.0%) |
| 35 to 44 Years | 0 (0.0%) | 0 (0.0%) |
| 45 to 54 Years | 0 (0.0%) | 20 (100.0%) |
| 55 to 64 Years | 87 (34.1%) | 160 (62.7%) |
| 65 to 74 Years | 338 (100.0%) | 290 (85.8%) |
| 75 Years and over | 435 (100.0%) | 310 (71.3%) |
| Total | 860 (80.9%) | 795 (74.8%) |
Disability Status by Sex by Age in Silver Ridge
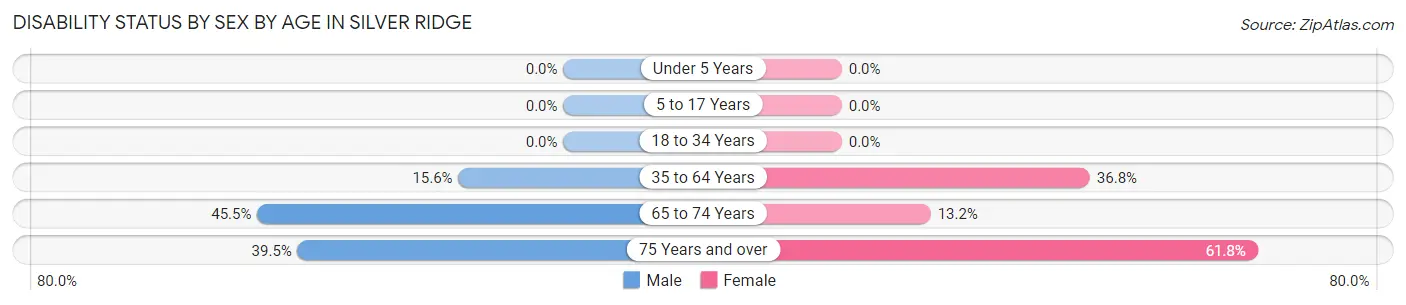
| Age Bracket | Male | Female |
| Under 5 Years | 0 (0.0%) | 0 (0.0%) |
| 5 to 17 Years | 0 (0.0%) | 0 (0.0%) |
| 18 to 34 Years | 0 (0.0%) | 0 (0.0%) |
| 35 to 64 Years | 31 (15.6%) | 28 (36.8%) |
| 65 to 74 Years | 40 (45.5%) | 33 (13.2%) |
| 75 Years and over | 86 (39.5%) | 134 (61.8%) |
Disability Class by Sex by Age in Silver Ridge
Disability Class: Hearing Difficulty
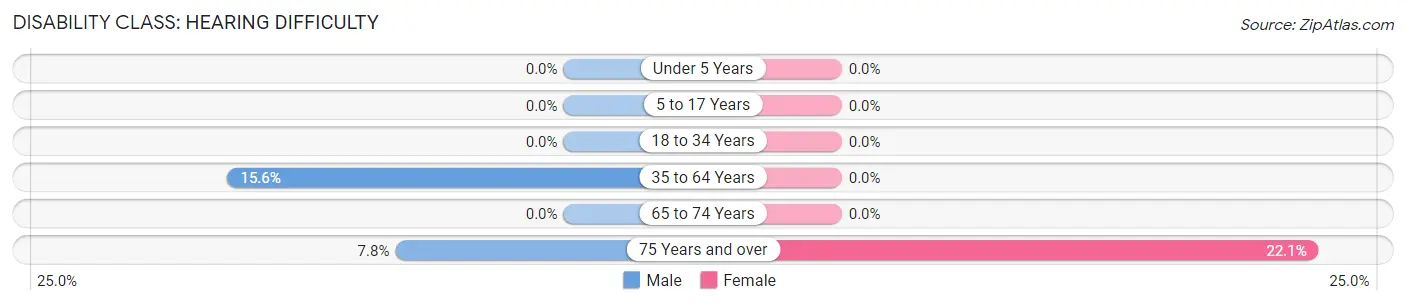
| Age Bracket | Male | Female |
| Under 5 Years | 0 (0.0%) | 0 (0.0%) |
| 5 to 17 Years | 0 (0.0%) | 0 (0.0%) |
| 18 to 34 Years | 0 (0.0%) | 0 (0.0%) |
| 35 to 64 Years | 31 (15.6%) | 0 (0.0%) |
| 65 to 74 Years | 0 (0.0%) | 0 (0.0%) |
| 75 Years and over | 17 (7.8%) | 48 (22.1%) |
Disability Class: Vision Difficulty
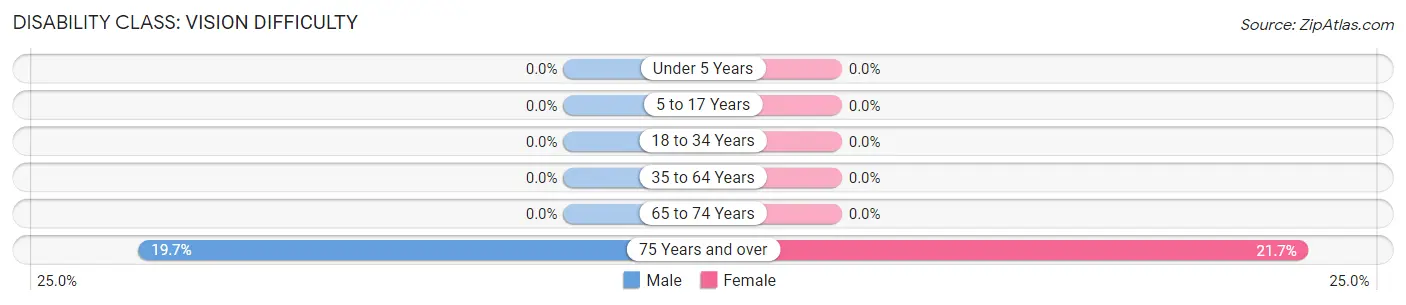
| Age Bracket | Male | Female |
| Under 5 Years | 0 (0.0%) | 0 (0.0%) |
| 5 to 17 Years | 0 (0.0%) | 0 (0.0%) |
| 18 to 34 Years | 0 (0.0%) | 0 (0.0%) |
| 35 to 64 Years | 0 (0.0%) | 0 (0.0%) |
| 65 to 74 Years | 0 (0.0%) | 0 (0.0%) |
| 75 Years and over | 43 (19.7%) | 47 (21.7%) |
Disability Class: Cognitive Difficulty
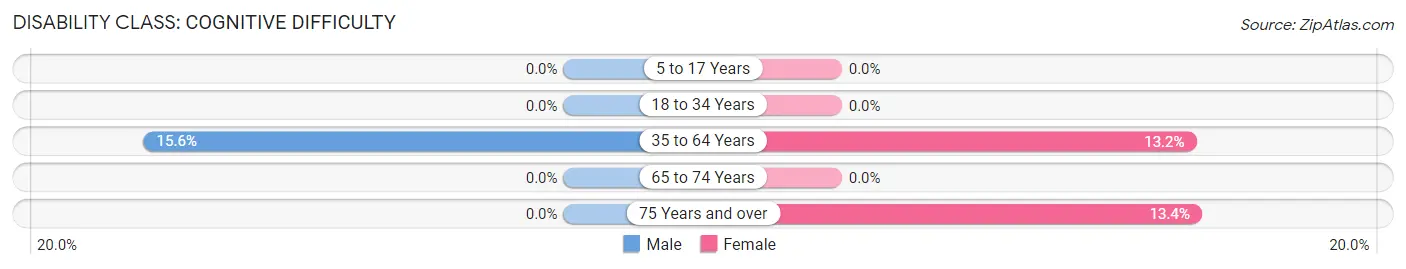
| Age Bracket | Male | Female |
| 5 to 17 Years | 0 (0.0%) | 0 (0.0%) |
| 18 to 34 Years | 0 (0.0%) | 0 (0.0%) |
| 35 to 64 Years | 31 (15.6%) | 10 (13.2%) |
| 65 to 74 Years | 0 (0.0%) | 0 (0.0%) |
| 75 Years and over | 0 (0.0%) | 29 (13.4%) |
Disability Class: Ambulatory Difficulty
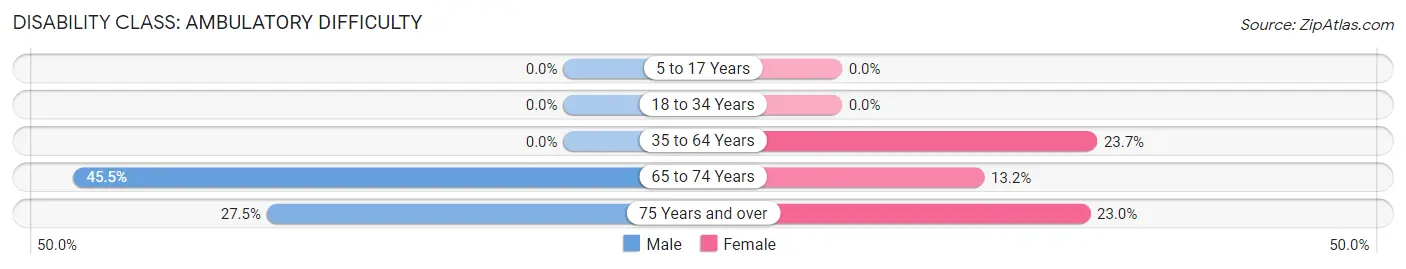
| Age Bracket | Male | Female |
| 5 to 17 Years | 0 (0.0%) | 0 (0.0%) |
| 18 to 34 Years | 0 (0.0%) | 0 (0.0%) |
| 35 to 64 Years | 0 (0.0%) | 18 (23.7%) |
| 65 to 74 Years | 40 (45.5%) | 33 (13.2%) |
| 75 Years and over | 60 (27.5%) | 50 (23.0%) |
Disability Class: Self-Care Difficulty
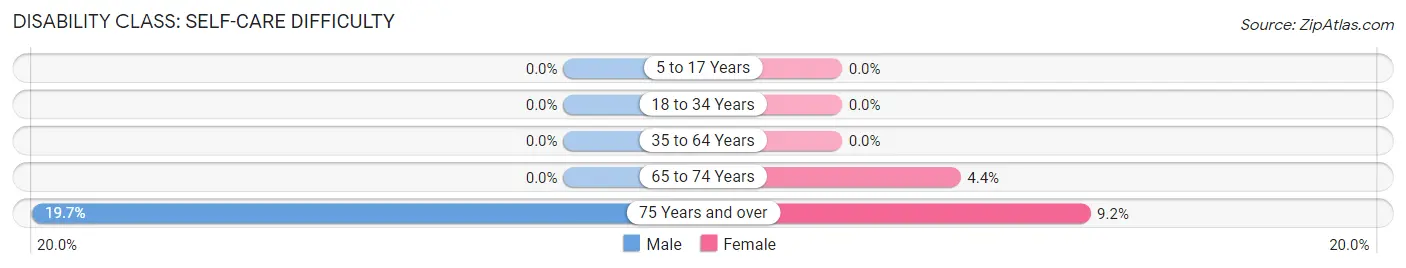
| Age Bracket | Male | Female |
| 5 to 17 Years | 0 (0.0%) | 0 (0.0%) |
| 18 to 34 Years | 0 (0.0%) | 0 (0.0%) |
| 35 to 64 Years | 0 (0.0%) | 0 (0.0%) |
| 65 to 74 Years | 0 (0.0%) | 11 (4.4%) |
| 75 Years and over | 43 (19.7%) | 20 (9.2%) |
Technology Access in Silver Ridge
Computing Device Access in Silver Ridge
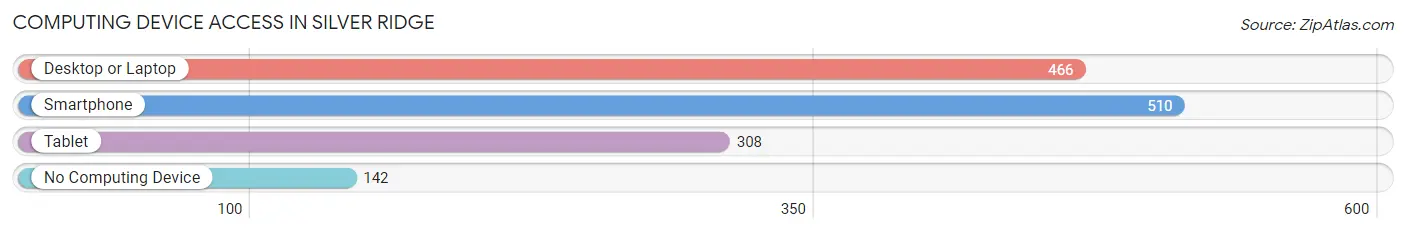
| Device Type | # Households | % Households |
| Desktop or Laptop | 466 | 57.3% |
| Smartphone | 510 | 62.7% |
| Tablet | 308 | 37.9% |
| No Computing Device | 142 | 17.5% |
| Total | 813 | 100.0% |
Internet Access in Silver Ridge
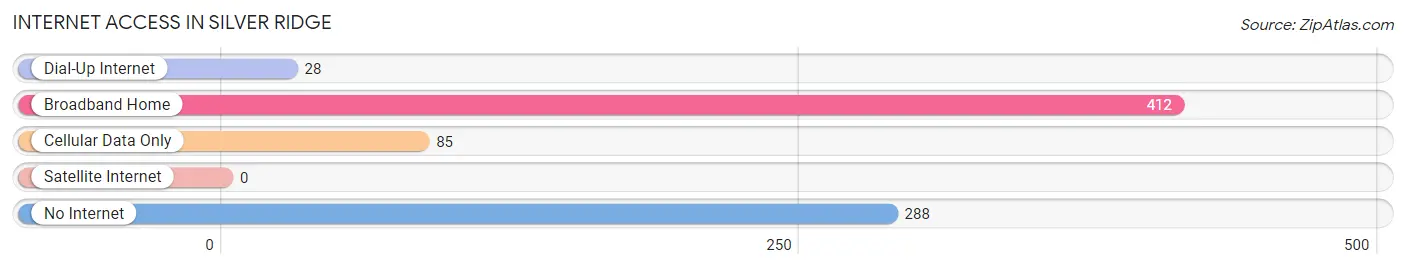
| Internet Type | # Households | % Households |
| Dial-Up Internet | 28 | 3.4% |
| Broadband Home | 412 | 50.7% |
| Cellular Data Only | 85 | 10.5% |
| Satellite Internet | 0 | 0.0% |
| No Internet | 288 | 35.4% |
| Total | 813 | 100.0% |
Silver Ridge Summary
History
Silver Ridge is a small unincorporated community located in Ocean County, New Jersey. It is situated in the northern part of the county, near the border with Monmouth County. The area was first settled in the late 1700s by Dutch and English settlers. The area was originally known as “Silver Ridge” due to the abundance of silver ore in the area. The ore was mined and used to make jewelry and other items.
In the early 1800s, the area was home to a small farming community. The farmers grew a variety of crops, including corn, wheat, and potatoes. The area was also home to a few small businesses, such as a general store and a blacksmith shop.
In the late 1800s, the area began to experience a population boom. This was due to the construction of the Central Railroad of New Jersey, which ran through the area. The railroad brought new people and businesses to the area, and the population continued to grow.
By the early 1900s, Silver Ridge had become a bustling community. The area was home to a variety of businesses, including a post office, a bank, a hotel, and several stores. The area also had a school, a library, and a fire station.
In the mid-1900s, the area began to decline. The railroad was abandoned, and many of the businesses closed. The population began to decline as well, and by the late 1900s, the area was mostly abandoned.
Geography
Silver Ridge is located in the northern part of Ocean County, New Jersey. It is situated near the border with Monmouth County. The area is mostly rural, with rolling hills and forests. The area is home to several small lakes, including Silver Lake and Lake Shenandoah.
The area is located near the Garden State Parkway, which runs through the area. The nearest major city is Toms River, which is located about 15 miles away.
Economy
The economy of Silver Ridge is largely based on agriculture. The area is home to several farms, which grow a variety of crops, including corn, wheat, and potatoes. The area is also home to several small businesses, such as a general store and a blacksmith shop.
The area is also home to a few small manufacturing companies. These companies produce a variety of products, including furniture, clothing, and electronics.
Demographics
As of the 2010 census, the population of Silver Ridge was 1,845. The population is mostly white (94.3%), with a small percentage of African Americans (2.2%) and Hispanics (2.5%). The median household income is $60,000, and the median home value is $220,000.
Conclusion
Silver Ridge is a small unincorporated community located in Ocean County, New Jersey. It is situated in the northern part of the county, near the border with Monmouth County. The area was first settled in the late 1700s by Dutch and English settlers. The area was originally known as “Silver Ridge” due to the abundance of silver ore in the area. The ore was mined and used to make jewelry and other items.
Today, Silver Ridge is a mostly rural area with a population of 1,845. The economy is largely based on agriculture, with several farms growing a variety of crops. The area is also home to several small businesses, such as a general store and a blacksmith shop. The area is located near the Garden State Parkway, and the nearest major city is Toms River, which is located about 15 miles away.
Common Questions
What is Per Capita Income in Silver Ridge?
Per Capita income in Silver Ridge is $88,677.
What is the Median Family Income in Silver Ridge?
Median Family Income in Silver Ridge is $78,188.
What is the Median Household income in Silver Ridge?
Median Household Income in Silver Ridge is $33,625.
What is Inequality or Gini Index in Silver Ridge?
Inequality or Gini Index in Silver Ridge is 0.72.
What is the Total Population of Silver Ridge?
Total Population of Silver Ridge is 1,063.
What is the Total Male Population of Silver Ridge?
Total Male Population of Silver Ridge is 520.
What is the Total Female Population of Silver Ridge?
Total Female Population of Silver Ridge is 543.
What is the Ratio of Males per 100 Females in Silver Ridge?
There are 95.76 Males per 100 Females in Silver Ridge.
What is the Ratio of Females per 100 Males in Silver Ridge?
There are 104.42 Females per 100 Males in Silver Ridge.
What is the Median Population Age in Silver Ridge?
Median Population Age in Silver Ridge is 74.3 Years.
What is the Average Family Size in Silver Ridge
Average Family Size in Silver Ridge is 2.0 People.
What is the Average Household Size in Silver Ridge
Average Household Size in Silver Ridge is 1.3 People.
How Large is the Labor Force in Silver Ridge?
There are 279 People in the Labor Forcein in Silver Ridge.
What is the Percentage of People in the Labor Force in Silver Ridge?
26.2% of People are in the Labor Force in Silver Ridge.