Finderne, NJ Map & Demographics
Finderne Map
Finderne Overview
$48,486
PER CAPITA INCOME
$101,838
AVG FAMILY INCOME
$101,029
AVG HOUSEHOLD INCOME
8.1%
WAGE / INCOME GAP [ % ]
91.9¢/ $1
WAGE / INCOME GAP [ $ ]
0.36
INEQUALITY / GINI INDEX
5,881
TOTAL POPULATION
2,853
MALE POPULATION
3,028
FEMALE POPULATION
94.22
MALES / 100 FEMALES
106.13
FEMALES / 100 MALES
41.9
MEDIAN AGE
3.0
AVG FAMILY SIZE
2.4
AVG HOUSEHOLD SIZE
3,259
LABOR FORCE [ PEOPLE ]
63.1%
PERCENT IN LABOR FORCE
5.0%
UNEMPLOYMENT RATE
Income in Finderne
Income Overview in Finderne
Per Capita Income in Finderne is $48,486, while median incomes of families and households are $101,838 and $101,029 respectively.
| Characteristic | Number | Measure |
| Per Capita Income | 5,881 | $48,486 |
| Median Family Income | 1,423 | $101,838 |
| Mean Family Income | 1,423 | $126,877 |
| Median Household Income | 2,384 | $101,029 |
| Mean Household Income | 2,384 | $116,948 |
| Income Deficit | 1,423 | $0 |
| Wage / Income Gap (%) | 5,881 | 8.08% |
| Wage / Income Gap ($) | 5,881 | 91.92¢ per $1 |
| Gini / Inequality Index | 5,881 | 0.36 |
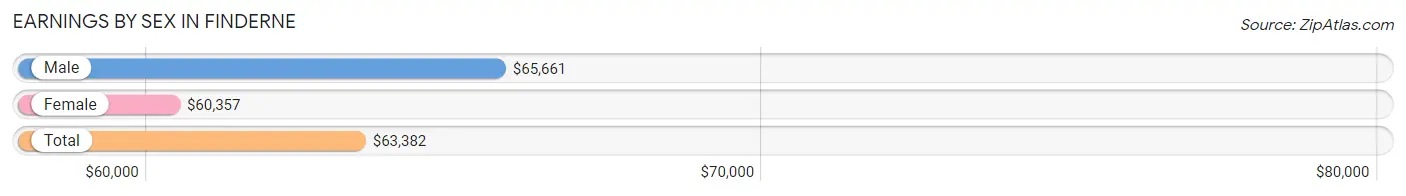
Earnings by Sex in Finderne
Average Earnings in Finderne are $63,382, $65,661 for men and $60,357 for women, a difference of 8.1%.
| Sex | Number | Average Earnings |
| Male | 1,737 (50.0%) | $65,661 |
| Female | 1,734 (50.0%) | $60,357 |
| Total | 3,471 (100.0%) | $63,382 |
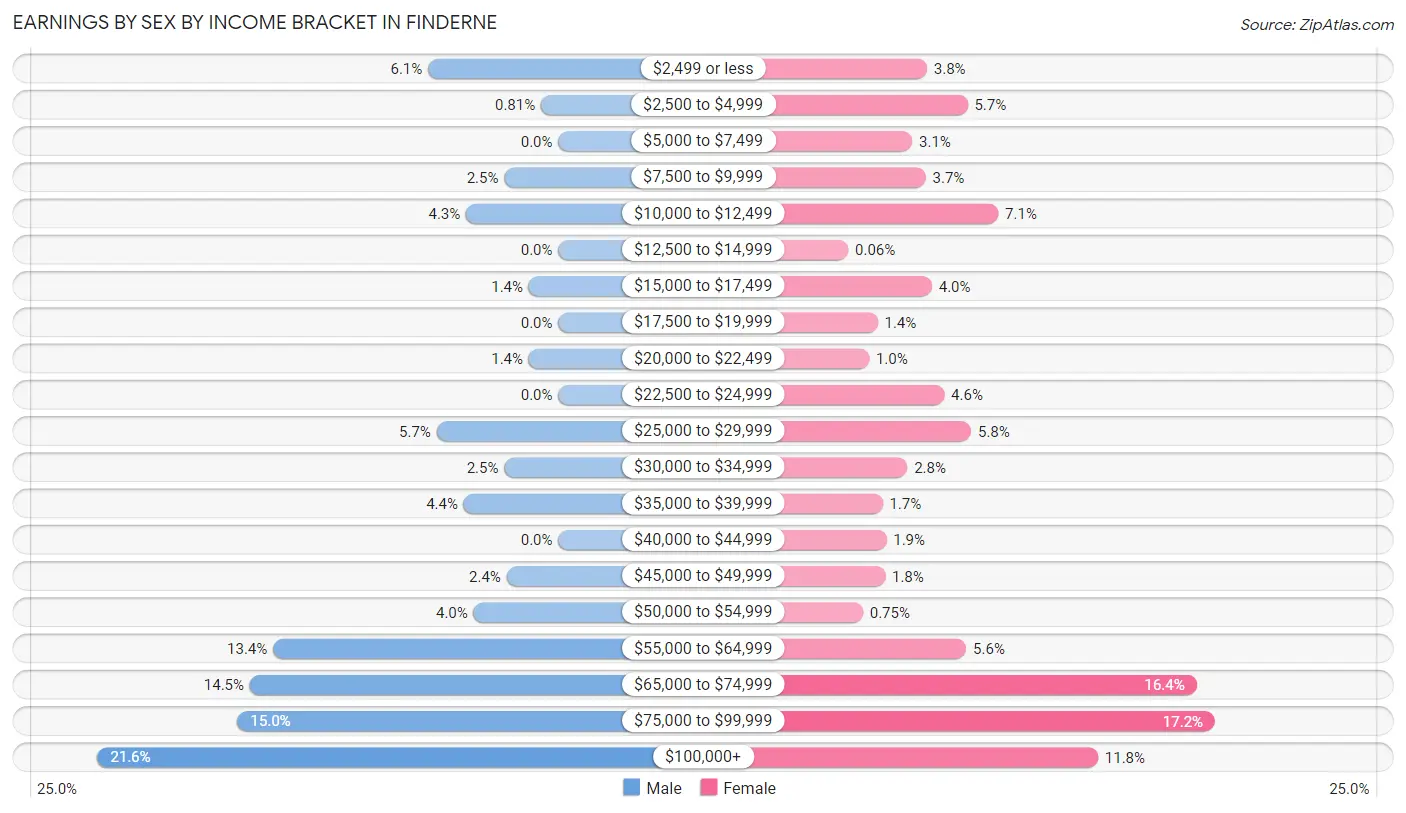
Earnings by Sex by Income Bracket in Finderne
The most common earnings brackets in Finderne are $100,000+ for men (375 | 21.6%) and $75,000 to $99,999 for women (299 | 17.2%).
| Income | Male | Female |
| $2,499 or less | 106 (6.1%) | 65 (3.7%) |
| $2,500 to $4,999 | 14 (0.8%) | 98 (5.7%) |
| $5,000 to $7,499 | 0 (0.0%) | 53 (3.1%) |
| $7,500 to $9,999 | 44 (2.5%) | 64 (3.7%) |
| $10,000 to $12,499 | 75 (4.3%) | 123 (7.1%) |
| $12,500 to $14,999 | 0 (0.0%) | 1 (0.1%) |
| $15,000 to $17,499 | 24 (1.4%) | 69 (4.0%) |
| $17,500 to $19,999 | 0 (0.0%) | 25 (1.4%) |
| $20,000 to $22,499 | 24 (1.4%) | 18 (1.0%) |
| $22,500 to $24,999 | 0 (0.0%) | 79 (4.6%) |
| $25,000 to $29,999 | 99 (5.7%) | 101 (5.8%) |
| $30,000 to $34,999 | 44 (2.5%) | 49 (2.8%) |
| $35,000 to $39,999 | 77 (4.4%) | 29 (1.7%) |
| $40,000 to $44,999 | 0 (0.0%) | 32 (1.8%) |
| $45,000 to $49,999 | 42 (2.4%) | 31 (1.8%) |
| $50,000 to $54,999 | 69 (4.0%) | 13 (0.7%) |
| $55,000 to $64,999 | 232 (13.4%) | 97 (5.6%) |
| $65,000 to $74,999 | 251 (14.4%) | 284 (16.4%) |
| $75,000 to $99,999 | 261 (15.0%) | 299 (17.2%) |
| $100,000+ | 375 (21.6%) | 204 (11.8%) |
| Total | 1,737 (100.0%) | 1,734 (100.0%) |
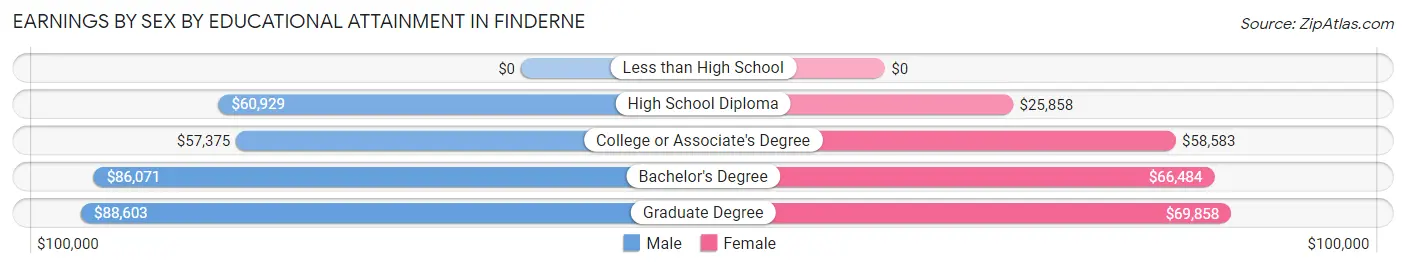
Earnings by Sex by Educational Attainment in Finderne
Average earnings in Finderne are $67,853 for men and $65,371 for women, a difference of 3.7%. Men with an educational attainment of graduate degree enjoy the highest average annual earnings of $88,603, while those with college or associate's degree education earn the least with $57,375. Women with an educational attainment of graduate degree earn the most with the average annual earnings of $69,858, while those with high school diploma education have the smallest earnings of $25,858.
| Educational Attainment | Male Income | Female Income |
| Less than High School | - | - |
| High School Diploma | $60,929 | $25,858 |
| College or Associate's Degree | $57,375 | $58,583 |
| Bachelor's Degree | $86,071 | $66,484 |
| Graduate Degree | $88,603 | $69,858 |
| Total | $67,853 | $65,371 |
Family Income in Finderne
Family Income Brackets in Finderne
According to the Finderne family income data, there are 329 families falling into the $75,000 to $99,999 income range, which is the most common income bracket and makes up 23.1% of all families.
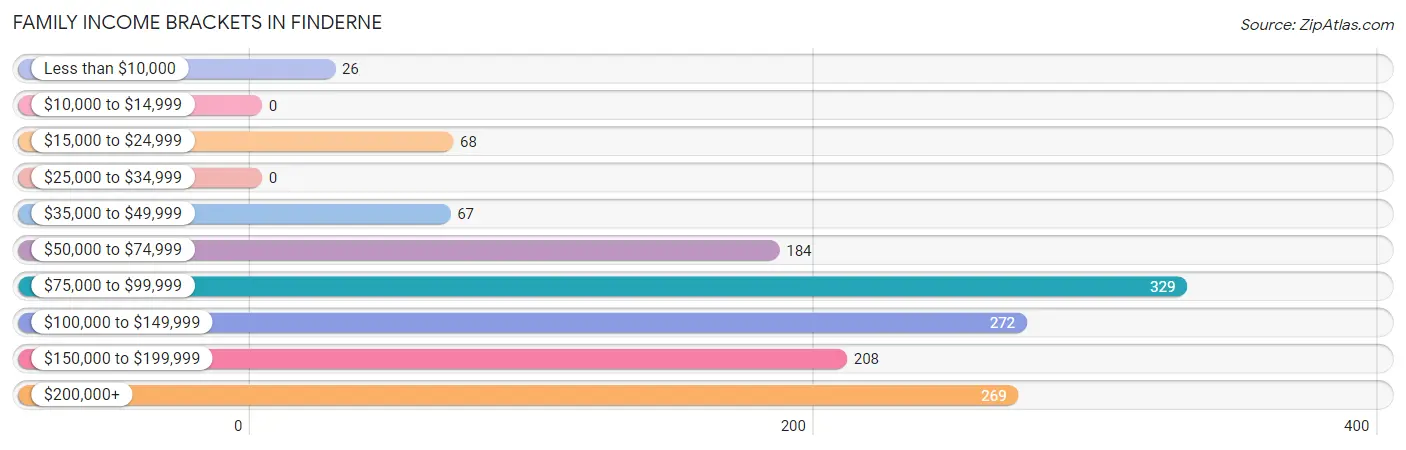
| Income Bracket | # Families | % Families |
| Less than $10,000 | 26 | 1.8% |
| $10,000 to $14,999 | 0 | 0.0% |
| $15,000 to $24,999 | 68 | 4.8% |
| $25,000 to $34,999 | 0 | 0.0% |
| $35,000 to $49,999 | 67 | 4.7% |
| $50,000 to $74,999 | 184 | 12.9% |
| $75,000 to $99,999 | 329 | 23.1% |
| $100,000 to $149,999 | 272 | 19.1% |
| $150,000 to $199,999 | 208 | 14.6% |
| $200,000+ | 269 | 18.9% |
Family Income by Famaliy Size in Finderne
4-person families (166 | 11.7%) account for the highest median family income in Finderne with $122,031 per family, while 2-person families (611 | 42.9%) have the highest median income of $45,759 per family member.
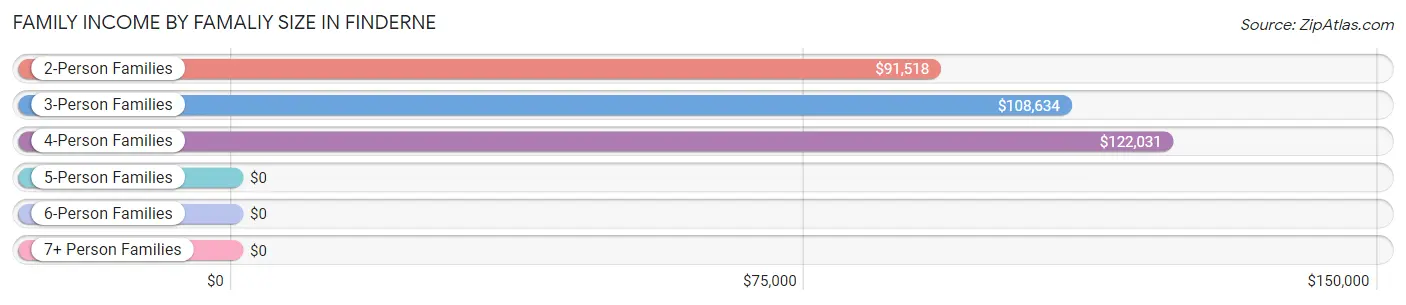
| Income Bracket | # Families | Median Income |
| 2-Person Families | 611 (42.9%) | $91,518 |
| 3-Person Families | 481 (33.8%) | $108,634 |
| 4-Person Families | 166 (11.7%) | $122,031 |
| 5-Person Families | 122 (8.6%) | $0 |
| 6-Person Families | 20 (1.4%) | $0 |
| 7+ Person Families | 23 (1.6%) | $0 |
| Total | 1,423 (100.0%) | $101,838 |
Family Income by Number of Earners in Finderne
The median family income in Finderne is $101,838, with families comprising 3+ earners (285) having the highest median family income of $163,194, while families with no earners (173) have the lowest median family income of $78,536, accounting for 20.0% and 12.2% of families, respectively.
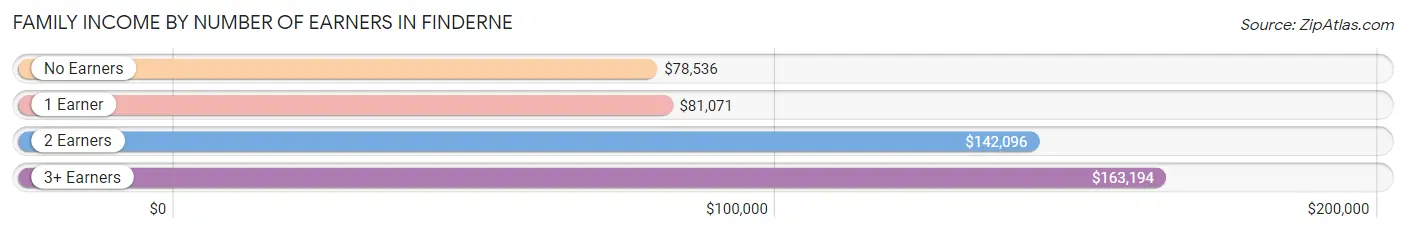
| Number of Earners | # Families | Median Income |
| No Earners | 173 (12.2%) | $78,536 |
| 1 Earner | 410 (28.8%) | $81,071 |
| 2 Earners | 555 (39.0%) | $142,096 |
| 3+ Earners | 285 (20.0%) | $163,194 |
| Total | 1,423 (100.0%) | $101,838 |
Household Income in Finderne
Household Income Brackets in Finderne
With 591 households falling in the category, the $100,000 to $149,999 income range is the most frequent in Finderne, accounting for 24.8% of all households. In contrast, only 45 households (1.9%) fall into the less than $10,000 income bracket, making it the least populous group.
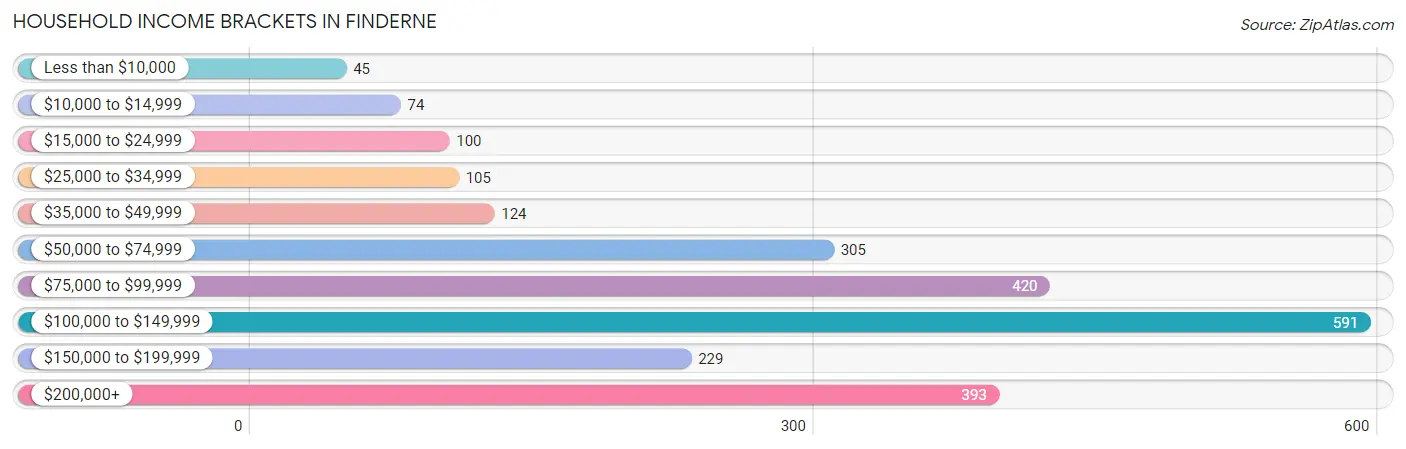
| Income Bracket | # Households | % Households |
| Less than $10,000 | 45 | 1.9% |
| $10,000 to $14,999 | 74 | 3.1% |
| $15,000 to $24,999 | 100 | 4.2% |
| $25,000 to $34,999 | 105 | 4.4% |
| $35,000 to $49,999 | 124 | 5.2% |
| $50,000 to $74,999 | 305 | 12.8% |
| $75,000 to $99,999 | 420 | 17.6% |
| $100,000 to $149,999 | 591 | 24.8% |
| $150,000 to $199,999 | 229 | 9.6% |
| $200,000+ | 393 | 16.5% |
Household Income by Householder Age in Finderne
The median household income in Finderne is $101,029, with the highest median household income of $123,846 found in the 45 to 64 years age bracket for the primary householder. A total of 1,014 households (42.5%) fall into this category. Meanwhile, the 15 to 24 years age bracket for the primary householder has the lowest median household income of $0, with 23 households (1.0%) in this group.
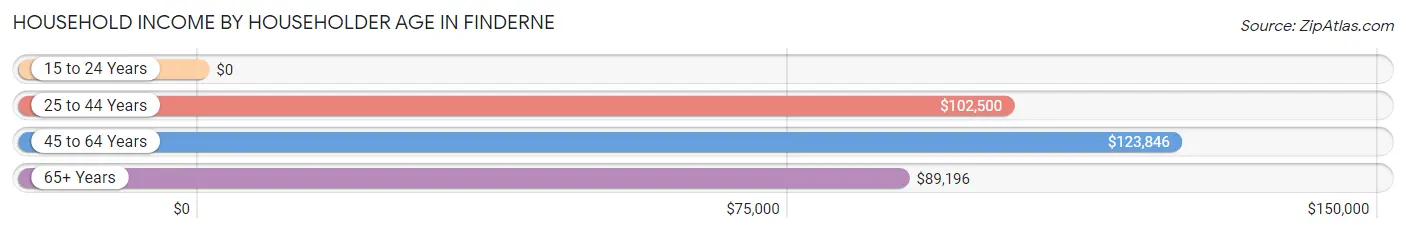
| Income Bracket | # Households | Median Income |
| 15 to 24 Years | 23 (1.0%) | $0 |
| 25 to 44 Years | 694 (29.1%) | $102,500 |
| 45 to 64 Years | 1,014 (42.5%) | $123,846 |
| 65+ Years | 653 (27.4%) | $89,196 |
| Total | 2,384 (100.0%) | $101,029 |
Poverty in Finderne
Income Below Poverty by Sex and Age in Finderne
With 6.2% poverty level for males and 7.8% for females among the residents of Finderne, 35 to 44 year old males and 16 and 17 year old females are the most vulnerable to poverty, with 104 males (22.3%) and 23 females (65.7%) in their respective age groups living below the poverty level.
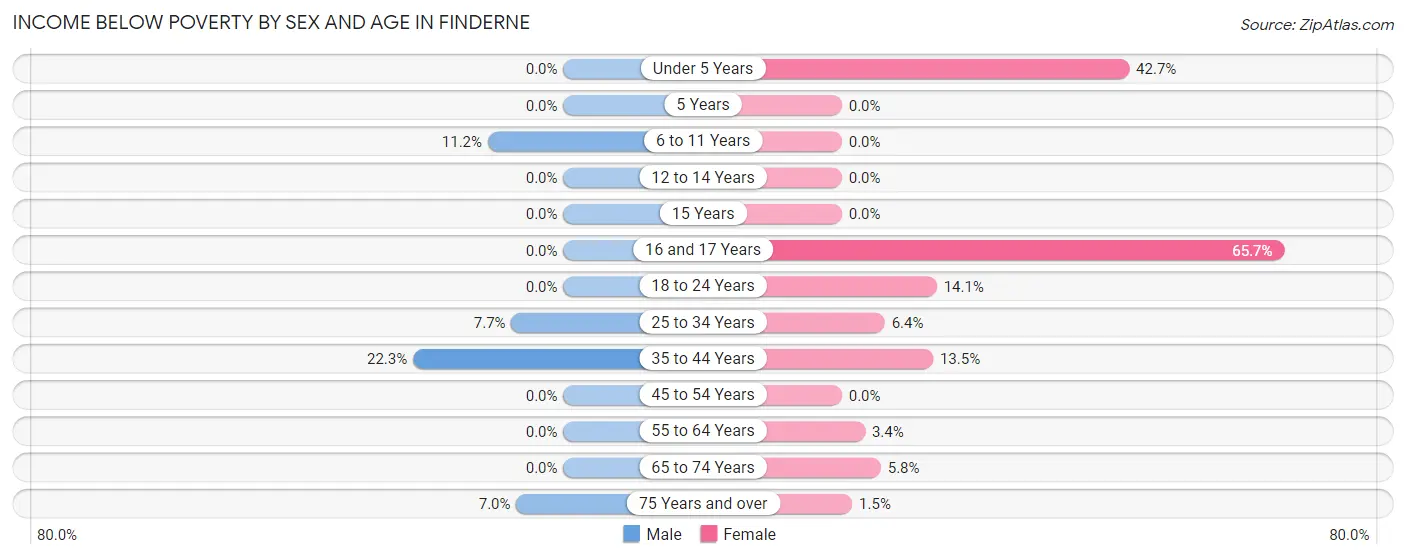
| Age Bracket | Male | Female |
| Under 5 Years | 0 (0.0%) | 32 (42.7%) |
| 5 Years | 0 (0.0%) | 0 (0.0%) |
| 6 to 11 Years | 26 (11.2%) | 0 (0.0%) |
| 12 to 14 Years | 0 (0.0%) | 0 (0.0%) |
| 15 Years | 0 (0.0%) | 0 (0.0%) |
| 16 and 17 Years | 0 (0.0%) | 23 (65.7%) |
| 18 to 24 Years | 0 (0.0%) | 41 (14.1%) |
| 25 to 34 Years | 27 (7.7%) | 20 (6.4%) |
| 35 to 44 Years | 104 (22.3%) | 75 (13.5%) |
| 45 to 54 Years | 0 (0.0%) | 0 (0.0%) |
| 55 to 64 Years | 0 (0.0%) | 12 (3.4%) |
| 65 to 74 Years | 0 (0.0%) | 22 (5.8%) |
| 75 Years and over | 18 (7.0%) | 5 (1.5%) |
| Total | 175 (6.2%) | 230 (7.8%) |
Income Above Poverty by Sex and Age in Finderne
According to the poverty statistics in Finderne, males aged under 5 years and females aged 5 years are the age groups that are most secure financially, with 100.0% of males and 100.0% of females in these age groups living above the poverty line.
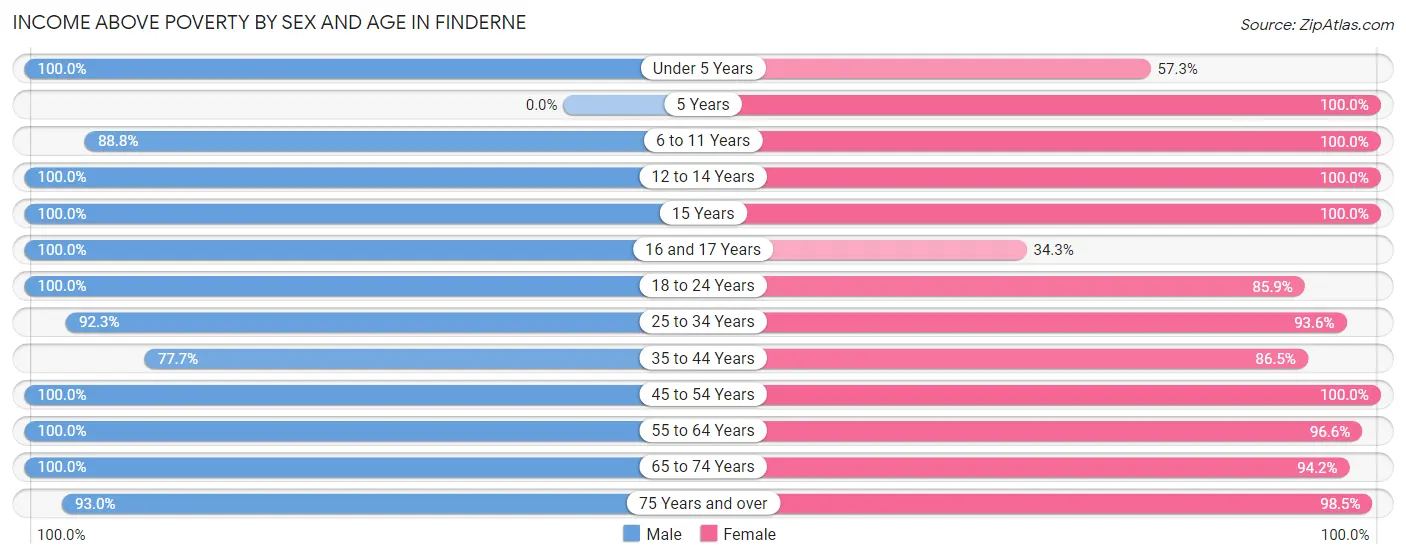
| Age Bracket | Male | Female |
| Under 5 Years | 99 (100.0%) | 43 (57.3%) |
| 5 Years | 0 (0.0%) | 24 (100.0%) |
| 6 to 11 Years | 206 (88.8%) | 138 (100.0%) |
| 12 to 14 Years | 16 (100.0%) | 75 (100.0%) |
| 15 Years | 14 (100.0%) | 40 (100.0%) |
| 16 and 17 Years | 84 (100.0%) | 12 (34.3%) |
| 18 to 24 Years | 257 (100.0%) | 250 (85.9%) |
| 25 to 34 Years | 323 (92.3%) | 294 (93.6%) |
| 35 to 44 Years | 362 (77.7%) | 479 (86.5%) |
| 45 to 54 Years | 625 (100.0%) | 347 (100.0%) |
| 55 to 64 Years | 253 (100.0%) | 337 (96.6%) |
| 65 to 74 Years | 149 (100.0%) | 358 (94.2%) |
| 75 Years and over | 240 (93.0%) | 319 (98.5%) |
| Total | 2,628 (93.8%) | 2,716 (92.2%) |
Income Below Poverty Among Married-Couple Families in Finderne
The poverty statistics for married-couple families in Finderne show that 6.6% or 69 of the total 1,042 families live below the poverty line. Families with no children have the highest poverty rate of 9.8%, comprising of 69 families. On the other hand, families with 1 or 2 children have the lowest poverty rate of 0.0%, which includes 0 families.
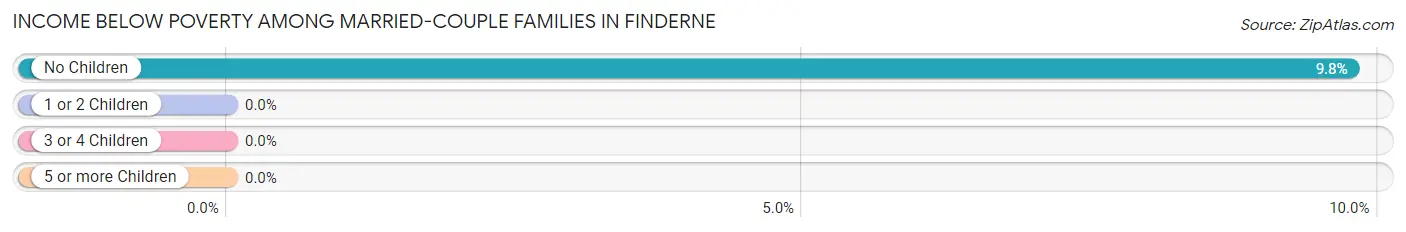
| Children | Above Poverty | Below Poverty |
| No Children | 638 (90.2%) | 69 (9.8%) |
| 1 or 2 Children | 312 (100.0%) | 0 (0.0%) |
| 3 or 4 Children | 0 (0.0%) | 0 (0.0%) |
| 5 or more Children | 23 (100.0%) | 0 (0.0%) |
| Total | 973 (93.4%) | 69 (6.6%) |
Income Below Poverty Among Single-Parent Households in Finderne
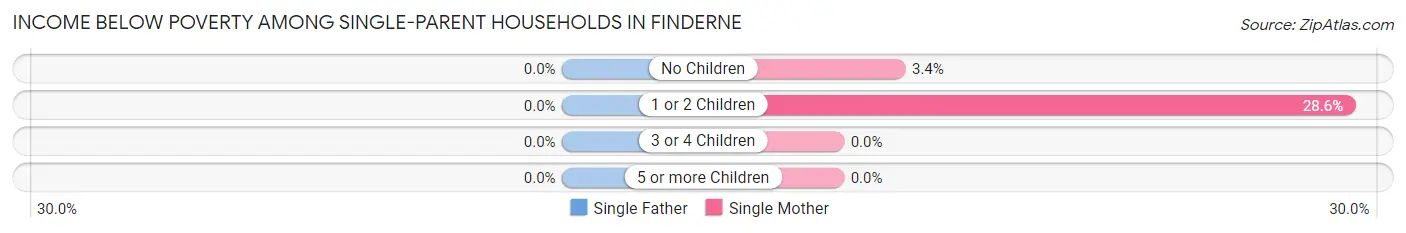
| Children | Single Father | Single Mother |
| No Children | 0 (0.0%) | 6 (3.4%) |
| 1 or 2 Children | 0 (0.0%) | 20 (28.6%) |
| 3 or 4 Children | 0 (0.0%) | 0 (0.0%) |
| 5 or more Children | 0 (0.0%) | 0 (0.0%) |
| Total | 0 (0.0%) | 26 (10.6%) |
Income Below Poverty Among Married-Couple vs Single-Parent Households in Finderne
The poverty data for Finderne shows that 69 of the married-couple family households (6.6%) and 26 of the single-parent households (6.8%) are living below the poverty level. Within the married-couple family households, those with no children have the highest poverty rate, with 69 households (9.8%) falling below the poverty line. Among the single-parent households, those with 1 or 2 children have the highest poverty rate, with 20 household (17.2%) living below poverty.
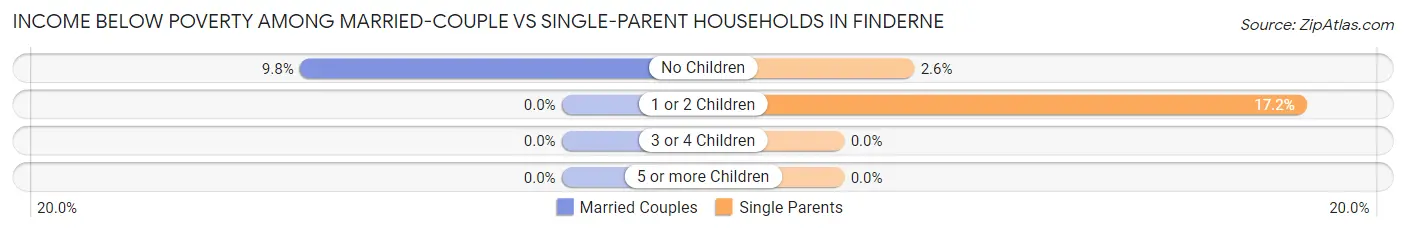
| Children | Married-Couple Families | Single-Parent Households |
| No Children | 69 (9.8%) | 6 (2.6%) |
| 1 or 2 Children | 0 (0.0%) | 20 (17.2%) |
| 3 or 4 Children | 0 (0.0%) | 0 (0.0%) |
| 5 or more Children | 0 (0.0%) | 0 (0.0%) |
| Total | 69 (6.6%) | 26 (6.8%) |
Race in Finderne
The most populous races in Finderne are White / Caucasian (3,064 | 52.1%), Hispanic or Latino (1,680 | 28.6%), and Asian (1,079 | 18.3%).
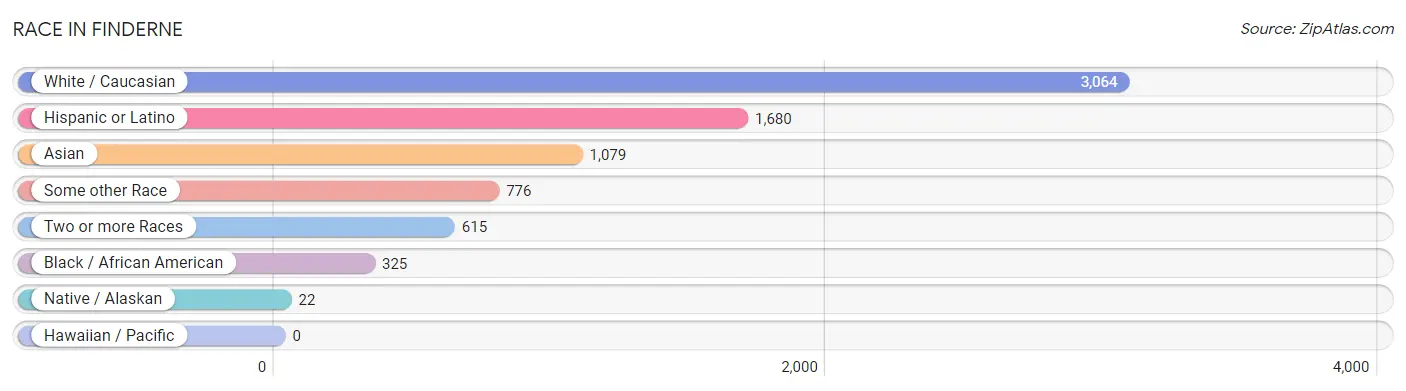
| Race | # Population | % Population |
| Asian | 1,079 | 18.3% |
| Black / African American | 325 | 5.5% |
| Hawaiian / Pacific | 0 | 0.0% |
| Hispanic or Latino | 1,680 | 28.6% |
| Native / Alaskan | 22 | 0.4% |
| White / Caucasian | 3,064 | 52.1% |
| Two or more Races | 615 | 10.5% |
| Some other Race | 776 | 13.2% |
| Total | 5,881 | 100.0% |
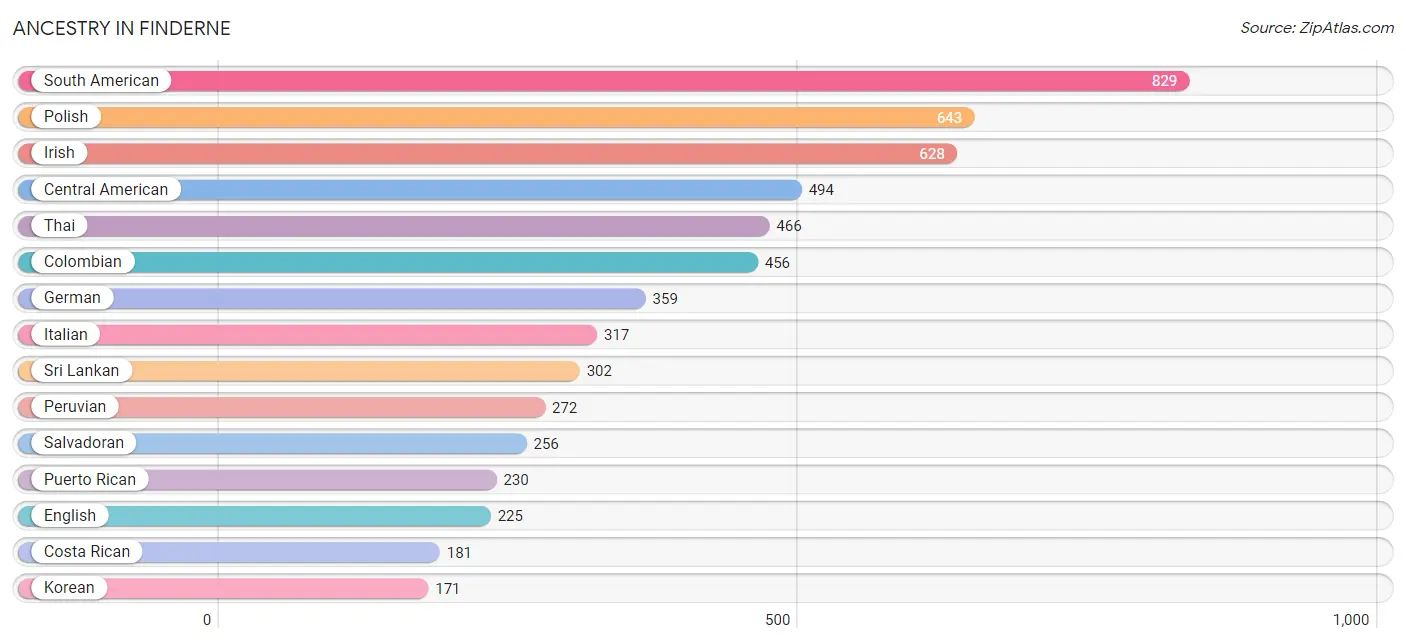
Ancestry in Finderne
The most populous ancestries reported in Finderne are South American (829 | 14.1%), Polish (643 | 10.9%), Irish (628 | 10.7%), Central American (494 | 8.4%), and Thai (466 | 7.9%), together accounting for 52.0% of all Finderne residents.
| Ancestry | # Population | % Population |
| American | 11 | 0.2% |
| Arab | 16 | 0.3% |
| Armenian | 21 | 0.4% |
| Austrian | 19 | 0.3% |
| Bhutanese | 29 | 0.5% |
| British | 111 | 1.9% |
| Central American | 494 | 8.4% |
| Central American Indian | 22 | 0.4% |
| Colombian | 456 | 7.7% |
| Costa Rican | 181 | 3.1% |
| Czech | 15 | 0.3% |
| Czechoslovakian | 27 | 0.5% |
| Dominican | 22 | 0.4% |
| Dutch | 46 | 0.8% |
| Ecuadorian | 33 | 0.6% |
| Egyptian | 16 | 0.3% |
| English | 225 | 3.8% |
| Estonian | 18 | 0.3% |
| European | 52 | 0.9% |
| French | 97 | 1.7% |
| German | 359 | 6.1% |
| Greek | 24 | 0.4% |
| Guyanese | 119 | 2.0% |
| Haitian | 121 | 2.1% |
| Honduran | 44 | 0.7% |
| Hungarian | 62 | 1.1% |
| Indian (Asian) | 157 | 2.7% |
| Irish | 628 | 10.7% |
| Italian | 317 | 5.4% |
| Korean | 171 | 2.9% |
| Mexican | 105 | 1.8% |
| Norwegian | 48 | 0.8% |
| Panamanian | 13 | 0.2% |
| Pennsylvania German | 18 | 0.3% |
| Peruvian | 272 | 4.6% |
| Polish | 643 | 10.9% |
| Portuguese | 99 | 1.7% |
| Puerto Rican | 230 | 3.9% |
| Romanian | 26 | 0.4% |
| Russian | 15 | 0.3% |
| Salvadoran | 256 | 4.3% |
| Scottish | 101 | 1.7% |
| South American | 829 | 14.1% |
| Sri Lankan | 302 | 5.1% |
| Swedish | 24 | 0.4% |
| Swiss | 17 | 0.3% |
| Thai | 466 | 7.9% |
| Venezuelan | 68 | 1.2% | View All 48 Rows |
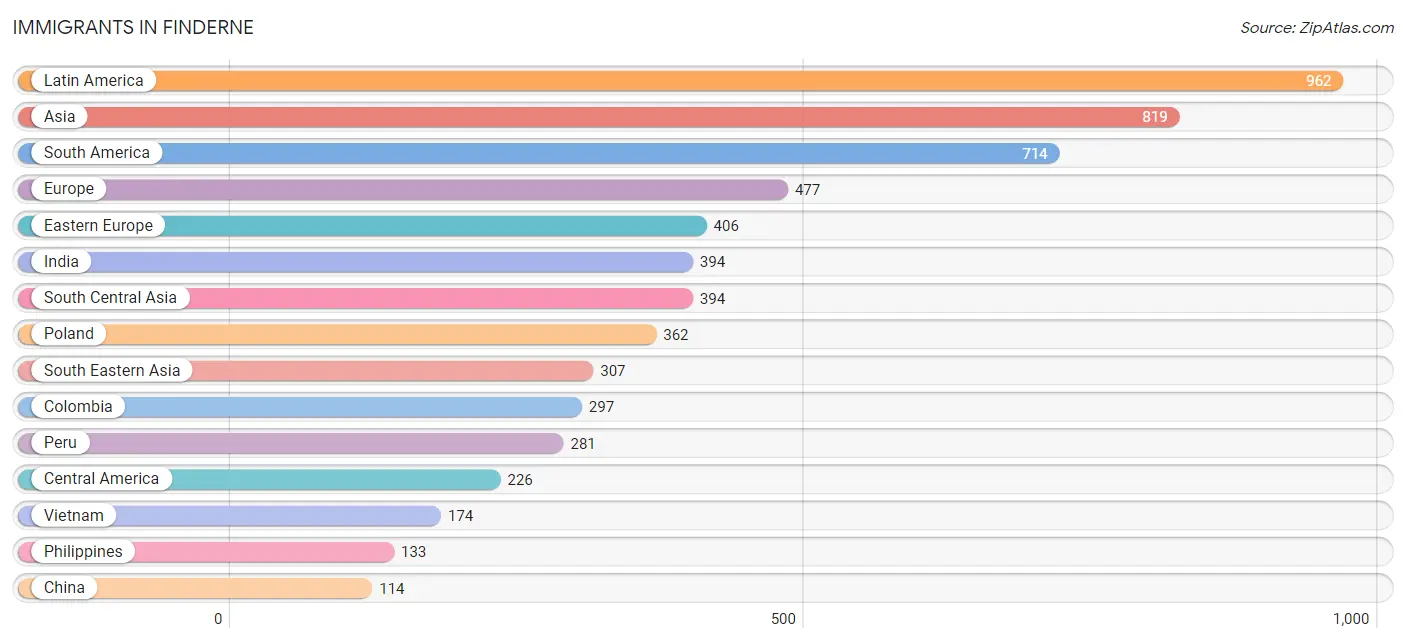
Immigrants in Finderne
The most numerous immigrant groups reported in Finderne came from Latin America (962 | 16.4%), Asia (819 | 13.9%), South America (714 | 12.1%), Europe (477 | 8.1%), and Eastern Europe (406 | 6.9%), together accounting for 57.4% of all Finderne residents.
| Immigration Origin | # Population | % Population |
| Africa | 16 | 0.3% |
| Armenia | 4 | 0.1% |
| Asia | 819 | 13.9% |
| Caribbean | 22 | 0.4% |
| Central America | 226 | 3.8% |
| China | 114 | 1.9% |
| Colombia | 297 | 5.1% |
| Costa Rica | 61 | 1.0% |
| Dominican Republic | 22 | 0.4% |
| Eastern Asia | 114 | 1.9% |
| Eastern Europe | 406 | 6.9% |
| Ecuador | 33 | 0.6% |
| Egypt | 16 | 0.3% |
| El Salvador | 48 | 0.8% |
| Europe | 477 | 8.1% |
| Germany | 5 | 0.1% |
| Guyana | 35 | 0.6% |
| Honduras | 44 | 0.7% |
| India | 394 | 6.7% |
| Latin America | 962 | 16.4% |
| Mexico | 60 | 1.0% |
| Northern Africa | 16 | 0.3% |
| Northern Europe | 24 | 0.4% |
| Panama | 13 | 0.2% |
| Peru | 281 | 4.8% |
| Philippines | 133 | 2.3% |
| Poland | 362 | 6.2% |
| Portugal | 42 | 0.7% |
| Romania | 26 | 0.4% |
| Scotland | 2 | 0.0% |
| South America | 714 | 12.1% |
| South Central Asia | 394 | 6.7% |
| South Eastern Asia | 307 | 5.2% |
| Southern Europe | 42 | 0.7% |
| Venezuela | 68 | 1.2% |
| Vietnam | 174 | 3.0% |
| Western Asia | 4 | 0.1% |
| Western Europe | 5 | 0.1% | View All 38 Rows |
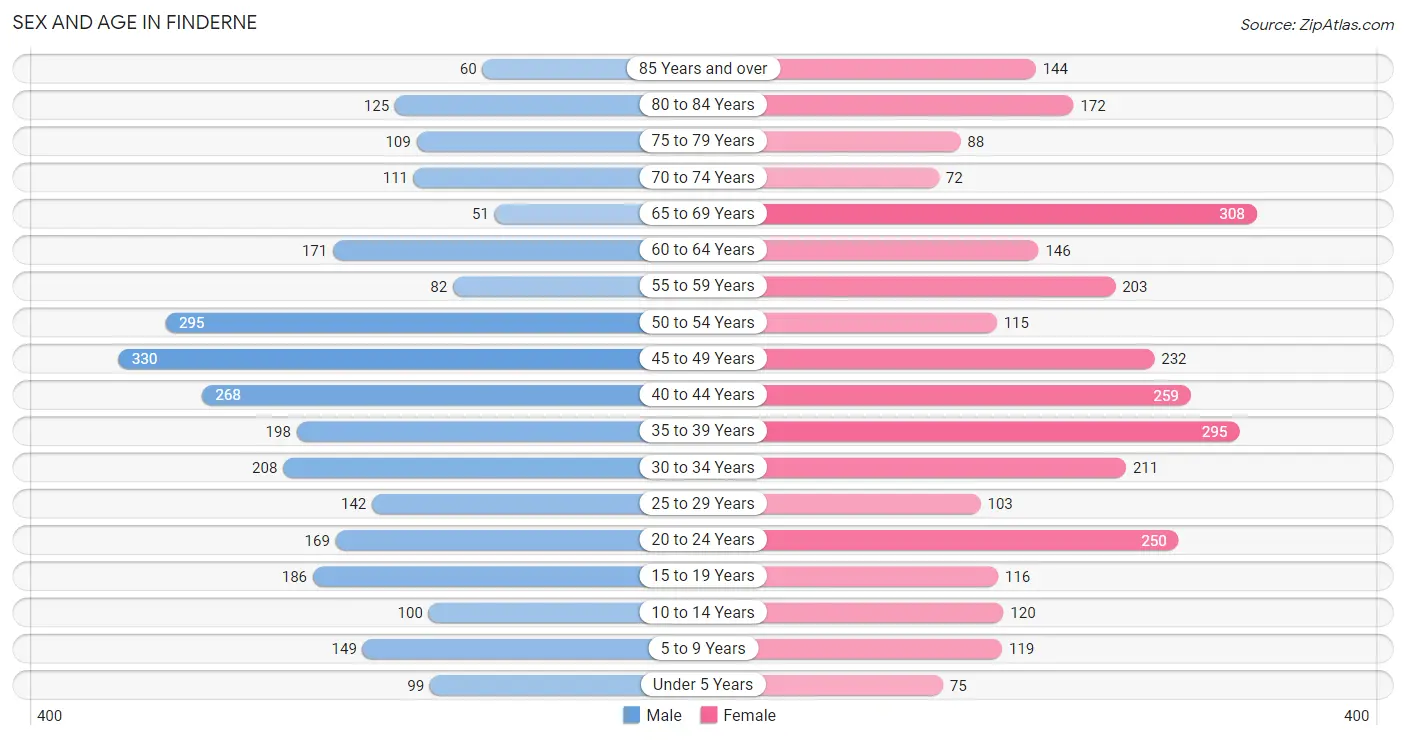
Sex and Age in Finderne
Sex and Age in Finderne
The most populous age groups in Finderne are 45 to 49 Years (330 | 11.6%) for men and 65 to 69 Years (308 | 10.2%) for women.
| Age Bracket | Male | Female |
| Under 5 Years | 99 (3.5%) | 75 (2.5%) |
| 5 to 9 Years | 149 (5.2%) | 119 (3.9%) |
| 10 to 14 Years | 100 (3.5%) | 120 (4.0%) |
| 15 to 19 Years | 186 (6.5%) | 116 (3.8%) |
| 20 to 24 Years | 169 (5.9%) | 250 (8.3%) |
| 25 to 29 Years | 142 (5.0%) | 103 (3.4%) |
| 30 to 34 Years | 208 (7.3%) | 211 (7.0%) |
| 35 to 39 Years | 198 (6.9%) | 295 (9.7%) |
| 40 to 44 Years | 268 (9.4%) | 259 (8.6%) |
| 45 to 49 Years | 330 (11.6%) | 232 (7.7%) |
| 50 to 54 Years | 295 (10.3%) | 115 (3.8%) |
| 55 to 59 Years | 82 (2.9%) | 203 (6.7%) |
| 60 to 64 Years | 171 (6.0%) | 146 (4.8%) |
| 65 to 69 Years | 51 (1.8%) | 308 (10.2%) |
| 70 to 74 Years | 111 (3.9%) | 72 (2.4%) |
| 75 to 79 Years | 109 (3.8%) | 88 (2.9%) |
| 80 to 84 Years | 125 (4.4%) | 172 (5.7%) |
| 85 Years and over | 60 (2.1%) | 144 (4.8%) |
| Total | 2,853 (100.0%) | 3,028 (100.0%) |
Families and Households in Finderne
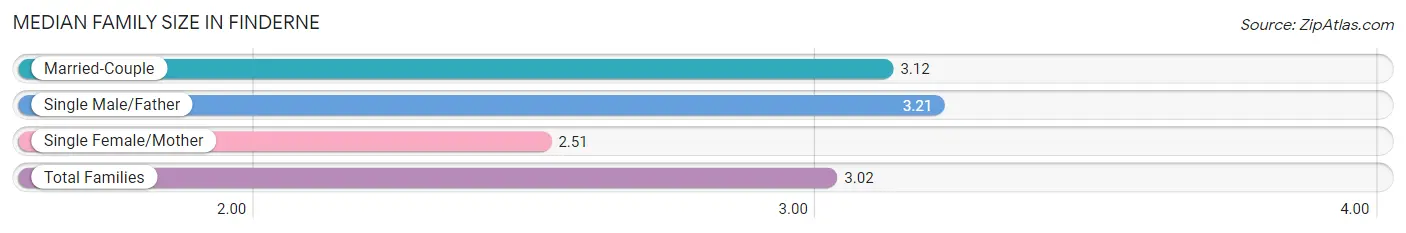
Median Family Size in Finderne
The median family size in Finderne is 3.02 persons per family, with single male/father families (136 | 9.6%) accounting for the largest median family size of 3.21 persons per family. On the other hand, single female/mother families (245 | 17.2%) represent the smallest median family size with 2.51 persons per family.
| Family Type | # Families | Family Size |
| Married-Couple | 1,042 (73.2%) | 3.12 |
| Single Male/Father | 136 (9.6%) | 3.21 |
| Single Female/Mother | 245 (17.2%) | 2.51 |
| Total Families | 1,423 (100.0%) | 3.02 |
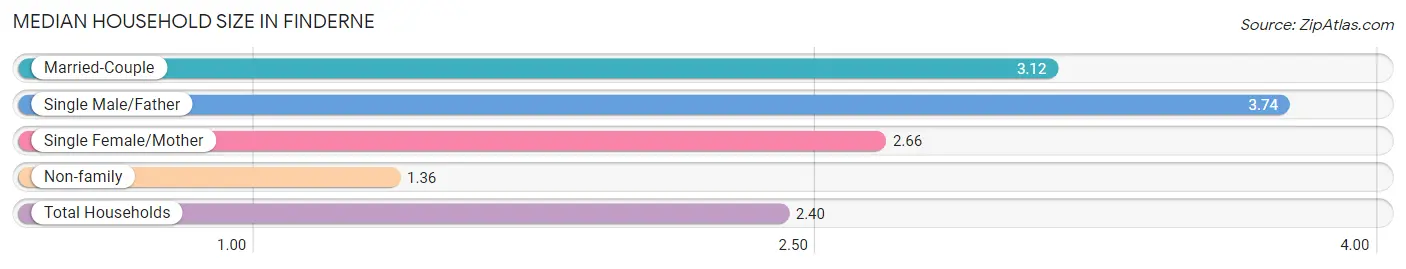
Median Household Size in Finderne
The median household size in Finderne is 2.40 persons per household, with single male/father households (136 | 5.7%) accounting for the largest median household size of 3.74 persons per household. non-family households (961 | 40.3%) represent the smallest median household size with 1.36 persons per household.
| Household Type | # Households | Household Size |
| Married-Couple | 1,042 (43.7%) | 3.12 |
| Single Male/Father | 136 (5.7%) | 3.74 |
| Single Female/Mother | 245 (10.3%) | 2.66 |
| Non-family | 961 (40.3%) | 1.36 |
| Total Households | 2,384 (100.0%) | 2.40 |
Household Size by Marriage Status in Finderne
Out of a total of 2,384 households in Finderne, 1,423 (59.7%) are family households, while 961 (40.3%) are nonfamily households. The most numerous type of family households are 2-person households, comprising 589, and the most common type of nonfamily households are 1-person households, comprising 649.
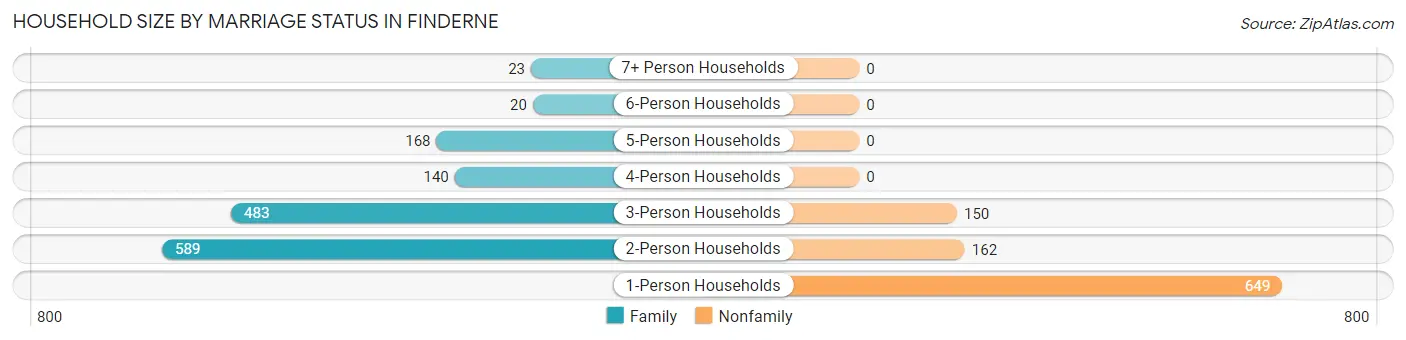
| Household Size | Family Households | Nonfamily Households |
| 1-Person Households | - | 649 (27.2%) |
| 2-Person Households | 589 (24.7%) | 162 (6.8%) |
| 3-Person Households | 483 (20.3%) | 150 (6.3%) |
| 4-Person Households | 140 (5.9%) | 0 (0.0%) |
| 5-Person Households | 168 (7.0%) | 0 (0.0%) |
| 6-Person Households | 20 (0.8%) | 0 (0.0%) |
| 7+ Person Households | 23 (1.0%) | 0 (0.0%) |
| Total | 1,423 (59.7%) | 961 (40.3%) |
Female Fertility in Finderne
Fertility by Age in Finderne
Average fertility rate in Finderne is 42.0 births per 1,000 women. Women in the age bracket of 20 to 34 years have the highest fertility rate with 78.0 births per 1,000 women. Women in the age bracket of 20 to 34 years acount for 68.8% of all women with births.
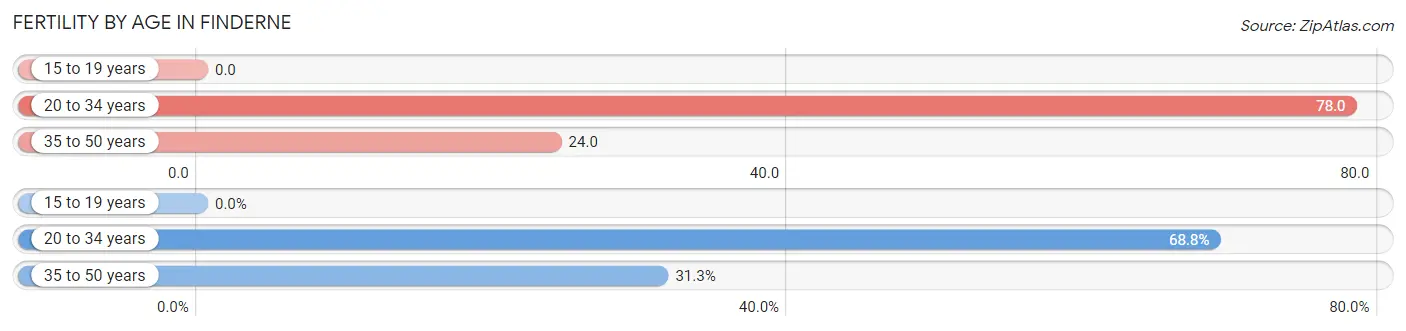
| Age Bracket | Women with Births | Births / 1,000 Women |
| 15 to 19 years | 0 (0.0%) | 0.0 |
| 20 to 34 years | 44 (68.8%) | 78.0 |
| 35 to 50 years | 20 (31.2%) | 24.0 |
| Total | 64 (100.0%) | 42.0 |
Fertility by Age by Marriage Status in Finderne
98.4% of women with births (64) in Finderne are married. The highest percentage of unmarried women with births falls into 35 to 50 years age bracket with 5.0% of them unmarried at the time of birth, while the lowest percentage of unmarried women with births belong to 20 to 34 years age bracket with 0.0% of them unmarried.
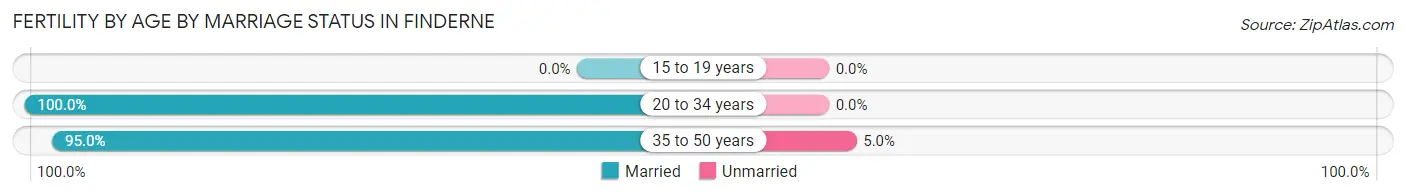
| Age Bracket | Married | Unmarried |
| 15 to 19 years | 0 (0.0%) | 0 (0.0%) |
| 20 to 34 years | 44 (100.0%) | 0 (0.0%) |
| 35 to 50 years | 19 (95.0%) | 1 (5.0%) |
| Total | 63 (98.4%) | 1 (1.6%) |
Fertility by Education in Finderne
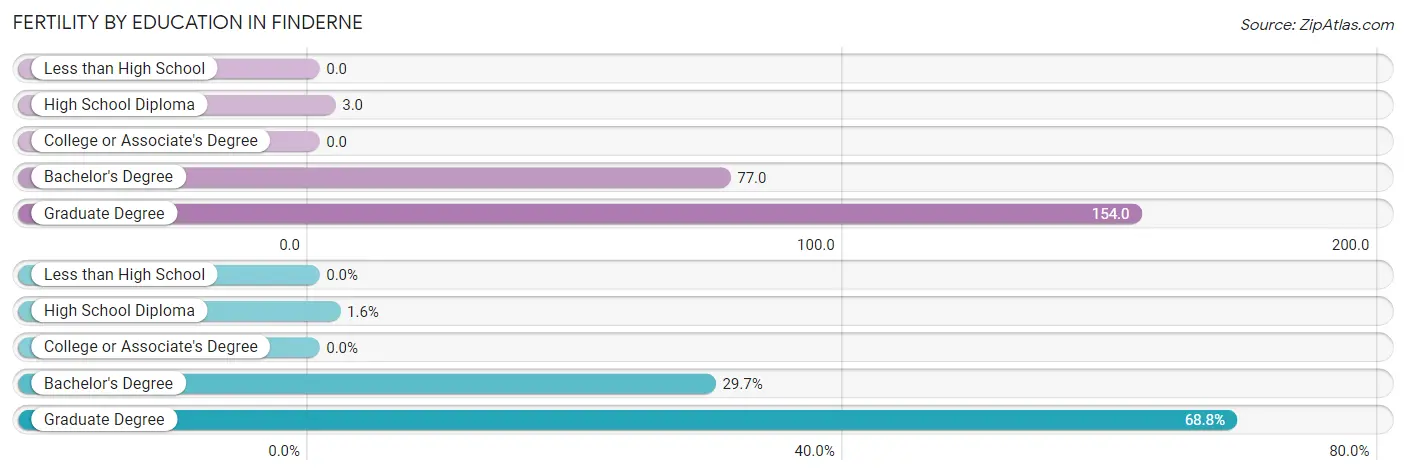
| Educational Attainment | Women with Births | Births / 1,000 Women |
| Less than High School | 0 (0.0%) | 0.0 |
| High School Diploma | 1 (1.6%) | 3.0 |
| College or Associate's Degree | 0 (0.0%) | 0.0 |
| Bachelor's Degree | 19 (29.7%) | 77.0 |
| Graduate Degree | 44 (68.8%) | 154.0 |
| Total | 64 (100.0%) | 42.0 |
Fertility by Education by Marriage Status in Finderne
1.6% of women with births in Finderne are unmarried. Women with the educational attainment of bachelor's degree are most likely to be married with 100.0% of them married at childbirth, while women with the educational attainment of high school diploma are least likely to be married with 100.0% of them unmarried at childbirth.
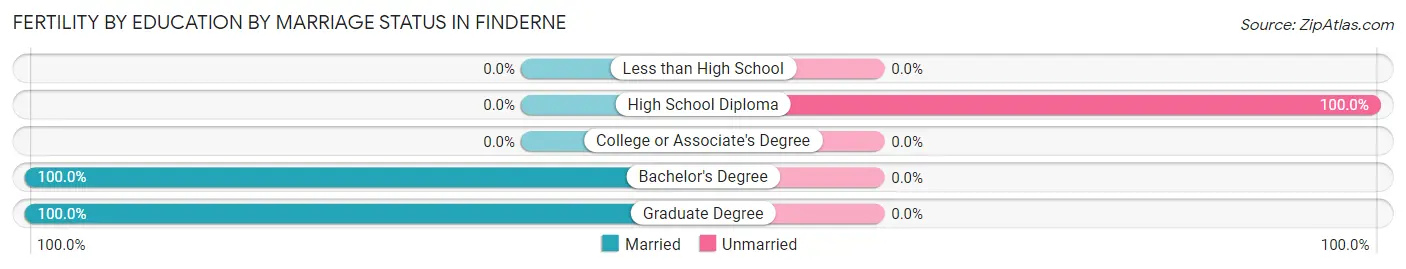
| Educational Attainment | Married | Unmarried |
| Less than High School | 0 (0.0%) | 0 (0.0%) |
| High School Diploma | 0 (0.0%) | 1 (100.0%) |
| College or Associate's Degree | 0 (0.0%) | 0 (0.0%) |
| Bachelor's Degree | 19 (100.0%) | 0 (0.0%) |
| Graduate Degree | 44 (100.0%) | 0 (0.0%) |
| Total | 63 (98.4%) | 1 (1.6%) |
Employment Characteristics in Finderne
Employment by Class of Employer in Finderne
Among the 2,959 employed individuals in Finderne, private company employees (2,286 | 77.3%), not-for-profit organizations (167 | 5.6%), and self-employed (not incorporated) (147 | 5.0%) make up the most common classes of employment.
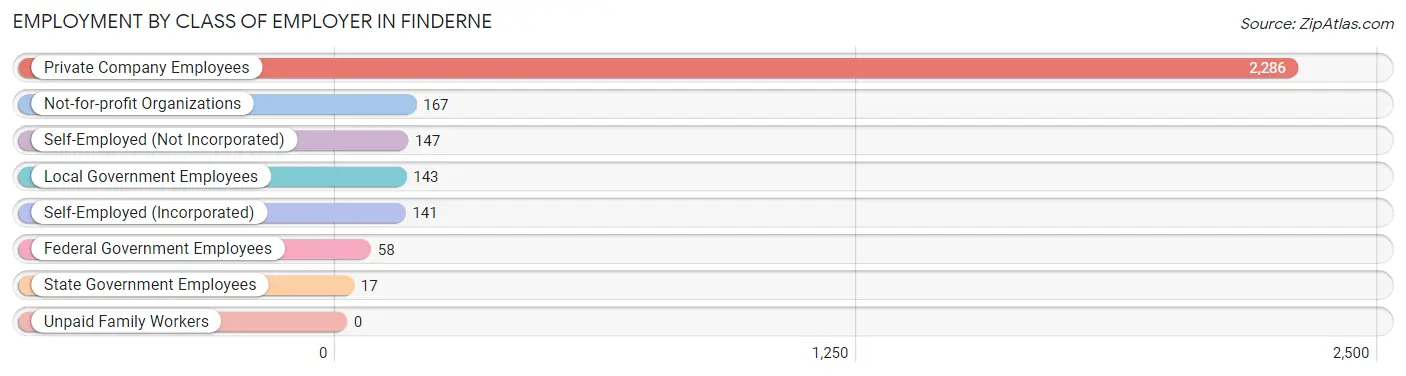
| Employer Class | # Employees | % Employees |
| Private Company Employees | 2,286 | 77.3% |
| Self-Employed (Incorporated) | 141 | 4.8% |
| Self-Employed (Not Incorporated) | 147 | 5.0% |
| Not-for-profit Organizations | 167 | 5.6% |
| Local Government Employees | 143 | 4.8% |
| State Government Employees | 17 | 0.6% |
| Federal Government Employees | 58 | 2.0% |
| Unpaid Family Workers | 0 | 0.0% |
| Total | 2,959 | 100.0% |
Employment Status by Age in Finderne
According to the labor force statistics for Finderne, out of the total population over 16 years of age (5,165), 63.1% or 3,259 individuals are in the labor force, with 5.0% or 163 of them unemployed. The age group with the highest labor force participation rate is 25 to 29 years, with 99.2% or 243 individuals in the labor force. Within the labor force, the 60 to 64 years age range has the highest percentage of unemployed individuals, with 25.6% or 67 of them being unemployed.
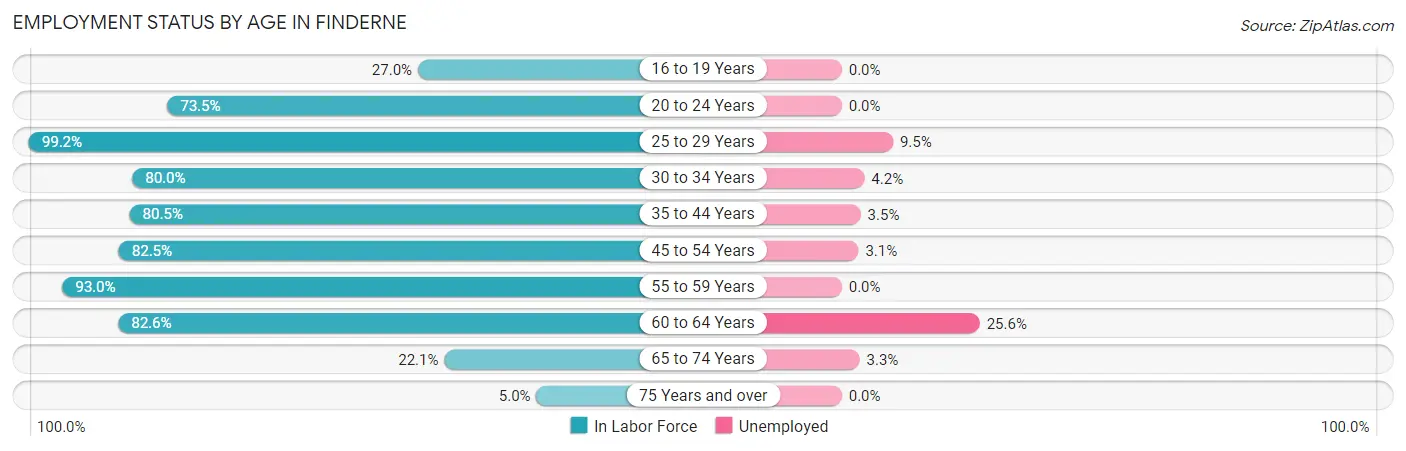
| Age Bracket | In Labor Force | Unemployed |
| 16 to 19 Years | 67 (27.0%) | 0 (0.0%) |
| 20 to 24 Years | 308 (73.5%) | 0 (0.0%) |
| 25 to 29 Years | 243 (99.2%) | 23 (9.5%) |
| 30 to 34 Years | 335 (80.0%) | 14 (4.2%) |
| 35 to 44 Years | 821 (80.5%) | 29 (3.5%) |
| 45 to 54 Years | 802 (82.5%) | 25 (3.1%) |
| 55 to 59 Years | 265 (93.0%) | 0 (0.0%) |
| 60 to 64 Years | 262 (82.6%) | 67 (25.6%) |
| 65 to 74 Years | 120 (22.1%) | 4 (3.3%) |
| 75 Years and over | 35 (5.0%) | 0 (0.0%) |
| Total | 3,259 (63.1%) | 163 (5.0%) |
Employment Status by Educational Attainment in Finderne
According to labor force statistics for Finderne, 83.7% of individuals (2,727) out of the total population between 25 and 64 years of age (3,258) are in the labor force, with 5.8% or 158 of them being unemployed. The group with the highest labor force participation rate are those with the educational attainment of high school diploma, with 88.4% or 754 individuals in the labor force. Within the labor force, individuals with less than high school education have the highest percentage of unemployment, with 23.6% or 29 of them being unemployed.
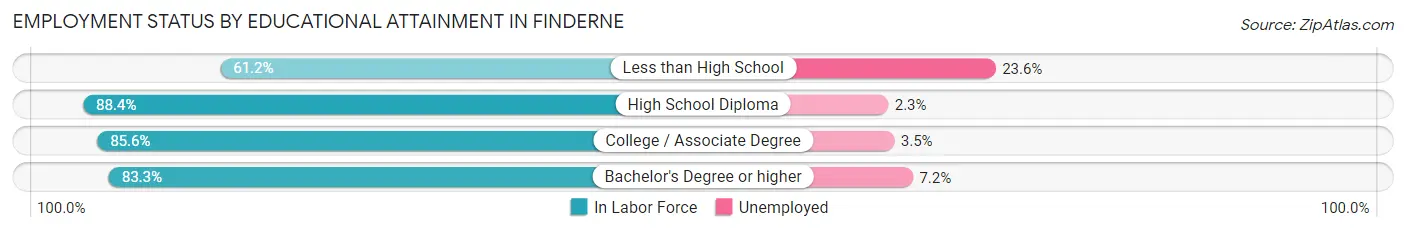
| Educational Attainment | In Labor Force | Unemployed |
| Less than High School | 123 (61.2%) | 47 (23.6%) |
| High School Diploma | 754 (88.4%) | 20 (2.3%) |
| College / Associate Degree | 566 (85.6%) | 23 (3.5%) |
| Bachelor's Degree or higher | 1,285 (83.3%) | 111 (7.2%) |
| Total | 2,727 (83.7%) | 189 (5.8%) |
Employment Occupations by Sex in Finderne
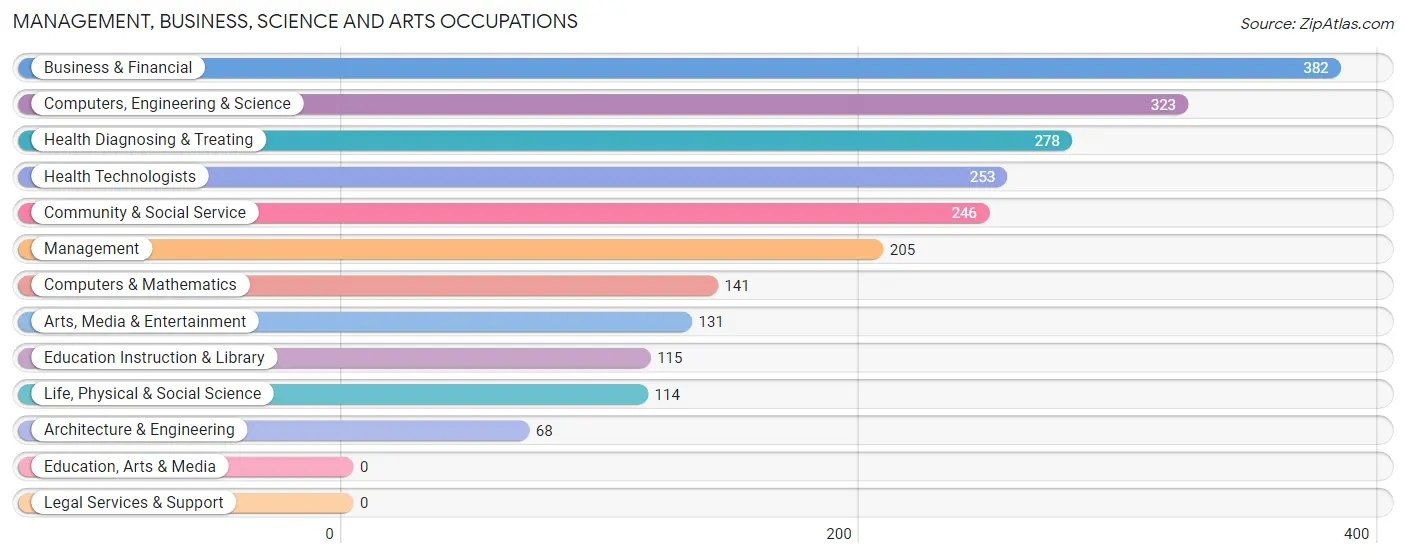
Management, Business, Science and Arts Occupations
The most common Management, Business, Science and Arts occupations in Finderne are Business & Financial (382 | 12.3%), Computers, Engineering & Science (323 | 10.4%), Health Diagnosing & Treating (278 | 9.0%), Health Technologists (253 | 8.2%), and Community & Social Service (246 | 8.0%).
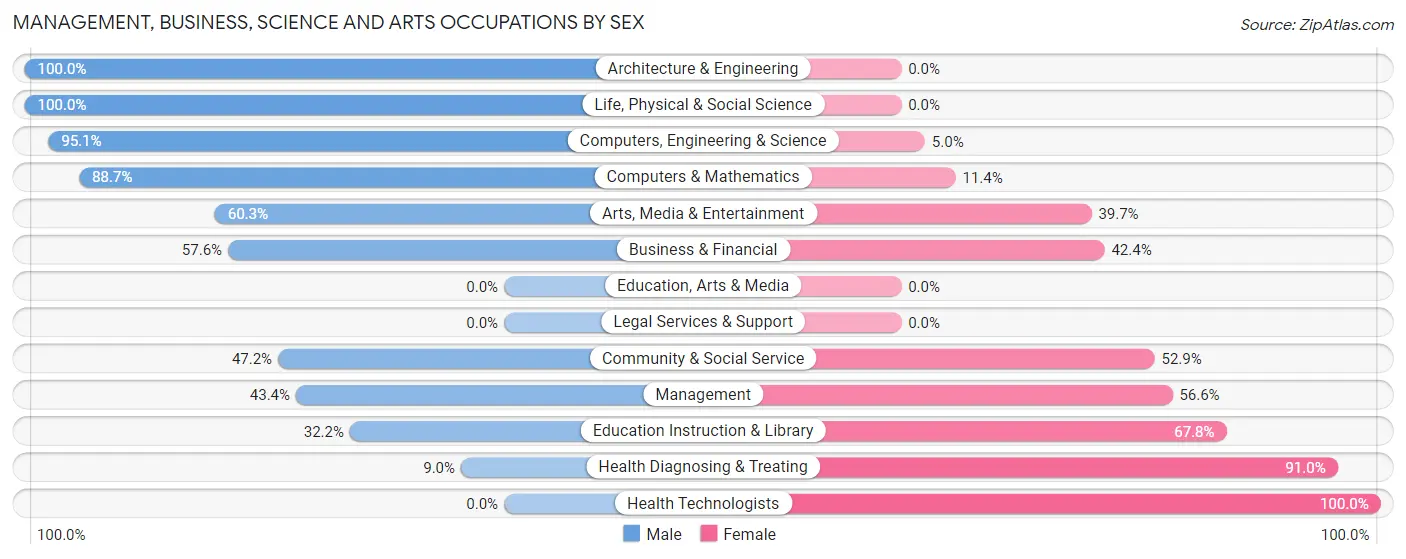
Management, Business, Science and Arts Occupations by Sex
Within the Management, Business, Science and Arts occupations in Finderne, the most male-oriented occupations are Architecture & Engineering (100.0%), Life, Physical & Social Science (100.0%), and Computers, Engineering & Science (95.1%), while the most female-oriented occupations are Health Technologists (100.0%), Health Diagnosing & Treating (91.0%), and Education Instruction & Library (67.8%).
| Occupation | Male | Female |
| Management | 89 (43.4%) | 116 (56.6%) |
| Business & Financial | 220 (57.6%) | 162 (42.4%) |
| Computers, Engineering & Science | 307 (95.1%) | 16 (5.0%) |
| Computers & Mathematics | 125 (88.6%) | 16 (11.4%) |
| Architecture & Engineering | 68 (100.0%) | 0 (0.0%) |
| Life, Physical & Social Science | 114 (100.0%) | 0 (0.0%) |
| Community & Social Service | 116 (47.1%) | 130 (52.8%) |
| Education, Arts & Media | 0 (0.0%) | 0 (0.0%) |
| Legal Services & Support | 0 (0.0%) | 0 (0.0%) |
| Education Instruction & Library | 37 (32.2%) | 78 (67.8%) |
| Arts, Media & Entertainment | 79 (60.3%) | 52 (39.7%) |
| Health Diagnosing & Treating | 25 (9.0%) | 253 (91.0%) |
| Health Technologists | 0 (0.0%) | 253 (100.0%) |
| Total (Category) | 757 (52.8%) | 677 (47.2%) |
| Total (Overall) | 1,535 (49.6%) | 1,561 (50.4%) |
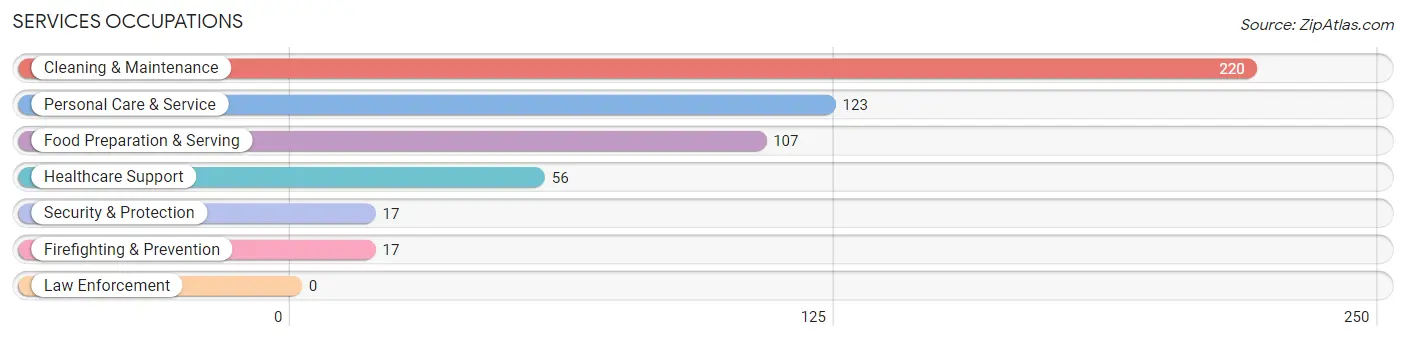
Services Occupations
The most common Services occupations in Finderne are Cleaning & Maintenance (220 | 7.1%), Personal Care & Service (123 | 4.0%), Food Preparation & Serving (107 | 3.5%), Healthcare Support (56 | 1.8%), and Security & Protection (17 | 0.5%).
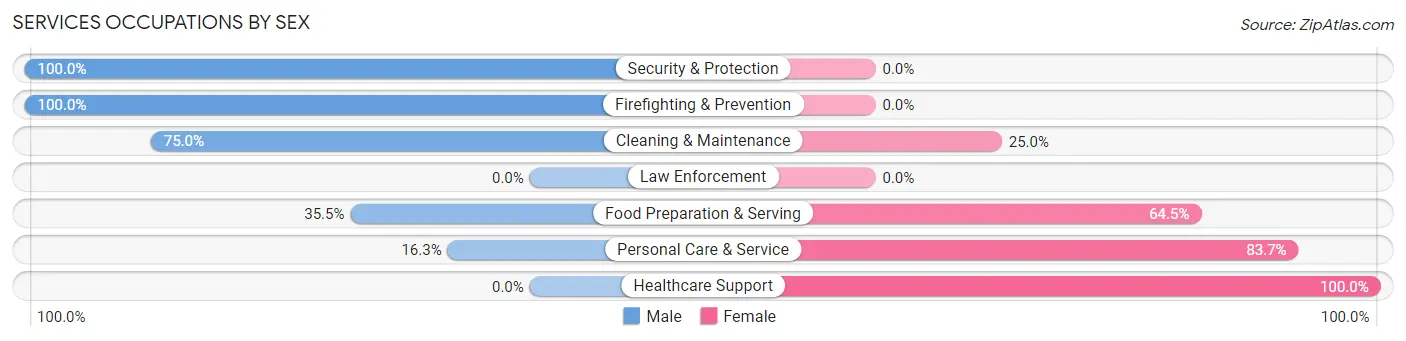
Services Occupations by Sex
Within the Services occupations in Finderne, the most male-oriented occupations are Security & Protection (100.0%), Firefighting & Prevention (100.0%), and Cleaning & Maintenance (75.0%), while the most female-oriented occupations are Healthcare Support (100.0%), Personal Care & Service (83.7%), and Food Preparation & Serving (64.5%).
| Occupation | Male | Female |
| Healthcare Support | 0 (0.0%) | 56 (100.0%) |
| Security & Protection | 17 (100.0%) | 0 (0.0%) |
| Firefighting & Prevention | 17 (100.0%) | 0 (0.0%) |
| Law Enforcement | 0 (0.0%) | 0 (0.0%) |
| Food Preparation & Serving | 38 (35.5%) | 69 (64.5%) |
| Cleaning & Maintenance | 165 (75.0%) | 55 (25.0%) |
| Personal Care & Service | 20 (16.3%) | 103 (83.7%) |
| Total (Category) | 240 (45.9%) | 283 (54.1%) |
| Total (Overall) | 1,535 (49.6%) | 1,561 (50.4%) |
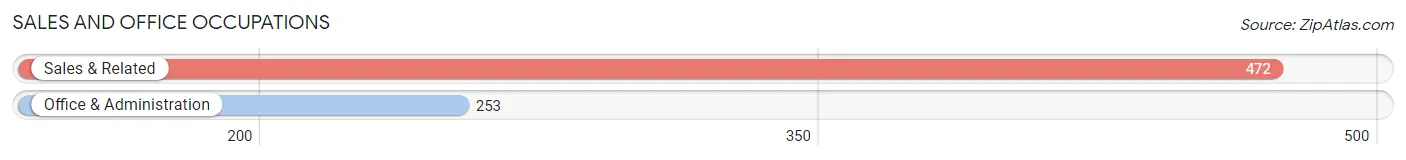
Sales and Office Occupations
The most common Sales and Office occupations in Finderne are Sales & Related (472 | 15.2%), and Office & Administration (253 | 8.2%).
Sales and Office Occupations by Sex
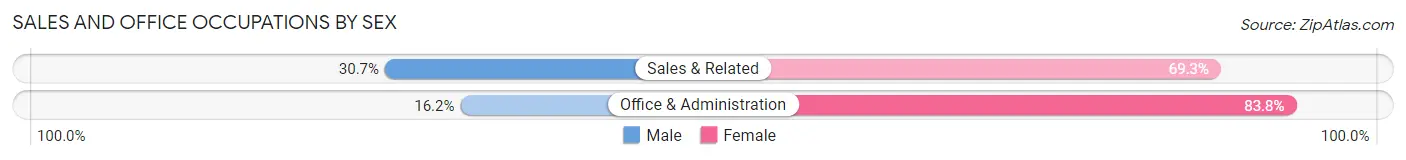
| Occupation | Male | Female |
| Sales & Related | 145 (30.7%) | 327 (69.3%) |
| Office & Administration | 41 (16.2%) | 212 (83.8%) |
| Total (Category) | 186 (25.7%) | 539 (74.3%) |
| Total (Overall) | 1,535 (49.6%) | 1,561 (50.4%) |
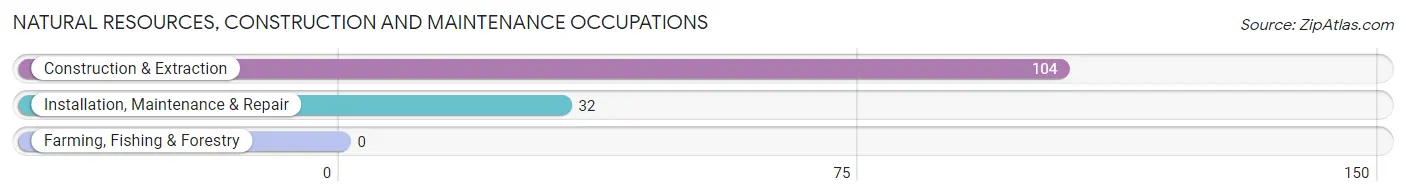
Natural Resources, Construction and Maintenance Occupations
The most common Natural Resources, Construction and Maintenance occupations in Finderne are Construction & Extraction (104 | 3.4%), and Installation, Maintenance & Repair (32 | 1.0%).
Natural Resources, Construction and Maintenance Occupations by Sex
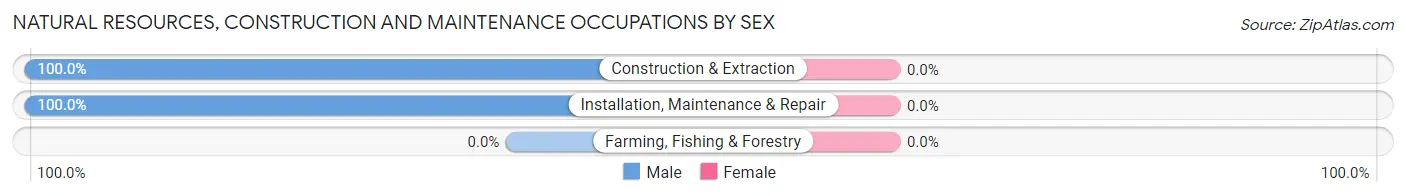
| Occupation | Male | Female |
| Farming, Fishing & Forestry | 0 (0.0%) | 0 (0.0%) |
| Construction & Extraction | 104 (100.0%) | 0 (0.0%) |
| Installation, Maintenance & Repair | 32 (100.0%) | 0 (0.0%) |
| Total (Category) | 136 (100.0%) | 0 (0.0%) |
| Total (Overall) | 1,535 (49.6%) | 1,561 (50.4%) |
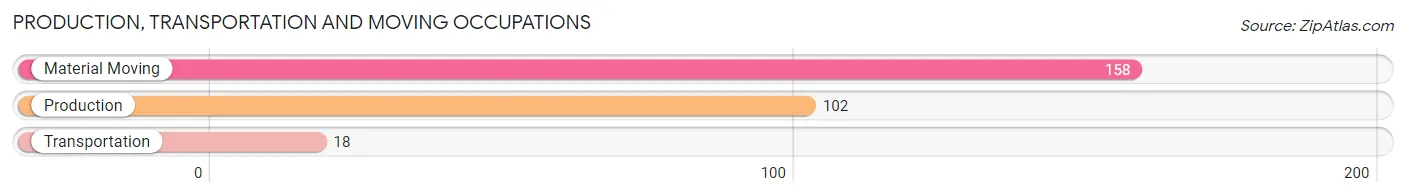
Production, Transportation and Moving Occupations
The most common Production, Transportation and Moving occupations in Finderne are Material Moving (158 | 5.1%), Production (102 | 3.3%), and Transportation (18 | 0.6%).
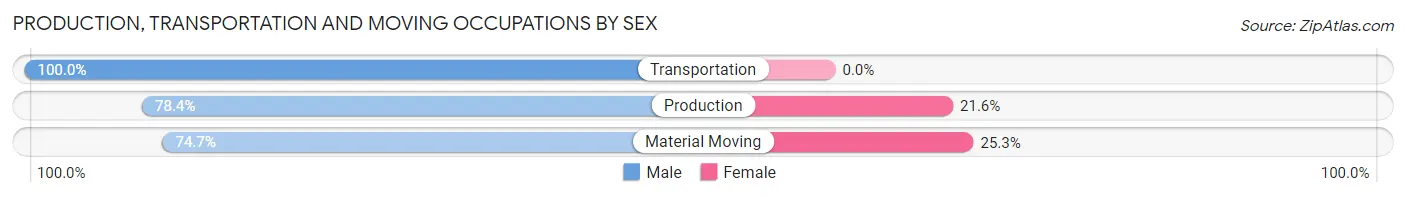
Production, Transportation and Moving Occupations by Sex
| Occupation | Male | Female |
| Production | 80 (78.4%) | 22 (21.6%) |
| Transportation | 18 (100.0%) | 0 (0.0%) |
| Material Moving | 118 (74.7%) | 40 (25.3%) |
| Total (Category) | 216 (77.7%) | 62 (22.3%) |
| Total (Overall) | 1,535 (49.6%) | 1,561 (50.4%) |
Employment Industries by Sex in Finderne
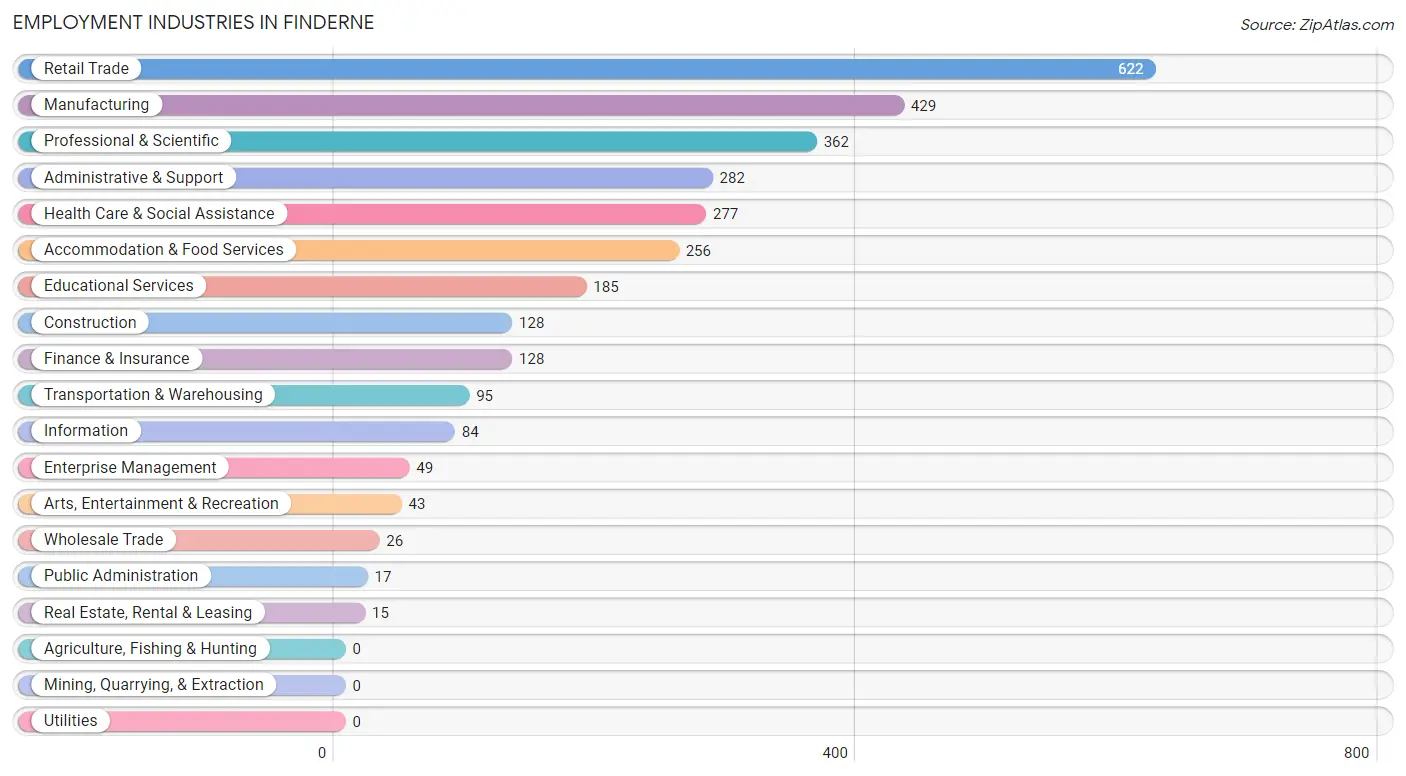
Employment Industries in Finderne
The major employment industries in Finderne include Retail Trade (622 | 20.1%), Manufacturing (429 | 13.9%), Professional & Scientific (362 | 11.7%), Administrative & Support (282 | 9.1%), and Health Care & Social Assistance (277 | 8.9%).
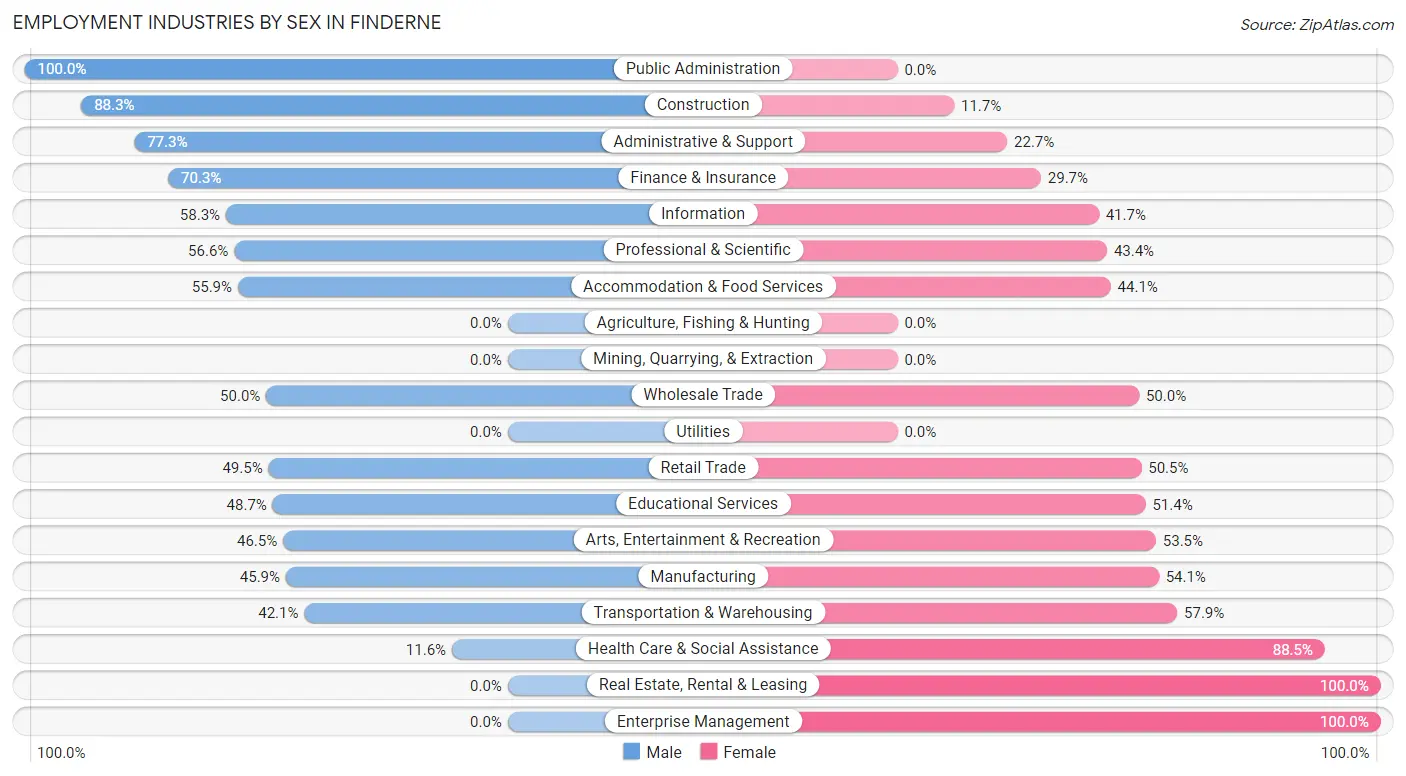
Employment Industries by Sex in Finderne
The Finderne industries that see more men than women are Public Administration (100.0%), Construction (88.3%), and Administrative & Support (77.3%), whereas the industries that tend to have a higher number of women are Real Estate, Rental & Leasing (100.0%), Enterprise Management (100.0%), and Health Care & Social Assistance (88.4%).
| Industry | Male | Female |
| Agriculture, Fishing & Hunting | 0 (0.0%) | 0 (0.0%) |
| Mining, Quarrying, & Extraction | 0 (0.0%) | 0 (0.0%) |
| Construction | 113 (88.3%) | 15 (11.7%) |
| Manufacturing | 197 (45.9%) | 232 (54.1%) |
| Wholesale Trade | 13 (50.0%) | 13 (50.0%) |
| Retail Trade | 308 (49.5%) | 314 (50.5%) |
| Transportation & Warehousing | 40 (42.1%) | 55 (57.9%) |
| Utilities | 0 (0.0%) | 0 (0.0%) |
| Information | 49 (58.3%) | 35 (41.7%) |
| Finance & Insurance | 90 (70.3%) | 38 (29.7%) |
| Real Estate, Rental & Leasing | 0 (0.0%) | 15 (100.0%) |
| Professional & Scientific | 205 (56.6%) | 157 (43.4%) |
| Enterprise Management | 0 (0.0%) | 49 (100.0%) |
| Administrative & Support | 218 (77.3%) | 64 (22.7%) |
| Educational Services | 90 (48.6%) | 95 (51.3%) |
| Health Care & Social Assistance | 32 (11.6%) | 245 (88.4%) |
| Arts, Entertainment & Recreation | 20 (46.5%) | 23 (53.5%) |
| Accommodation & Food Services | 143 (55.9%) | 113 (44.1%) |
| Public Administration | 17 (100.0%) | 0 (0.0%) |
| Total | 1,535 (49.6%) | 1,561 (50.4%) |
Education in Finderne
School Enrollment in Finderne
The most common levels of schooling among the 1,121 students in Finderne are elementary school (317 | 28.3%), college / undergraduate (295 | 26.3%), and high school (269 | 24.0%).
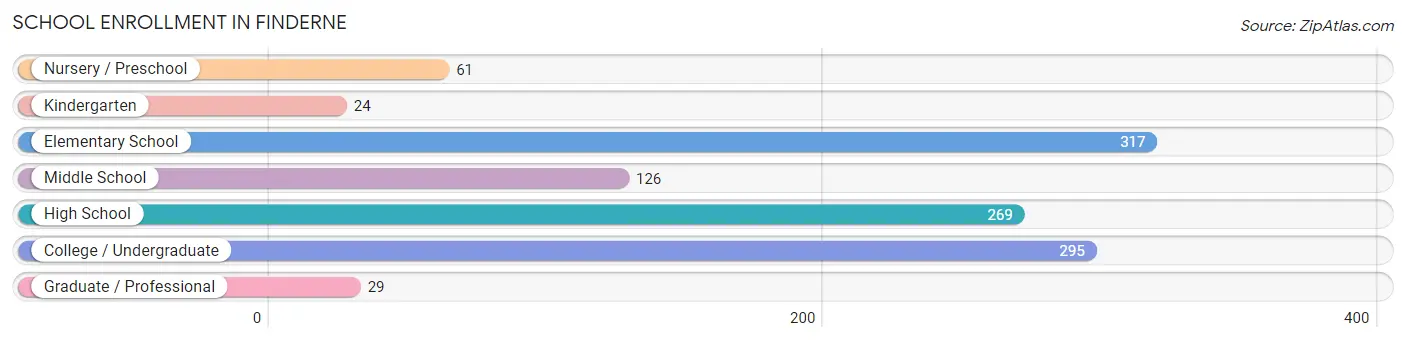
| School Level | # Students | % Students |
| Nursery / Preschool | 61 | 5.4% |
| Kindergarten | 24 | 2.1% |
| Elementary School | 317 | 28.3% |
| Middle School | 126 | 11.2% |
| High School | 269 | 24.0% |
| College / Undergraduate | 295 | 26.3% |
| Graduate / Professional | 29 | 2.6% |
| Total | 1,121 | 100.0% |
School Enrollment by Age by Funding Source in Finderne
Out of a total of 1,121 students who are enrolled in schools in Finderne, 44 (3.9%) attend a private institution, while the remaining 1,077 (96.1%) are enrolled in public schools. The age group of 35 years and over has the highest likelihood of being enrolled in private schools, with 12 (40.0% in the age bracket) enrolled. Conversely, the age group of 3 to 4 year olds has the lowest likelihood of being enrolled in a private school, with 61 (100.0% in the age bracket) attending a public institution.
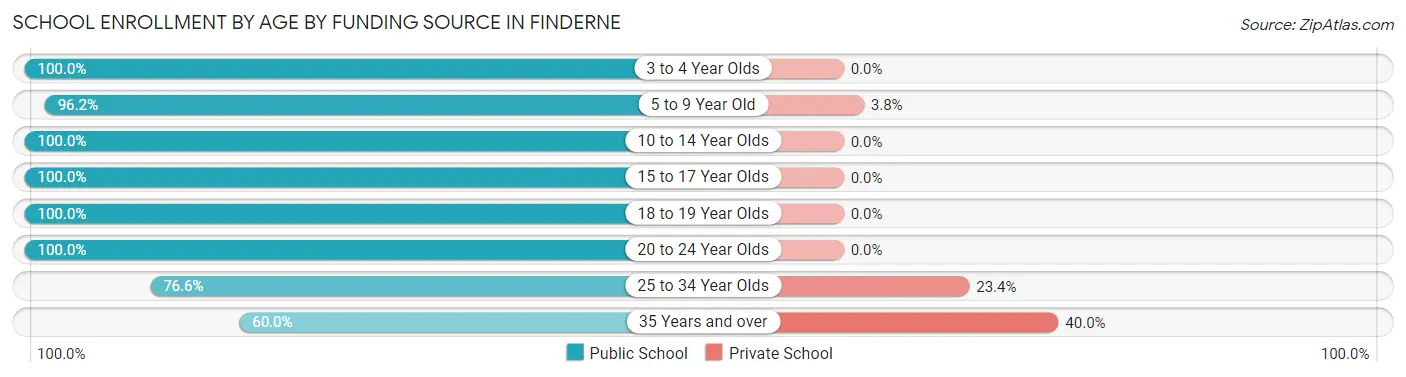
| Age Bracket | Public School | Private School |
| 3 to 4 Year Olds | 61 (100.0%) | 0 (0.0%) |
| 5 to 9 Year Old | 256 (96.2%) | 10 (3.8%) |
| 10 to 14 Year Olds | 220 (100.0%) | 0 (0.0%) |
| 15 to 17 Year Olds | 173 (100.0%) | 0 (0.0%) |
| 18 to 19 Year Olds | 129 (100.0%) | 0 (0.0%) |
| 20 to 24 Year Olds | 148 (100.0%) | 0 (0.0%) |
| 25 to 34 Year Olds | 72 (76.6%) | 22 (23.4%) |
| 35 Years and over | 18 (60.0%) | 12 (40.0%) |
| Total | 1,077 (96.1%) | 44 (3.9%) |
Educational Attainment by Field of Study in Finderne
Business (257 | 12.9%), physical & health sciences (234 | 11.7%), social sciences (227 | 11.4%), computers & mathematics (195 | 9.8%), and psychology (181 | 9.1%) are the most common fields of study among 1,998 individuals in Finderne who have obtained a bachelor's degree or higher.
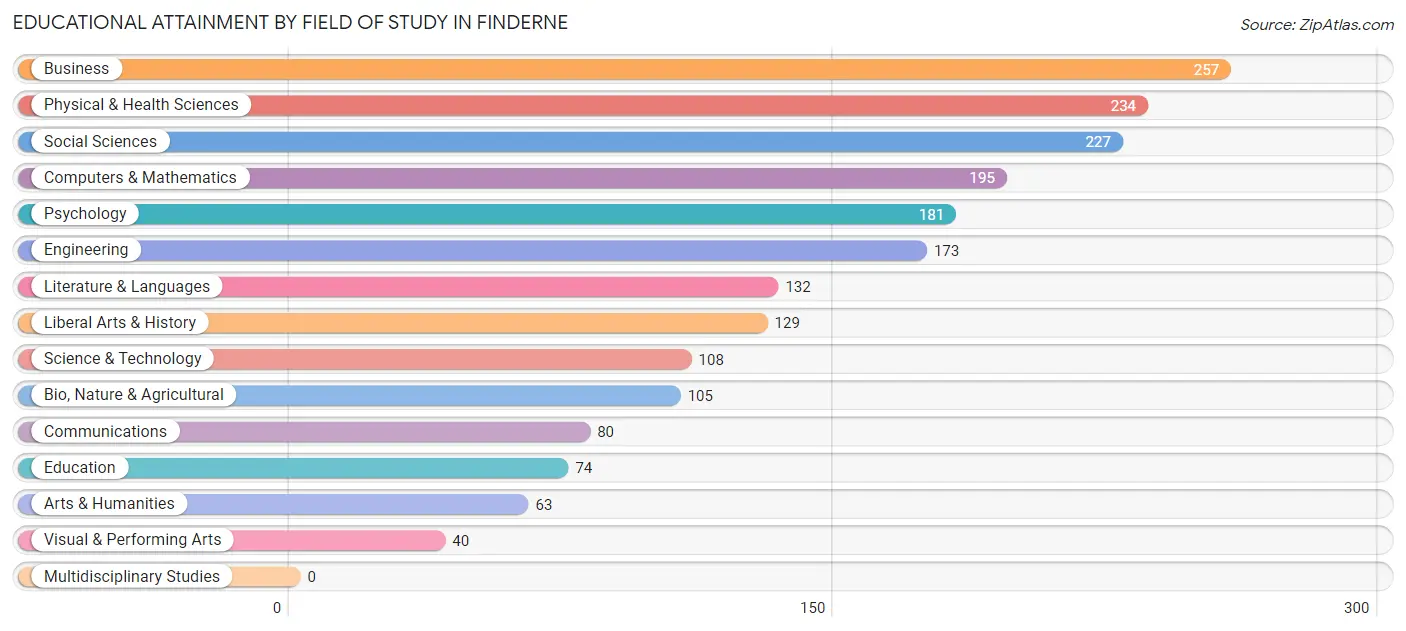
| Field of Study | # Graduates | % Graduates |
| Computers & Mathematics | 195 | 9.8% |
| Bio, Nature & Agricultural | 105 | 5.3% |
| Physical & Health Sciences | 234 | 11.7% |
| Psychology | 181 | 9.1% |
| Social Sciences | 227 | 11.4% |
| Engineering | 173 | 8.7% |
| Multidisciplinary Studies | 0 | 0.0% |
| Science & Technology | 108 | 5.4% |
| Business | 257 | 12.9% |
| Education | 74 | 3.7% |
| Literature & Languages | 132 | 6.6% |
| Liberal Arts & History | 129 | 6.5% |
| Visual & Performing Arts | 40 | 2.0% |
| Communications | 80 | 4.0% |
| Arts & Humanities | 63 | 3.2% |
| Total | 1,998 | 100.0% |
Transportation & Commute in Finderne
Vehicle Availability by Sex in Finderne
The most prevalent vehicle ownership categories in Finderne are males with 2 vehicles (687, accounting for 48.4%) and females with 2 vehicles (619, making up 44.7%).
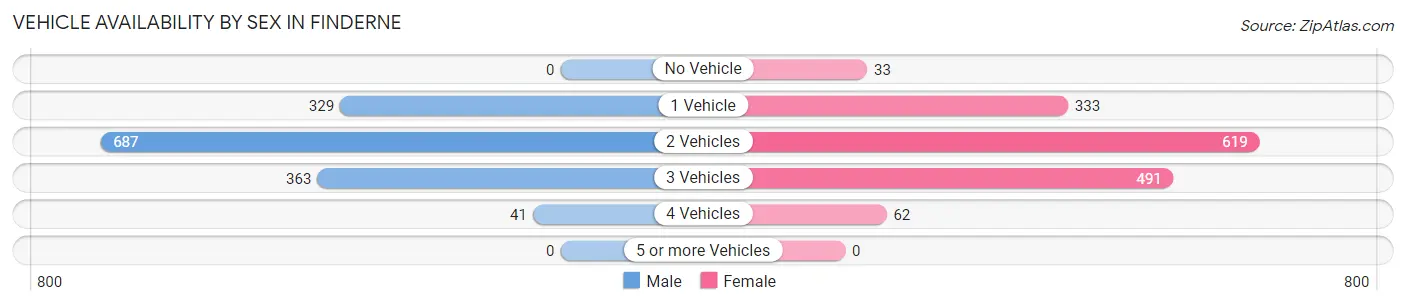
| Vehicles Available | Male | Female |
| No Vehicle | 0 (0.0%) | 33 (2.1%) |
| 1 Vehicle | 329 (23.2%) | 333 (21.6%) |
| 2 Vehicles | 687 (48.4%) | 619 (40.3%) |
| 3 Vehicles | 363 (25.6%) | 491 (31.9%) |
| 4 Vehicles | 41 (2.9%) | 62 (4.0%) |
| 5 or more Vehicles | 0 (0.0%) | 0 (0.0%) |
| Total | 1,420 (100.0%) | 1,538 (100.0%) |
Commute Time in Finderne
The most frequently occuring commute durations in Finderne are 20 to 24 minutes (471 commuters, 18.0%), 45 to 59 minutes (345 commuters, 13.2%), and 5 to 9 minutes (294 commuters, 11.2%).
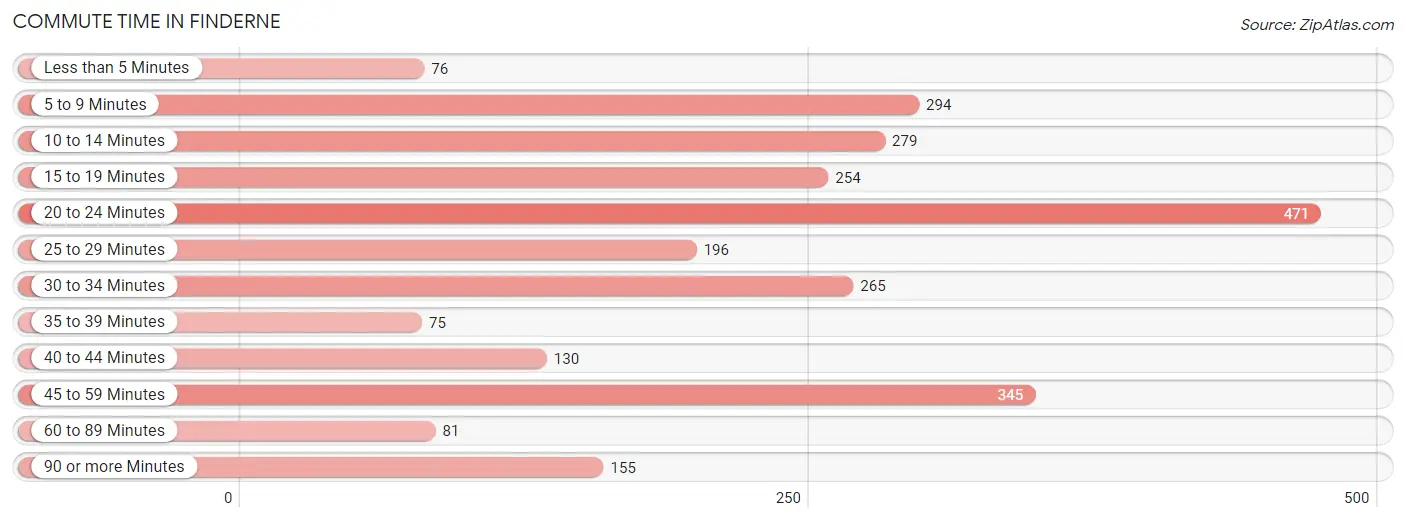
| Commute Time | # Commuters | % Commuters |
| Less than 5 Minutes | 76 | 2.9% |
| 5 to 9 Minutes | 294 | 11.2% |
| 10 to 14 Minutes | 279 | 10.6% |
| 15 to 19 Minutes | 254 | 9.7% |
| 20 to 24 Minutes | 471 | 18.0% |
| 25 to 29 Minutes | 196 | 7.5% |
| 30 to 34 Minutes | 265 | 10.1% |
| 35 to 39 Minutes | 75 | 2.9% |
| 40 to 44 Minutes | 130 | 5.0% |
| 45 to 59 Minutes | 345 | 13.2% |
| 60 to 89 Minutes | 81 | 3.1% |
| 90 or more Minutes | 155 | 5.9% |
Commute Time by Sex in Finderne
The most common commute times in Finderne are 20 to 24 minutes (252 commuters, 20.8%) for males and 45 to 59 minutes (294 commuters, 20.8%) for females.
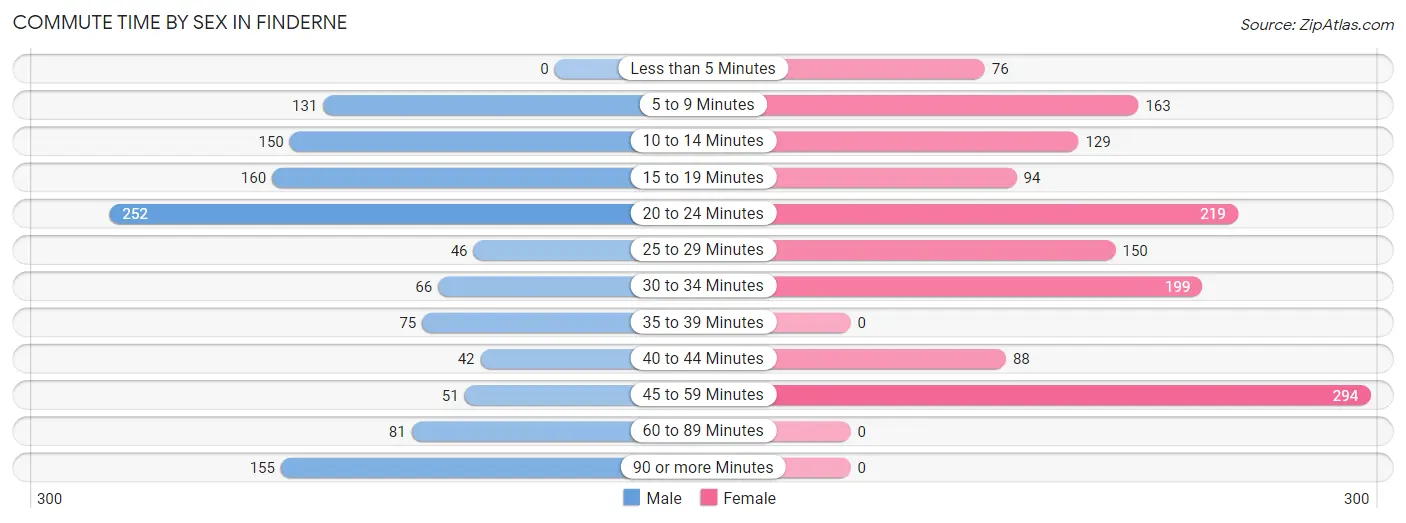
| Commute Time | Male | Female |
| Less than 5 Minutes | 0 (0.0%) | 76 (5.4%) |
| 5 to 9 Minutes | 131 (10.8%) | 163 (11.5%) |
| 10 to 14 Minutes | 150 (12.4%) | 129 (9.1%) |
| 15 to 19 Minutes | 160 (13.2%) | 94 (6.7%) |
| 20 to 24 Minutes | 252 (20.8%) | 219 (15.5%) |
| 25 to 29 Minutes | 46 (3.8%) | 150 (10.6%) |
| 30 to 34 Minutes | 66 (5.5%) | 199 (14.1%) |
| 35 to 39 Minutes | 75 (6.2%) | 0 (0.0%) |
| 40 to 44 Minutes | 42 (3.5%) | 88 (6.2%) |
| 45 to 59 Minutes | 51 (4.2%) | 294 (20.8%) |
| 60 to 89 Minutes | 81 (6.7%) | 0 (0.0%) |
| 90 or more Minutes | 155 (12.8%) | 0 (0.0%) |
Time of Departure to Work by Sex in Finderne
The most frequent times of departure to work in Finderne are 9:00 AM to 9:59 AM (206, 17.0%) for males and 8:30 AM to 8:59 AM (310, 22.0%) for females.
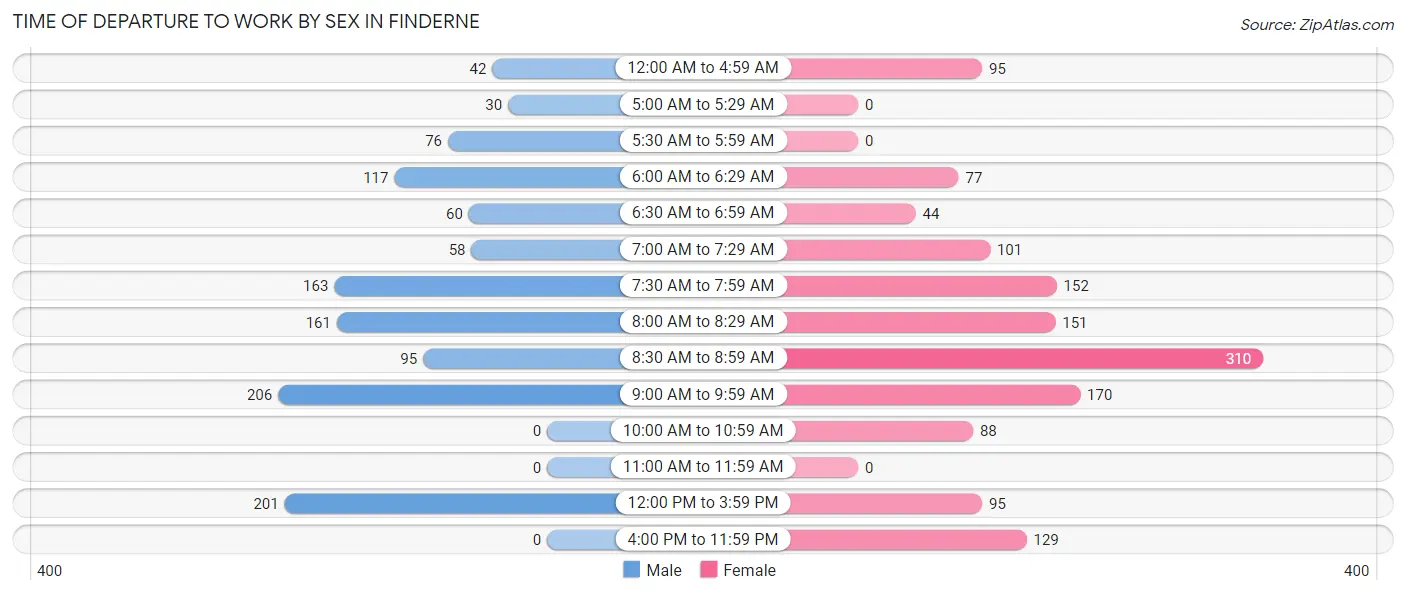
| Time of Departure | Male | Female |
| 12:00 AM to 4:59 AM | 42 (3.5%) | 95 (6.7%) |
| 5:00 AM to 5:29 AM | 30 (2.5%) | 0 (0.0%) |
| 5:30 AM to 5:59 AM | 76 (6.3%) | 0 (0.0%) |
| 6:00 AM to 6:29 AM | 117 (9.7%) | 77 (5.4%) |
| 6:30 AM to 6:59 AM | 60 (5.0%) | 44 (3.1%) |
| 7:00 AM to 7:29 AM | 58 (4.8%) | 101 (7.1%) |
| 7:30 AM to 7:59 AM | 163 (13.5%) | 152 (10.8%) |
| 8:00 AM to 8:29 AM | 161 (13.3%) | 151 (10.7%) |
| 8:30 AM to 8:59 AM | 95 (7.9%) | 310 (22.0%) |
| 9:00 AM to 9:59 AM | 206 (17.0%) | 170 (12.0%) |
| 10:00 AM to 10:59 AM | 0 (0.0%) | 88 (6.2%) |
| 11:00 AM to 11:59 AM | 0 (0.0%) | 0 (0.0%) |
| 12:00 PM to 3:59 PM | 201 (16.6%) | 95 (6.7%) |
| 4:00 PM to 11:59 PM | 0 (0.0%) | 129 (9.1%) |
| Total | 1,209 (100.0%) | 1,412 (100.0%) |
Housing Occupancy in Finderne
Occupancy by Ownership in Finderne
Of the total 2,384 dwellings in Finderne, owner-occupied units account for 1,469 (61.6%), while renter-occupied units make up 915 (38.4%).
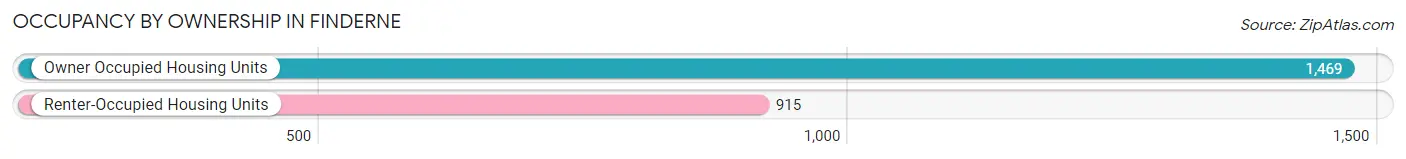
| Occupancy | # Housing Units | % Housing Units |
| Owner Occupied Housing Units | 1,469 | 61.6% |
| Renter-Occupied Housing Units | 915 | 38.4% |
| Total Occupied Housing Units | 2,384 | 100.0% |
Occupancy by Household Size in Finderne
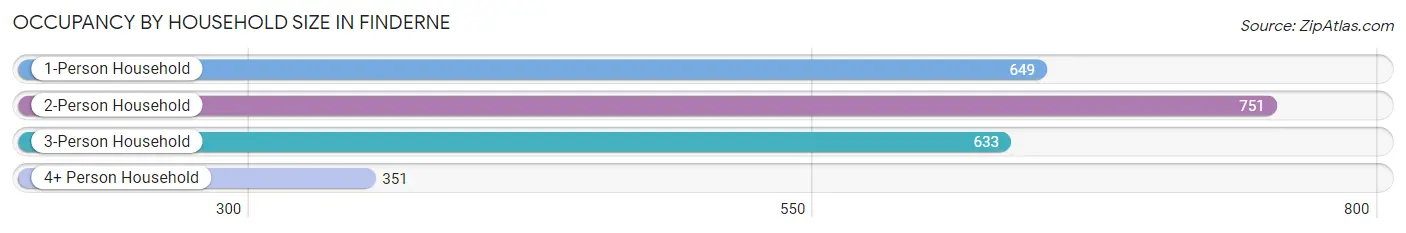
| Household Size | # Housing Units | % Housing Units |
| 1-Person Household | 649 | 27.2% |
| 2-Person Household | 751 | 31.5% |
| 3-Person Household | 633 | 26.6% |
| 4+ Person Household | 351 | 14.7% |
| Total Housing Units | 2,384 | 100.0% |
Occupancy by Ownership by Household Size in Finderne
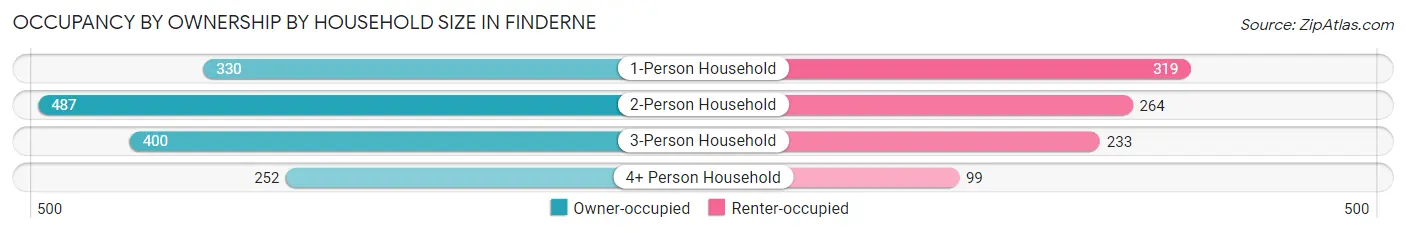
| Household Size | Owner-occupied | Renter-occupied |
| 1-Person Household | 330 (50.8%) | 319 (49.1%) |
| 2-Person Household | 487 (64.8%) | 264 (35.1%) |
| 3-Person Household | 400 (63.2%) | 233 (36.8%) |
| 4+ Person Household | 252 (71.8%) | 99 (28.2%) |
| Total Housing Units | 1,469 (61.6%) | 915 (38.4%) |
Occupancy by Educational Attainment in Finderne
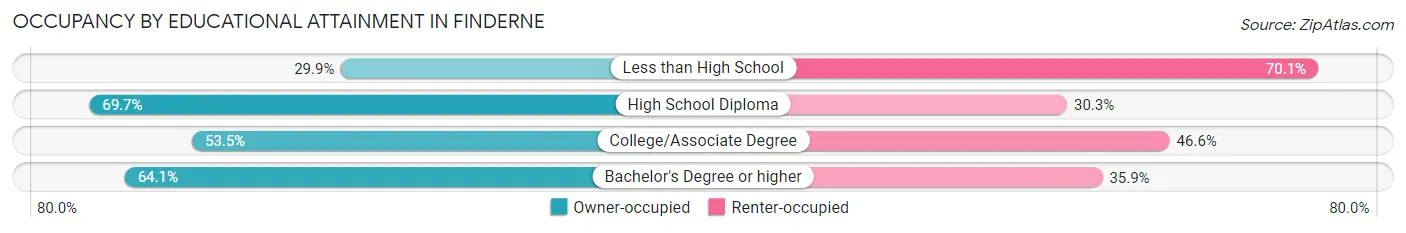
| Household Size | Owner-occupied | Renter-occupied |
| Less than High School | 50 (29.9%) | 117 (70.1%) |
| High School Diploma | 509 (69.7%) | 221 (30.3%) |
| College/Associate Degree | 217 (53.4%) | 189 (46.6%) |
| Bachelor's Degree or higher | 693 (64.1%) | 388 (35.9%) |
Occupancy by Age of Householder in Finderne
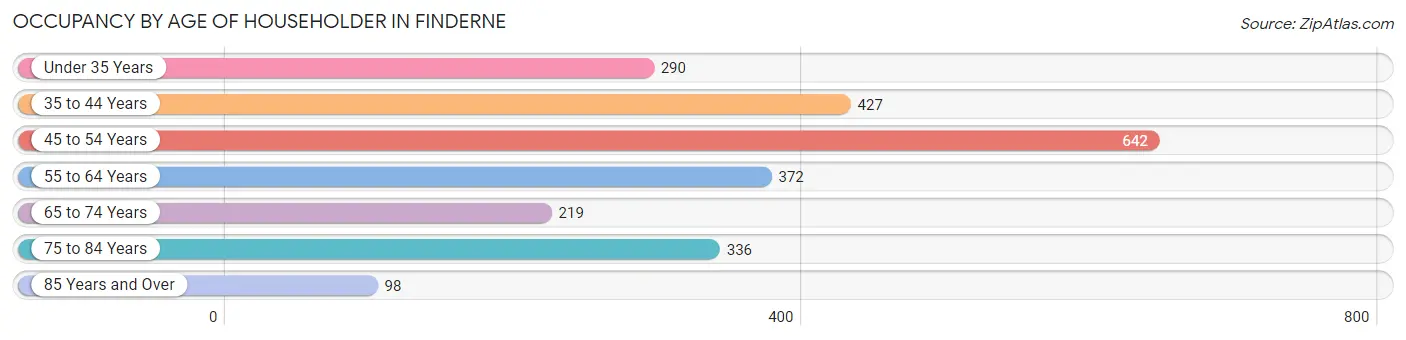
| Age Bracket | # Households | % Households |
| Under 35 Years | 290 | 12.2% |
| 35 to 44 Years | 427 | 17.9% |
| 45 to 54 Years | 642 | 26.9% |
| 55 to 64 Years | 372 | 15.6% |
| 65 to 74 Years | 219 | 9.2% |
| 75 to 84 Years | 336 | 14.1% |
| 85 Years and Over | 98 | 4.1% |
| Total | 2,384 | 100.0% |
Housing Finances in Finderne
Median Income by Occupancy in Finderne
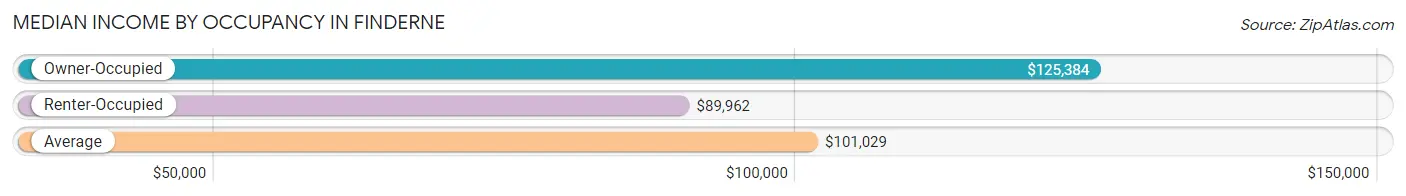
| Occupancy Type | # Households | Median Income |
| Owner-Occupied | 1,469 (61.6%) | $125,384 |
| Renter-Occupied | 915 (38.4%) | $89,962 |
| Average | 2,384 (100.0%) | $101,029 |
Occupancy by Householder Income Bracket in Finderne
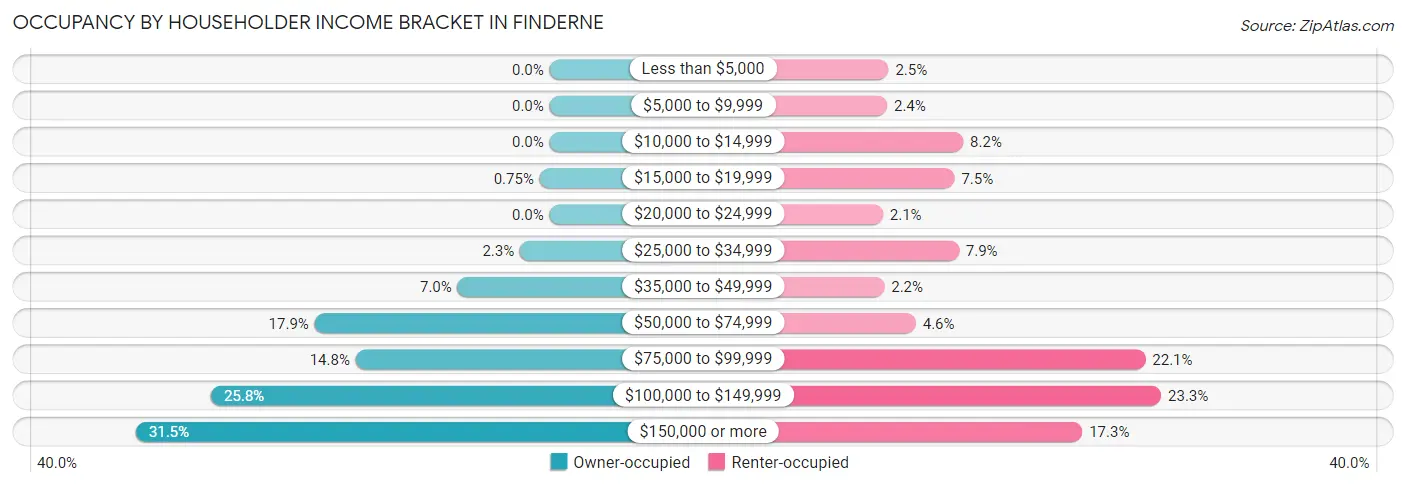
| Income Bracket | Owner-occupied | Renter-occupied |
| Less than $5,000 | 0 (0.0%) | 23 (2.5%) |
| $5,000 to $9,999 | 0 (0.0%) | 22 (2.4%) |
| $10,000 to $14,999 | 0 (0.0%) | 75 (8.2%) |
| $15,000 to $19,999 | 11 (0.7%) | 69 (7.5%) |
| $20,000 to $24,999 | 0 (0.0%) | 19 (2.1%) |
| $25,000 to $34,999 | 33 (2.2%) | 72 (7.9%) |
| $35,000 to $49,999 | 103 (7.0%) | 20 (2.2%) |
| $50,000 to $74,999 | 263 (17.9%) | 42 (4.6%) |
| $75,000 to $99,999 | 217 (14.8%) | 202 (22.1%) |
| $100,000 to $149,999 | 379 (25.8%) | 213 (23.3%) |
| $150,000 or more | 463 (31.5%) | 158 (17.3%) |
| Total | 1,469 (100.0%) | 915 (100.0%) |
Monthly Housing Cost Tiers in Finderne
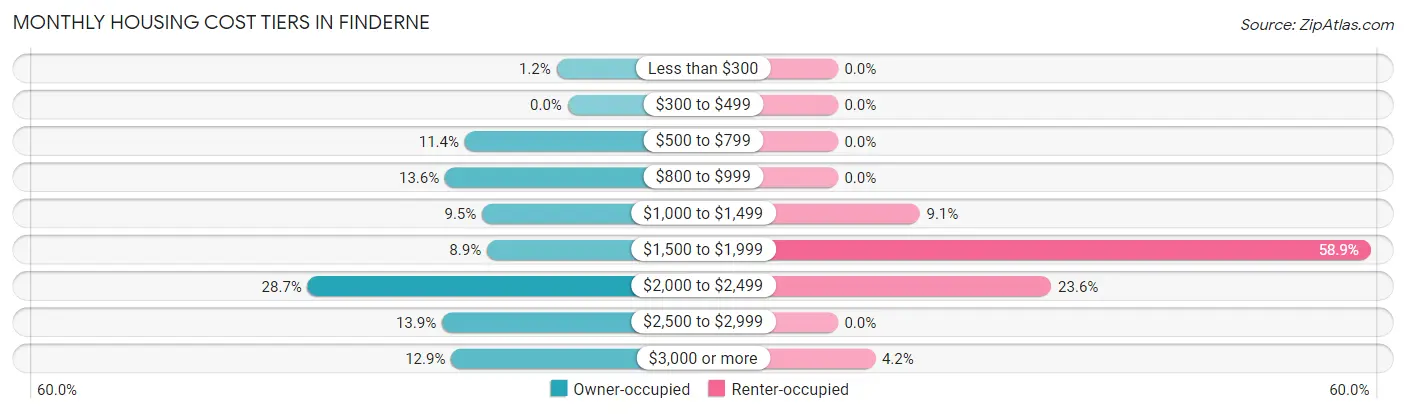
| Monthly Cost | Owner-occupied | Renter-occupied |
| Less than $300 | 18 (1.2%) | 0 (0.0%) |
| $300 to $499 | 0 (0.0%) | 0 (0.0%) |
| $500 to $799 | 167 (11.4%) | 0 (0.0%) |
| $800 to $999 | 199 (13.6%) | 0 (0.0%) |
| $1,000 to $1,499 | 139 (9.5%) | 83 (9.1%) |
| $1,500 to $1,999 | 131 (8.9%) | 539 (58.9%) |
| $2,000 to $2,499 | 422 (28.7%) | 216 (23.6%) |
| $2,500 to $2,999 | 204 (13.9%) | 0 (0.0%) |
| $3,000 or more | 189 (12.9%) | 38 (4.2%) |
| Total | 1,469 (100.0%) | 915 (100.0%) |
Physical Housing Characteristics in Finderne
Housing Structures in Finderne
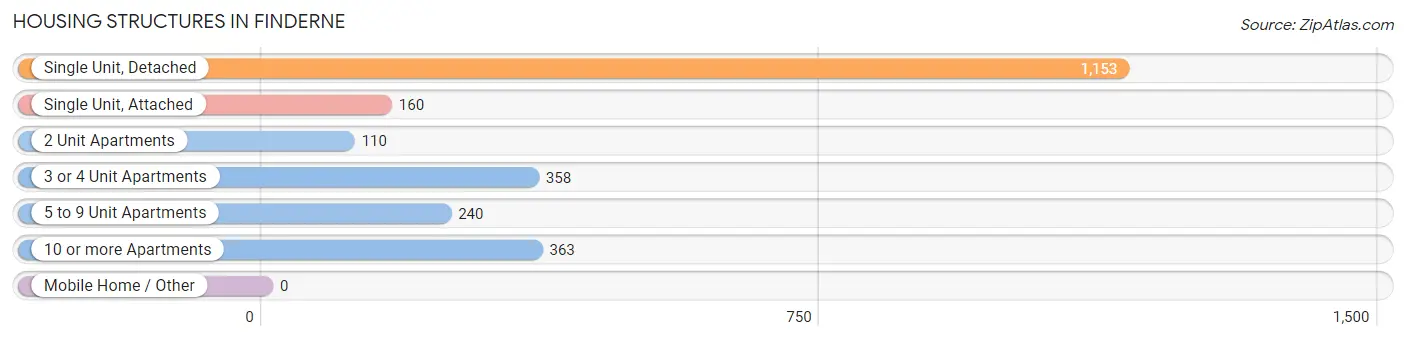
| Structure Type | # Housing Units | % Housing Units |
| Single Unit, Detached | 1,153 | 48.4% |
| Single Unit, Attached | 160 | 6.7% |
| 2 Unit Apartments | 110 | 4.6% |
| 3 or 4 Unit Apartments | 358 | 15.0% |
| 5 to 9 Unit Apartments | 240 | 10.1% |
| 10 or more Apartments | 363 | 15.2% |
| Mobile Home / Other | 0 | 0.0% |
| Total | 2,384 | 100.0% |
Housing Structures by Occupancy in Finderne
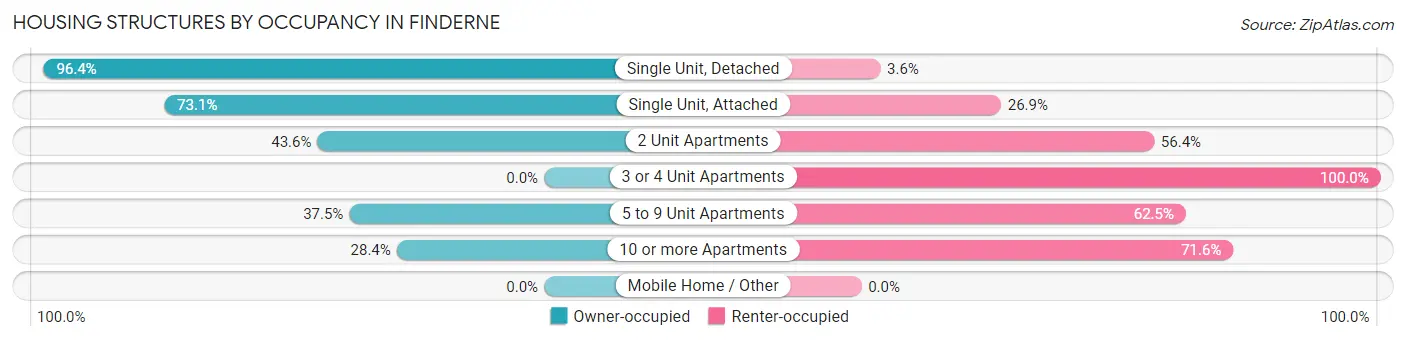
| Structure Type | Owner-occupied | Renter-occupied |
| Single Unit, Detached | 1,111 (96.4%) | 42 (3.6%) |
| Single Unit, Attached | 117 (73.1%) | 43 (26.9%) |
| 2 Unit Apartments | 48 (43.6%) | 62 (56.4%) |
| 3 or 4 Unit Apartments | 0 (0.0%) | 358 (100.0%) |
| 5 to 9 Unit Apartments | 90 (37.5%) | 150 (62.5%) |
| 10 or more Apartments | 103 (28.4%) | 260 (71.6%) |
| Mobile Home / Other | 0 (0.0%) | 0 (0.0%) |
| Total | 1,469 (61.6%) | 915 (38.4%) |
Housing Structures by Number of Rooms in Finderne
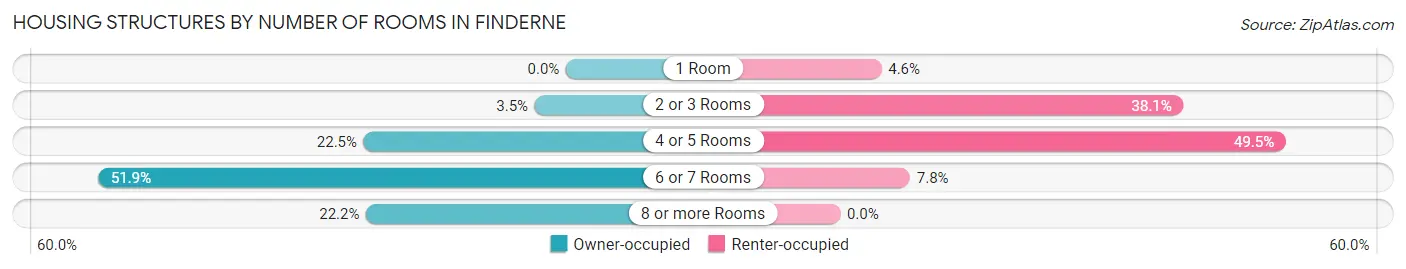
| Number of Rooms | Owner-occupied | Renter-occupied |
| 1 Room | 0 (0.0%) | 42 (4.6%) |
| 2 or 3 Rooms | 51 (3.5%) | 349 (38.1%) |
| 4 or 5 Rooms | 330 (22.5%) | 453 (49.5%) |
| 6 or 7 Rooms | 762 (51.9%) | 71 (7.8%) |
| 8 or more Rooms | 326 (22.2%) | 0 (0.0%) |
| Total | 1,469 (100.0%) | 915 (100.0%) |
Housing Structure by Heating Type in Finderne
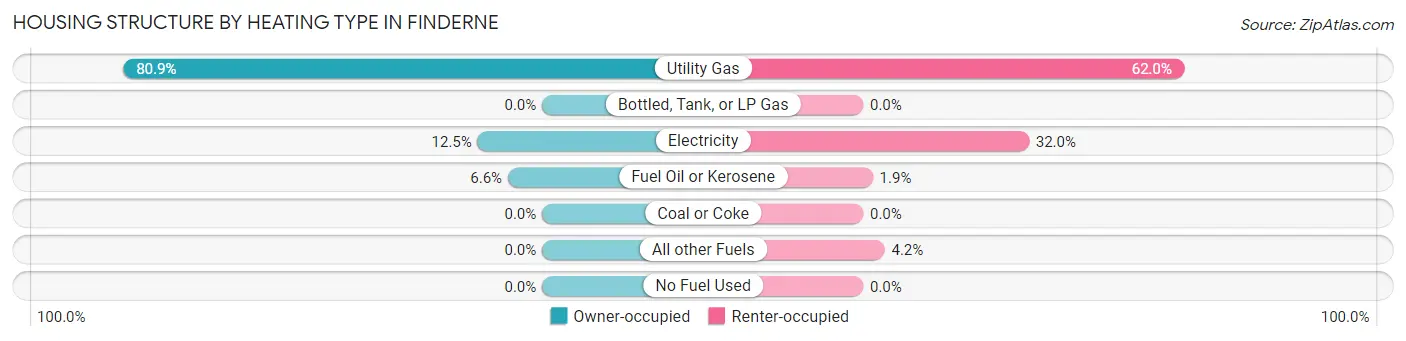
| Heating Type | Owner-occupied | Renter-occupied |
| Utility Gas | 1,189 (80.9%) | 567 (62.0%) |
| Bottled, Tank, or LP Gas | 0 (0.0%) | 0 (0.0%) |
| Electricity | 183 (12.5%) | 293 (32.0%) |
| Fuel Oil or Kerosene | 97 (6.6%) | 17 (1.9%) |
| Coal or Coke | 0 (0.0%) | 0 (0.0%) |
| All other Fuels | 0 (0.0%) | 38 (4.2%) |
| No Fuel Used | 0 (0.0%) | 0 (0.0%) |
| Total | 1,469 (100.0%) | 915 (100.0%) |
Household Vehicle Usage in Finderne
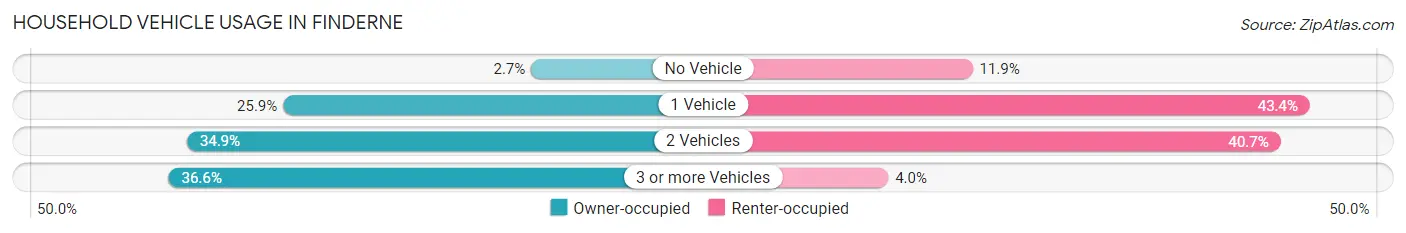
| Vehicles per Household | Owner-occupied | Renter-occupied |
| No Vehicle | 40 (2.7%) | 109 (11.9%) |
| 1 Vehicle | 380 (25.9%) | 397 (43.4%) |
| 2 Vehicles | 512 (34.8%) | 372 (40.7%) |
| 3 or more Vehicles | 537 (36.6%) | 37 (4.0%) |
| Total | 1,469 (100.0%) | 915 (100.0%) |
Real Estate & Mortgages in Finderne
Real Estate and Mortgage Overview in Finderne
| Characteristic | Without Mortgage | With Mortgage |
| Housing Units | 522 | 947 |
| Median Property Value | $368,800 | $377,400 |
| Median Household Income | $104,167 | $271 |
| Monthly Housing Costs | $886 | $189 |
| Real Estate Taxes | $6,766 | $0 |
Property Value by Mortgage Status in Finderne
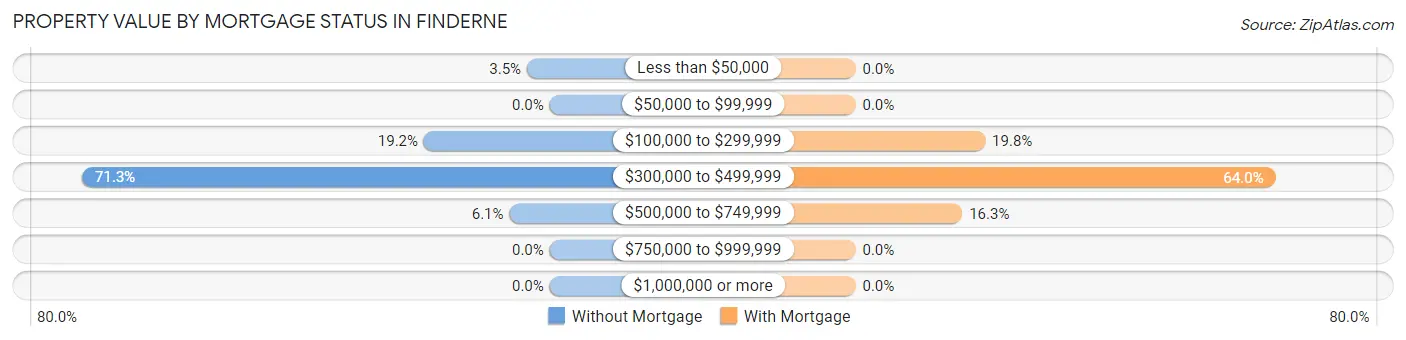
| Property Value | Without Mortgage | With Mortgage |
| Less than $50,000 | 18 (3.5%) | 0 (0.0%) |
| $50,000 to $99,999 | 0 (0.0%) | 0 (0.0%) |
| $100,000 to $299,999 | 100 (19.2%) | 187 (19.8%) |
| $300,000 to $499,999 | 372 (71.3%) | 606 (64.0%) |
| $500,000 to $749,999 | 32 (6.1%) | 154 (16.3%) |
| $750,000 to $999,999 | 0 (0.0%) | 0 (0.0%) |
| $1,000,000 or more | 0 (0.0%) | 0 (0.0%) |
| Total | 522 (100.0%) | 947 (100.0%) |
Household Income by Mortgage Status in Finderne
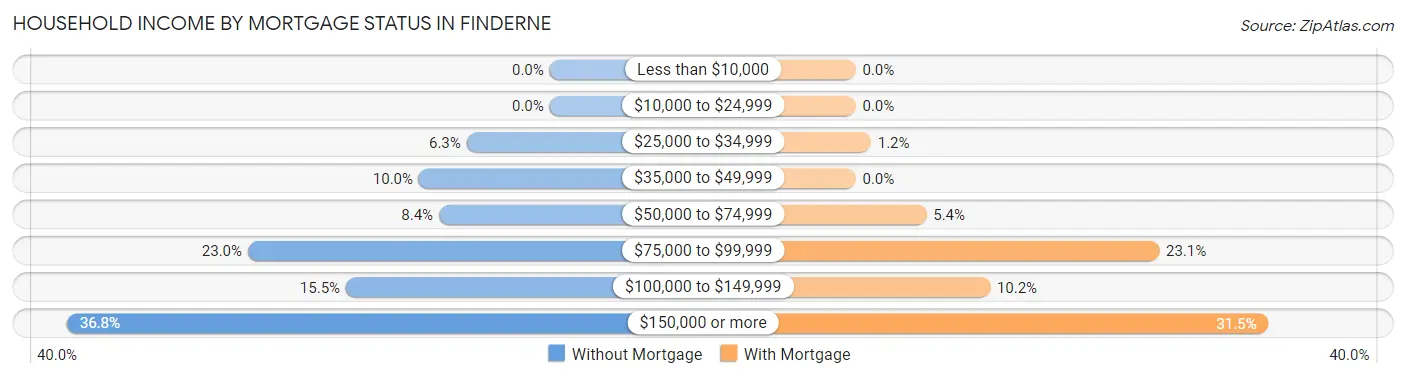
| Household Income | Without Mortgage | With Mortgage |
| Less than $10,000 | 0 (0.0%) | 0 (0.0%) |
| $10,000 to $24,999 | 0 (0.0%) | 0 (0.0%) |
| $25,000 to $34,999 | 33 (6.3%) | 11 (1.2%) |
| $35,000 to $49,999 | 52 (10.0%) | 0 (0.0%) |
| $50,000 to $74,999 | 44 (8.4%) | 51 (5.4%) |
| $75,000 to $99,999 | 120 (23.0%) | 219 (23.1%) |
| $100,000 to $149,999 | 81 (15.5%) | 97 (10.2%) |
| $150,000 or more | 192 (36.8%) | 298 (31.5%) |
| Total | 522 (100.0%) | 947 (100.0%) |
Property Value to Household Income Ratio in Finderne
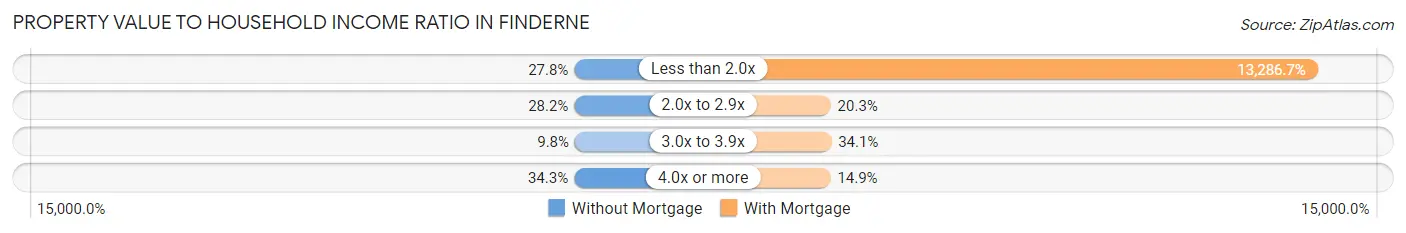
| Value-to-Income Ratio | Without Mortgage | With Mortgage |
| Less than 2.0x | 145 (27.8%) | 125,825 (13,286.7%) |
| 2.0x to 2.9x | 147 (28.2%) | 192 (20.3%) |
| 3.0x to 3.9x | 51 (9.8%) | 323 (34.1%) |
| 4.0x or more | 179 (34.3%) | 141 (14.9%) |
| Total | 522 (100.0%) | 947 (100.0%) |
Real Estate Taxes by Mortgage Status in Finderne
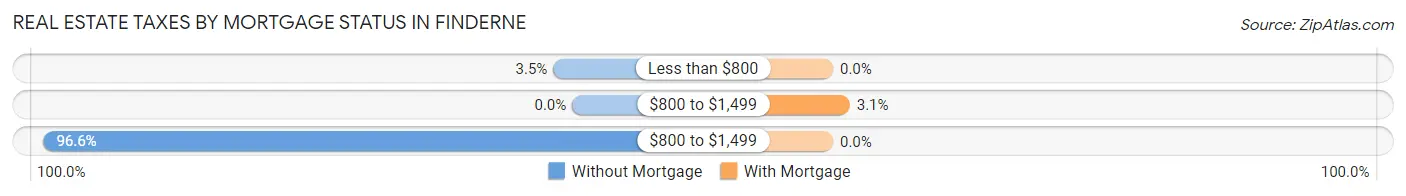
| Property Taxes | Without Mortgage | With Mortgage |
| Less than $800 | 18 (3.5%) | 0 (0.0%) |
| $800 to $1,499 | 0 (0.0%) | 29 (3.1%) |
| $800 to $1,499 | 504 (96.6%) | 0 (0.0%) |
| Total | 522 (100.0%) | 947 (100.0%) |
Health & Disability in Finderne
Health Insurance Coverage by Age in Finderne
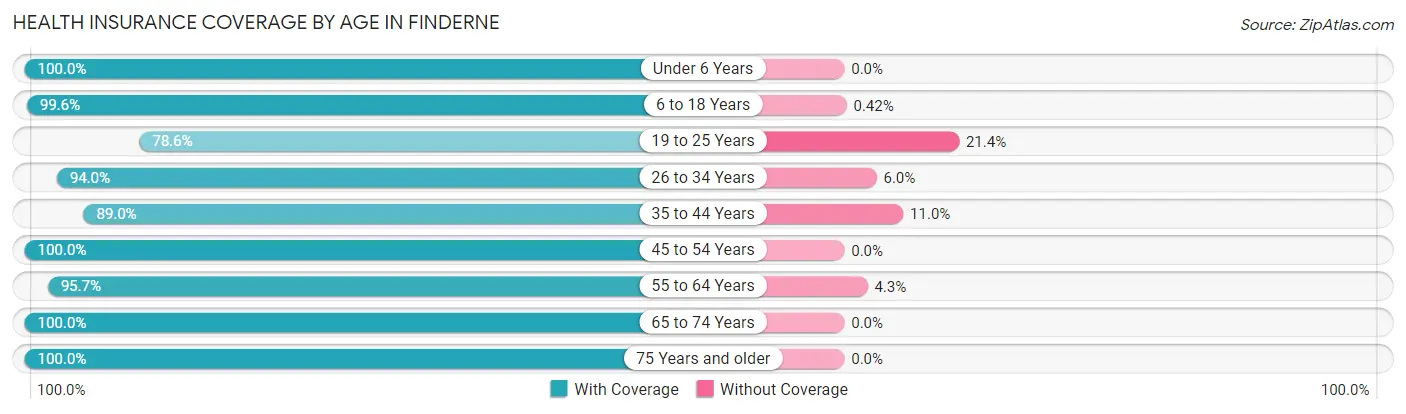
| Age Bracket | With Coverage | Without Coverage |
| Under 6 Years | 198 (100.0%) | 0 (0.0%) |
| 6 to 18 Years | 711 (99.6%) | 3 (0.4%) |
| 19 to 25 Years | 408 (78.6%) | 111 (21.4%) |
| 26 to 34 Years | 579 (94.0%) | 37 (6.0%) |
| 35 to 44 Years | 908 (89.0%) | 112 (11.0%) |
| 45 to 54 Years | 972 (100.0%) | 0 (0.0%) |
| 55 to 64 Years | 576 (95.7%) | 26 (4.3%) |
| 65 to 74 Years | 529 (100.0%) | 0 (0.0%) |
| 75 Years and older | 582 (100.0%) | 0 (0.0%) |
| Total | 5,463 (95.0%) | 289 (5.0%) |
Health Insurance Coverage by Citizenship Status in Finderne
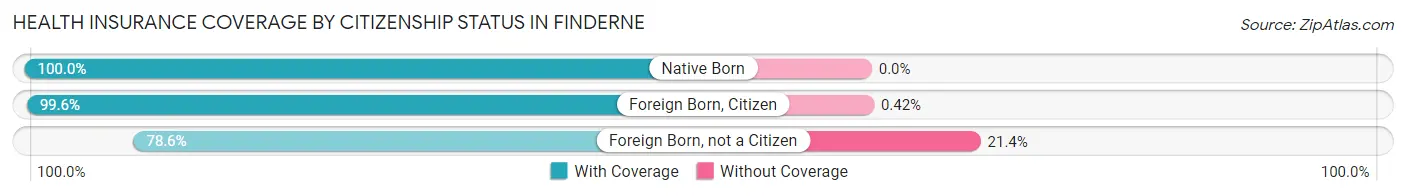
| Citizenship Status | With Coverage | Without Coverage |
| Native Born | 198 (100.0%) | 0 (0.0%) |
| Foreign Born, Citizen | 711 (99.6%) | 3 (0.4%) |
| Foreign Born, not a Citizen | 408 (78.6%) | 111 (21.4%) |
Health Insurance Coverage by Household Income in Finderne
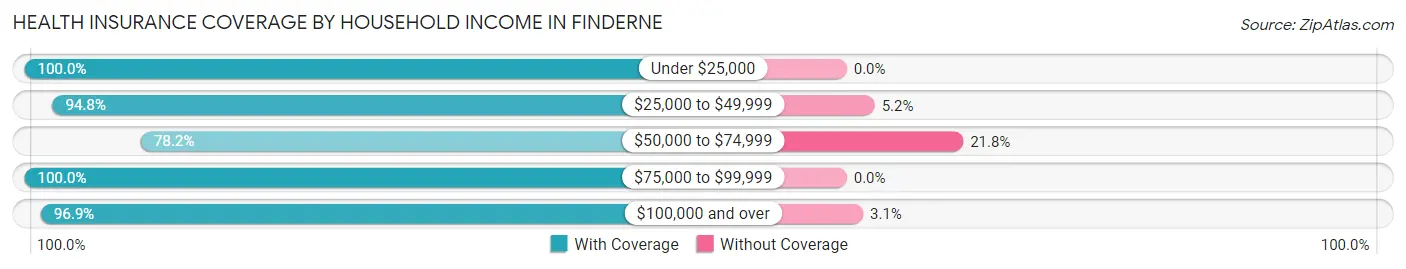
| Household Income | With Coverage | Without Coverage |
| Under $25,000 | 289 (100.0%) | 0 (0.0%) |
| $25,000 to $49,999 | 362 (94.8%) | 20 (5.2%) |
| $50,000 to $74,999 | 588 (78.2%) | 164 (21.8%) |
| $75,000 to $99,999 | 1,064 (100.0%) | 0 (0.0%) |
| $100,000 and over | 3,135 (96.9%) | 99 (3.1%) |
Public vs Private Health Insurance Coverage by Age in Finderne
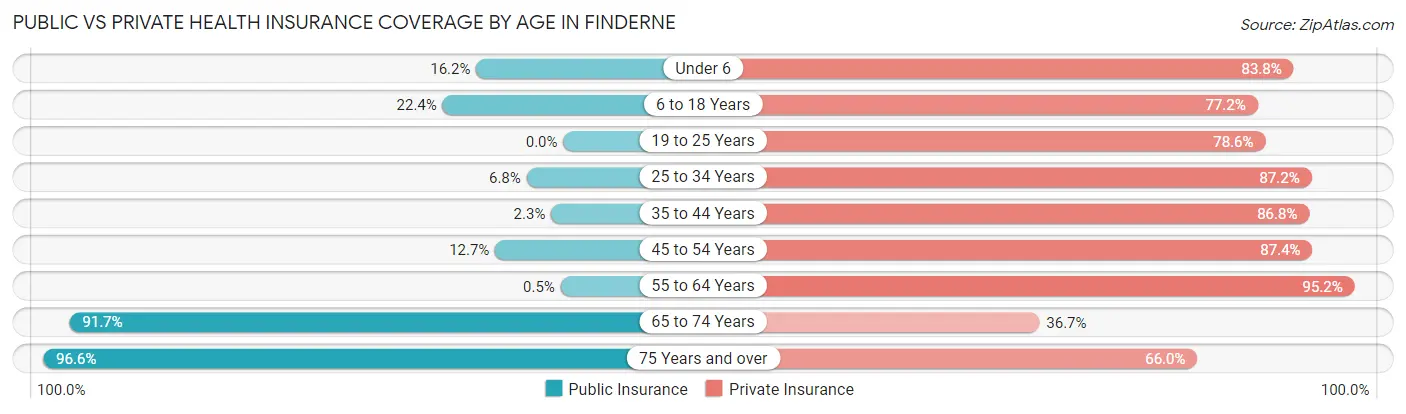
| Age Bracket | Public Insurance | Private Insurance |
| Under 6 | 32 (16.2%) | 166 (83.8%) |
| 6 to 18 Years | 160 (22.4%) | 551 (77.2%) |
| 19 to 25 Years | 0 (0.0%) | 408 (78.6%) |
| 25 to 34 Years | 42 (6.8%) | 537 (87.2%) |
| 35 to 44 Years | 23 (2.2%) | 885 (86.8%) |
| 45 to 54 Years | 123 (12.7%) | 849 (87.4%) |
| 55 to 64 Years | 3 (0.5%) | 573 (95.2%) |
| 65 to 74 Years | 485 (91.7%) | 194 (36.7%) |
| 75 Years and over | 562 (96.6%) | 384 (66.0%) |
| Total | 1,430 (24.9%) | 4,547 (79.0%) |
Disability Status by Sex by Age in Finderne
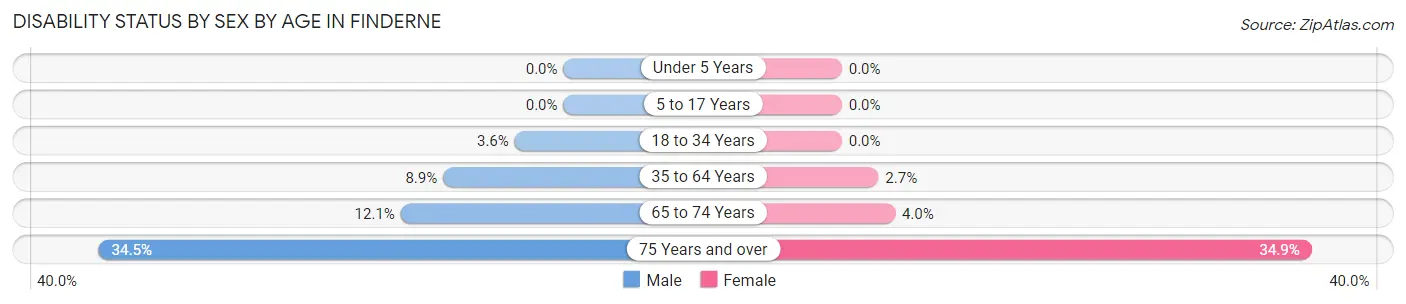
| Age Bracket | Male | Female |
| Under 5 Years | 0 (0.0%) | 0 (0.0%) |
| 5 to 17 Years | 0 (0.0%) | 0 (0.0%) |
| 18 to 34 Years | 22 (3.6%) | 0 (0.0%) |
| 35 to 64 Years | 120 (8.9%) | 34 (2.7%) |
| 65 to 74 Years | 18 (12.1%) | 15 (4.0%) |
| 75 Years and over | 89 (34.5%) | 113 (34.9%) |
Disability Class by Sex by Age in Finderne
Disability Class: Hearing Difficulty
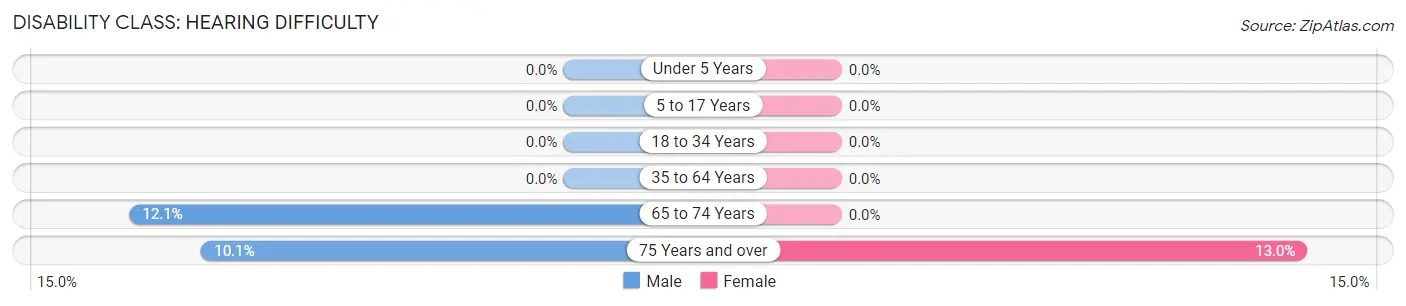
| Age Bracket | Male | Female |
| Under 5 Years | 0 (0.0%) | 0 (0.0%) |
| 5 to 17 Years | 0 (0.0%) | 0 (0.0%) |
| 18 to 34 Years | 0 (0.0%) | 0 (0.0%) |
| 35 to 64 Years | 0 (0.0%) | 0 (0.0%) |
| 65 to 74 Years | 18 (12.1%) | 0 (0.0%) |
| 75 Years and over | 26 (10.1%) | 42 (13.0%) |
Disability Class: Vision Difficulty
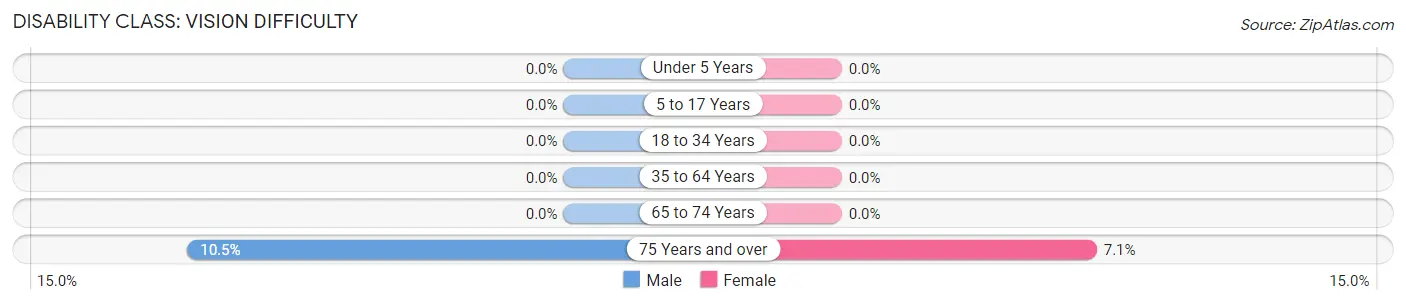
| Age Bracket | Male | Female |
| Under 5 Years | 0 (0.0%) | 0 (0.0%) |
| 5 to 17 Years | 0 (0.0%) | 0 (0.0%) |
| 18 to 34 Years | 0 (0.0%) | 0 (0.0%) |
| 35 to 64 Years | 0 (0.0%) | 0 (0.0%) |
| 65 to 74 Years | 0 (0.0%) | 0 (0.0%) |
| 75 Years and over | 27 (10.5%) | 23 (7.1%) |
Disability Class: Cognitive Difficulty
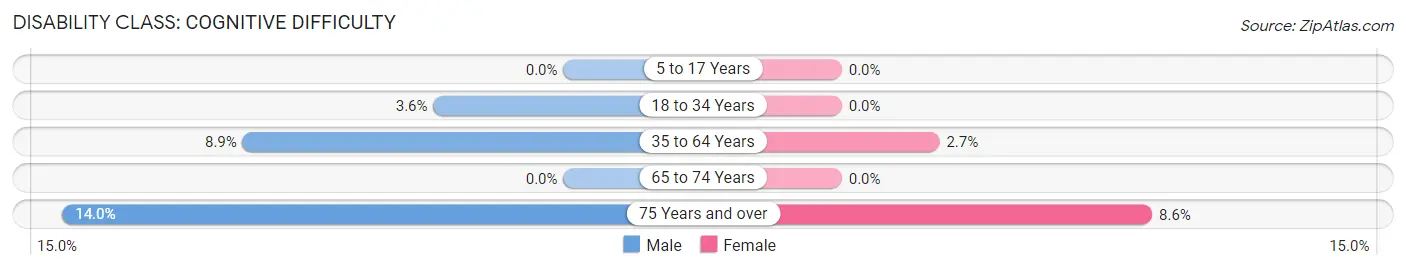
| Age Bracket | Male | Female |
| 5 to 17 Years | 0 (0.0%) | 0 (0.0%) |
| 18 to 34 Years | 22 (3.6%) | 0 (0.0%) |
| 35 to 64 Years | 120 (8.9%) | 34 (2.7%) |
| 65 to 74 Years | 0 (0.0%) | 0 (0.0%) |
| 75 Years and over | 36 (14.0%) | 28 (8.6%) |
Disability Class: Ambulatory Difficulty
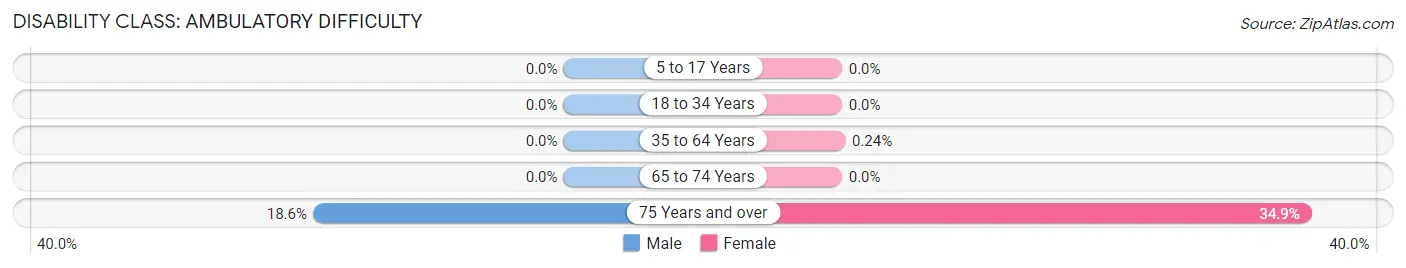
| Age Bracket | Male | Female |
| 5 to 17 Years | 0 (0.0%) | 0 (0.0%) |
| 18 to 34 Years | 0 (0.0%) | 0 (0.0%) |
| 35 to 64 Years | 0 (0.0%) | 3 (0.2%) |
| 65 to 74 Years | 0 (0.0%) | 0 (0.0%) |
| 75 Years and over | 48 (18.6%) | 113 (34.9%) |
Disability Class: Self-Care Difficulty
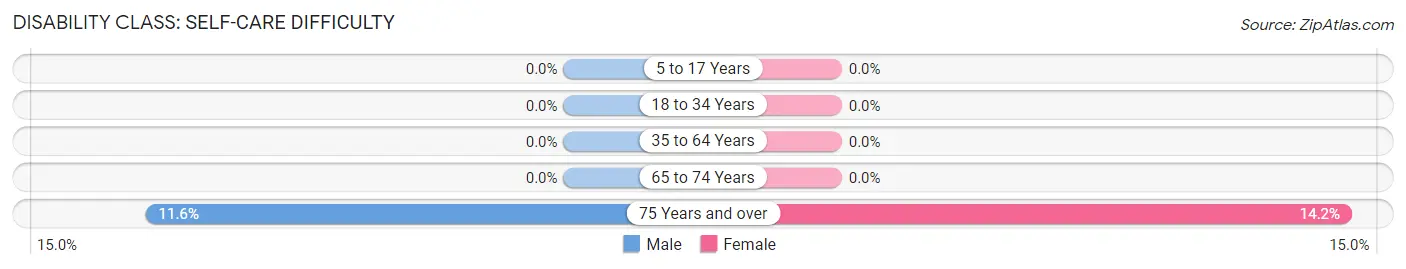
| Age Bracket | Male | Female |
| 5 to 17 Years | 0 (0.0%) | 0 (0.0%) |
| 18 to 34 Years | 0 (0.0%) | 0 (0.0%) |
| 35 to 64 Years | 0 (0.0%) | 0 (0.0%) |
| 65 to 74 Years | 0 (0.0%) | 0 (0.0%) |
| 75 Years and over | 30 (11.6%) | 46 (14.2%) |
Technology Access in Finderne
Computing Device Access in Finderne
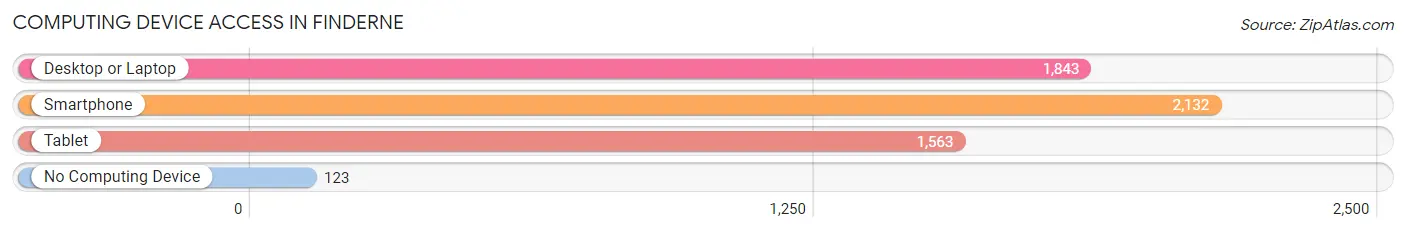
| Device Type | # Households | % Households |
| Desktop or Laptop | 1,843 | 77.3% |
| Smartphone | 2,132 | 89.4% |
| Tablet | 1,563 | 65.6% |
| No Computing Device | 123 | 5.2% |
| Total | 2,384 | 100.0% |
Internet Access in Finderne
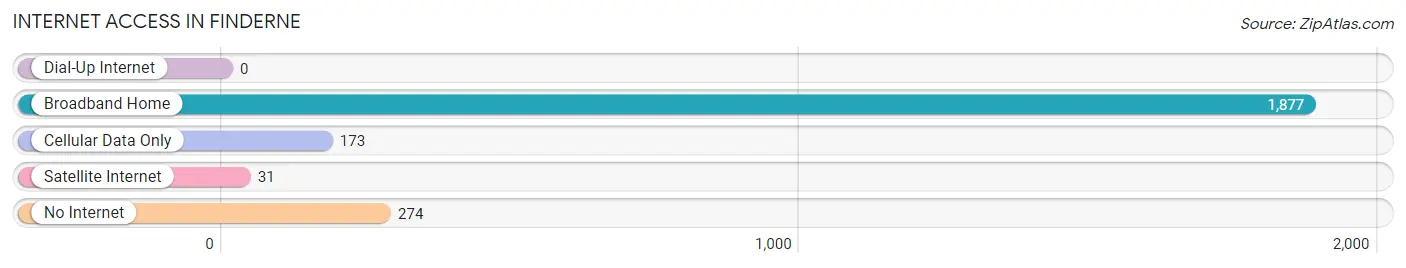
| Internet Type | # Households | % Households |
| Dial-Up Internet | 0 | 0.0% |
| Broadband Home | 1,877 | 78.7% |
| Cellular Data Only | 173 | 7.3% |
| Satellite Internet | 31 | 1.3% |
| No Internet | 274 | 11.5% |
| Total | 2,384 | 100.0% |
Finderne Summary
Finderne is a small unincorporated community located in Bridgewater Township, Somerset County, New Jersey. It is situated in the Raritan Valley region of Central New Jersey, approximately 25 miles southwest of Newark and 40 miles northwest of Atlantic City. The area is known for its rural charm and is home to a diverse population of approximately 2,000 people.
History
Finderne was first settled in the late 17th century by Dutch and German immigrants. The area was originally known as “Finderne”, which is derived from the Dutch word “finderen”, meaning “to search”. The area was primarily used for farming and was home to a number of small businesses, including a grist mill, a saw mill, and a blacksmith shop.
In the late 19th century, the area began to experience rapid growth due to the construction of the Central Railroad of New Jersey. This allowed for easy access to New York City and other major cities in the region. The area also experienced a population boom as a result of the influx of immigrants from Europe.
Geography
Finderne is located in the Raritan Valley region of Central New Jersey. It is situated in Bridgewater Township, Somerset County, approximately 25 miles southwest of Newark and 40 miles northwest of Atlantic City. The area is characterized by rolling hills and is home to a number of small streams and ponds.
The climate in Finderne is typical of the Northeastern United States, with cold winters and hot, humid summers. The average annual temperature is approximately 50 degrees Fahrenheit.
Economy
Finderne’s economy is primarily based on agriculture and small businesses. The area is home to a number of farms, which produce a variety of crops, including corn, soybeans, and hay. There are also a number of small businesses in the area, including restaurants, retail stores, and professional services.
Demographics
As of the 2010 census, Finderne had a population of 2,000 people. The racial makeup of the area was 87.5% White, 5.5% African American, 2.5% Asian, and 4.5% other. The median household income was $76,250, and the median age was 43.
Finderne is a diverse community, with a variety of religious and cultural backgrounds. The area is home to a number of churches, including Catholic, Protestant, and Jewish congregations. There are also a number of cultural organizations, such as the Finderne Historical Society and the Finderne Arts Council.
Conclusion
Finderne is a small unincorporated community located in Bridgewater Township, Somerset County, New Jersey. It is situated in the Raritan Valley region of Central New Jersey, approximately 25 miles southwest of Newark and 40 miles northwest of Atlantic City. The area is known for its rural charm and is home to a diverse population of approximately 2,000 people. The economy of Finderne is primarily based on agriculture and small businesses, and the area is home to a variety of religious and cultural backgrounds.
Common Questions
What is Per Capita Income in Finderne?
Per Capita income in Finderne is $48,486.
What is the Median Family Income in Finderne?
Median Family Income in Finderne is $101,838.
What is the Median Household income in Finderne?
Median Household Income in Finderne is $101,029.
What is Income or Wage Gap in Finderne?
Income or Wage Gap in Finderne is 8.1%.
Women in Finderne earn 91.9 cents for every dollar earned by a man.
What is Inequality or Gini Index in Finderne?
Inequality or Gini Index in Finderne is 0.36.
What is the Total Population of Finderne?
Total Population of Finderne is 5,881.
What is the Total Male Population of Finderne?
Total Male Population of Finderne is 2,853.
What is the Total Female Population of Finderne?
Total Female Population of Finderne is 3,028.
What is the Ratio of Males per 100 Females in Finderne?
There are 94.22 Males per 100 Females in Finderne.
What is the Ratio of Females per 100 Males in Finderne?
There are 106.13 Females per 100 Males in Finderne.
What is the Median Population Age in Finderne?
Median Population Age in Finderne is 41.9 Years.
What is the Average Family Size in Finderne
Average Family Size in Finderne is 3.0 People.
What is the Average Household Size in Finderne
Average Household Size in Finderne is 2.4 People.
How Large is the Labor Force in Finderne?
There are 3,259 People in the Labor Forcein in Finderne.
What is the Percentage of People in the Labor Force in Finderne?
63.1% of People are in the Labor Force in Finderne.
What is the Unemployment Rate in Finderne?
Unemployment Rate in Finderne is 5.0%.