Cities with the Lowest Poverty Level Among Single Males in New Jersey
RELATED REPORTS & OPTIONS
Lowest Poverty | Single Male
New Jersey
Compare Cities
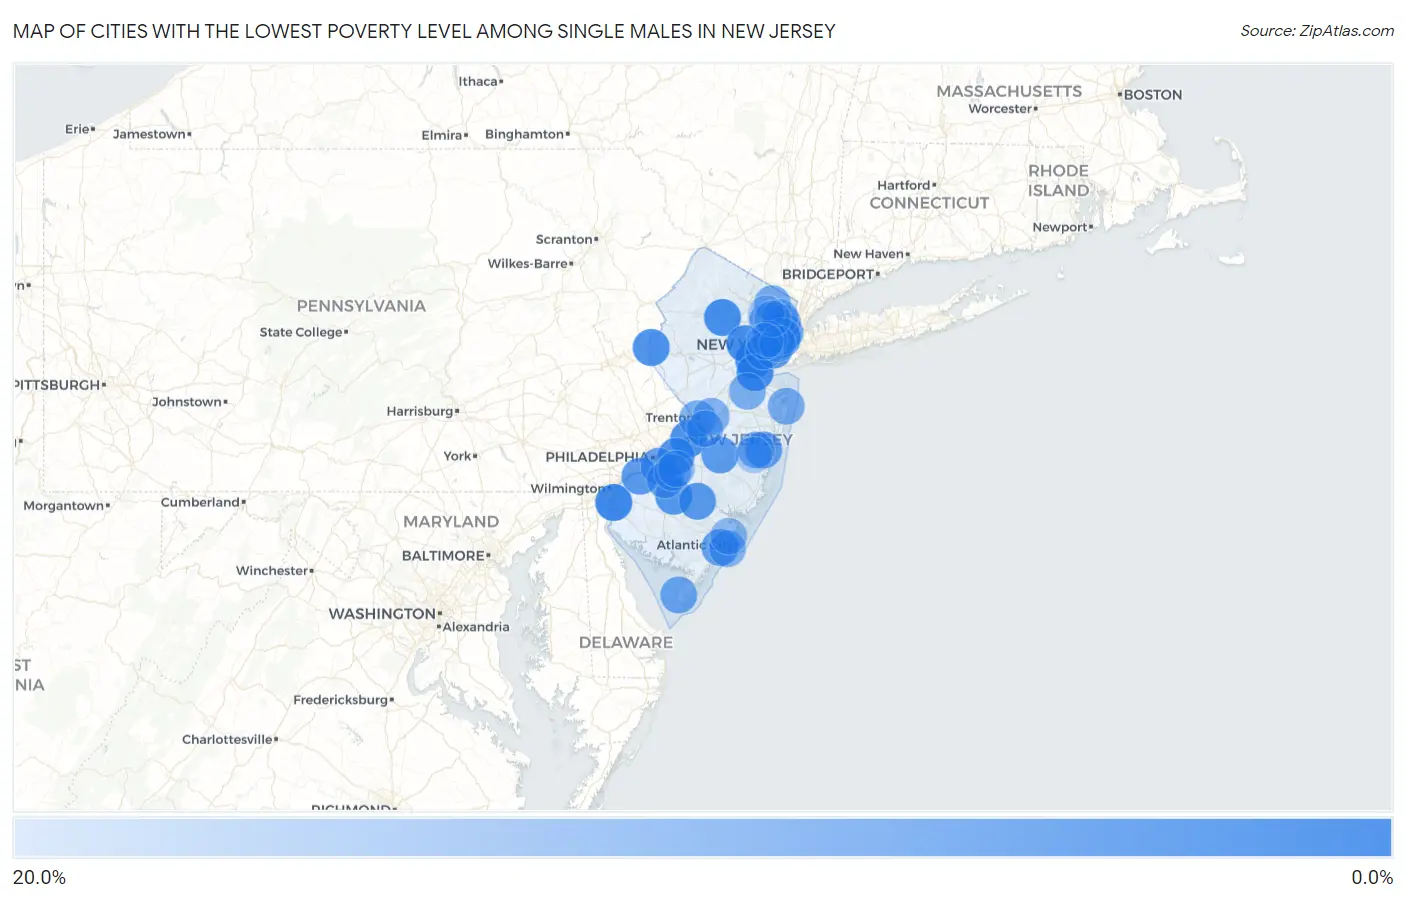
Map of Cities with the Lowest Poverty Level Among Single Males in New Jersey
20.0%
0.0%
Cities with the Lowest Poverty Level Among Single Males in New Jersey
| City | Single Male Poverty | vs State | vs National | |
| 1. | South River Borough | 0.25% | 10.1%(-9.81)#1 | 12.4%(-12.2)#2 |
| 2. | Roselle Borough | 0.67% | 10.1%(-9.39)#2 | 12.4%(-11.8)#17 |
| 3. | Pennsville | 1.2% | 10.1%(-8.82)#3 | 12.4%(-11.2)#61 |
| 4. | Audubon Borough | 1.5% | 10.1%(-8.57)#4 | 12.4%(-11.0)#100 |
| 5. | Rahway | 1.5% | 10.1%(-8.52)#5 | 12.4%(-10.9)#109 |
| 6. | Fort Lee Borough | 1.9% | 10.1%(-8.17)#6 | 12.4%(-10.5)#158 |
| 7. | Dover | 1.9% | 10.1%(-8.12)#7 | 12.4%(-10.5)#169 |
| 8. | Summit | 2.1% | 10.1%(-8.00)#8 | 12.4%(-10.4)#182 |
| 9. | Lindenwold Borough | 2.7% | 10.1%(-7.34)#9 | 12.4%(-9.72)#297 |
| 10. | Perth Amboy | 2.9% | 10.1%(-7.17)#10 | 12.4%(-9.55)#328 |
| 11. | Burlington | 2.9% | 10.1%(-7.15)#11 | 12.4%(-9.53)#339 |
| 12. | Sayreville Borough | 3.0% | 10.1%(-7.10)#12 | 12.4%(-9.48)#347 |
| 13. | Phillipsburg | 3.1% | 10.1%(-6.99)#13 | 12.4%(-9.37)#368 |
| 14. | Clayton Borough | 3.1% | 10.1%(-6.93)#14 | 12.4%(-9.31)#376 |
| 15. | Oakland Borough | 3.4% | 10.1%(-6.64)#15 | 12.4%(-9.02)#442 |
| 16. | Parsippany | 3.6% | 10.1%(-6.46)#16 | 12.4%(-8.85)#484 |
| 17. | Moorestown Lenola | 3.6% | 10.1%(-6.43)#17 | 12.4%(-8.81)#493 |
| 18. | Hoboken | 3.8% | 10.1%(-6.26)#18 | 12.4%(-8.64)#525 |
| 19. | Secaucus | 3.8% | 10.1%(-6.23)#19 | 12.4%(-8.61)#534 |
| 20. | Carteret Borough | 3.9% | 10.1%(-6.13)#20 | 12.4%(-8.51)#556 |
| 21. | Williamstown | 4.2% | 10.1%(-5.89)#21 | 12.4%(-8.27)#620 |
| 22. | Millstone Borough | 4.3% | 10.1%(-5.80)#22 | 12.4%(-8.18)#646 |
| 23. | Bernardsville Borough | 4.6% | 10.1%(-5.48)#23 | 12.4%(-7.86)#720 |
| 24. | Bayonne | 4.7% | 10.1%(-5.33)#24 | 12.4%(-7.71)#767 |
| 25. | Hammonton | 4.9% | 10.1%(-5.18)#25 | 12.4%(-7.57)#796 |
| 26. | Gibbstown | 5.0% | 10.1%(-5.09)#26 | 12.4%(-7.47)#824 |
| 27. | Browns Mills | 5.2% | 10.1%(-4.84)#27 | 12.4%(-7.22)#888 |
| 28. | Bergenfield Borough | 5.3% | 10.1%(-4.80)#28 | 12.4%(-7.18)#898 |
| 29. | New Milford Borough | 5.4% | 10.1%(-4.65)#29 | 12.4%(-7.03)#936 |
| 30. | Leonia Borough | 5.7% | 10.1%(-4.38)#30 | 12.4%(-6.77)#1,004 |
| 31. | Manville Borough | 5.7% | 10.1%(-4.34)#31 | 12.4%(-6.72)#1,015 |
| 32. | Gloucester City | 5.8% | 10.1%(-4.21)#32 | 12.4%(-6.59)#1,045 |
| 33. | Woodland Park Borough | 6.0% | 10.1%(-4.02)#33 | 12.4%(-6.40)#1,102 |
| 34. | Linwood | 6.1% | 10.1%(-3.96)#34 | 12.4%(-6.34)#1,118 |
| 35. | Stanhope Borough | 6.3% | 10.1%(-3.73)#35 | 12.4%(-6.11)#1,181 |
| 36. | Fairview Borough | 6.3% | 10.1%(-3.72)#36 | 12.4%(-6.10)#1,185 |
| 37. | Toms River | 6.4% | 10.1%(-3.66)#37 | 12.4%(-6.04)#1,200 |
| 38. | Pompton Lakes Borough | 6.5% | 10.1%(-3.59)#38 | 12.4%(-5.97)#1,215 |
| 39. | Palisades Park Borough | 6.5% | 10.1%(-3.54)#39 | 12.4%(-5.92)#1,225 |
| 40. | Audubon Park Borough | 7.1% | 10.1%(-2.91)#40 | 12.4%(-5.29)#1,421 |
| 41. | North Plainfield Borough | 7.2% | 10.1%(-2.89)#41 | 12.4%(-5.27)#1,435 |
| 42. | Villas | 7.3% | 10.1%(-2.71)#42 | 12.4%(-5.09)#1,482 |
| 43. | Haledon Borough | 7.5% | 10.1%(-2.57)#43 | 12.4%(-4.95)#1,513 |
| 44. | Gouldtown | 7.5% | 10.1%(-2.55)#44 | 12.4%(-4.94)#1,522 |
| 45. | Kearny | 7.6% | 10.1%(-2.46)#45 | 12.4%(-4.84)#1,549 |
| 46. | West New York | 7.7% | 10.1%(-2.37)#46 | 12.4%(-4.75)#1,577 |
| 47. | Blackwood | 8.0% | 10.1%(-2.05)#47 | 12.4%(-4.44)#1,683 |
| 48. | Clifton | 8.4% | 10.1%(-1.70)#48 | 12.4%(-4.08)#1,817 |
| 49. | Fair Lawn Borough | 8.8% | 10.1%(-1.28)#49 | 12.4%(-3.66)#1,921 |
| 50. | Long Branch | 8.8% | 10.1%(-1.24)#50 | 12.4%(-3.62)#1,931 |
| 51. | Lakehurst Borough | 8.8% | 10.1%(-1.23)#51 | 12.4%(-3.61)#1,937 |
| 52. | Ridgewood | 8.9% | 10.1%(-1.19)#52 | 12.4%(-3.57)#1,947 |
| 53. | Pine Lake Park | 8.9% | 10.1%(-1.19)#53 | 12.4%(-3.57)#1,948 |
| 54. | Hillsborough | 8.9% | 10.1%(-1.17)#54 | 12.4%(-3.55)#1,950 |
| 55. | Hawthorne Borough | 9.2% | 10.1%(-0.863)#55 | 12.4%(-3.24)#2,059 |
| 56. | Pine Hill Borough | 9.3% | 10.1%(-0.795)#56 | 12.4%(-3.18)#2,074 |
| 57. | Allentown Borough | 9.4% | 10.1%(-0.680)#57 | 12.4%(-3.06)#2,101 |
| 58. | Trenton | 9.4% | 10.1%(-0.676)#58 | 12.4%(-3.06)#2,108 |
| 59. | Upper Saddle River Borough | 9.4% | 10.1%(-0.643)#59 | 12.4%(-3.02)#2,115 |
| 60. | Ridgefield Park | 9.5% | 10.1%(-0.602)#60 | 12.4%(-2.98)#2,120 |
| 61. | Old Bridge | 9.5% | 10.1%(-0.572)#61 | 12.4%(-2.95)#2,128 |
| 62. | Point Pleasant Borough | 9.8% | 10.1%(-0.292)#62 | 12.4%(-2.67)#2,211 |
| 63. | Ringwood Borough | 9.9% | 10.1%(-0.131)#63 | 12.4%(-2.51)#2,250 |
| 64. | Edgewater Borough | 10.0% | 10.1%(-0.093)#64 | 12.4%(-2.47)#2,256 |
| 65. | National Park Borough | 10.0% | 10.1%(-0.055)#65 | 12.4%(-2.44)#2,277 |
| 66. | Freehold Borough | 10.1% | 10.1%(-0.002)#66 | 12.4%(-2.38)#2,330 |
| 67. | Chesilhurst Borough | 10.3% | 10.1%(+0.202)#67 | 12.4%(-2.18)#2,381 |
| 68. | Echelon | 10.4% | 10.1%(+0.304)#68 | 12.4%(-2.08)#2,414 |
| 69. | Hamilton Square | 10.4% | 10.1%(+0.341)#69 | 12.4%(-2.04)#2,424 |
| 70. | Margate City | 10.5% | 10.1%(+0.410)#70 | 12.4%(-1.97)#2,437 |
| 71. | Bordentown | 10.7% | 10.1%(+0.625)#71 | 12.4%(-1.76)#2,493 |
| 72. | Runnemede Borough | 10.8% | 10.1%(+0.745)#72 | 12.4%(-1.64)#2,528 |
| 73. | Palmyra Borough | 10.9% | 10.1%(+0.843)#73 | 12.4%(-1.54)#2,558 |
| 74. | Hackensack | 11.2% | 10.1%(+1.12)#74 | 12.4%(-1.26)#2,682 |
| 75. | South Bound Brook Borough | 11.3% | 10.1%(+1.20)#75 | 12.4%(-1.19)#2,698 |
| 76. | Rutherford Borough | 11.6% | 10.1%(+1.54)#76 | 12.4%(-0.841)#2,795 |
| 77. | Wallington Borough | 11.6% | 10.1%(+1.57)#77 | 12.4%(-0.807)#2,804 |
| 78. | Union City | 11.9% | 10.1%(+1.87)#78 | 12.4%(-0.506)#2,902 |
| 79. | Absecon | 12.0% | 10.1%(+1.99)#79 | 12.4%(-0.387)#2,932 |
| 80. | Springdale | 12.1% | 10.1%(+2.07)#80 | 12.4%(-0.314)#2,948 |
| 81. | Helmetta Borough | 12.2% | 10.1%(+2.14)#81 | 12.4%(-0.240)#2,968 |
| 82. | Roselle Park Borough | 13.1% | 10.1%(+3.06)#82 | 12.4%(+0.679)#3,240 |
| 83. | Stratford Borough | 13.2% | 10.1%(+3.19)#83 | 12.4%(+0.810)#3,270 |
| 84. | Highland Park Borough | 13.6% | 10.1%(+3.57)#84 | 12.4%(+1.19)#3,366 |
| 85. | Elizabeth | 13.8% | 10.1%(+3.77)#85 | 12.4%(+1.39)#3,418 |
| 86. | Hasbrouck Heights Borough | 14.5% | 10.1%(+4.48)#86 | 12.4%(+2.10)#3,626 |
| 87. | Woodlynne Borough | 14.9% | 10.1%(+4.81)#87 | 12.4%(+2.43)#3,698 |
| 88. | Harrison | 14.9% | 10.1%(+4.84)#88 | 12.4%(+2.46)#3,705 |
| 89. | Paterson | 15.1% | 10.1%(+5.08)#89 | 12.4%(+2.70)#3,748 |
| 90. | Jersey City | 15.1% | 10.1%(+5.08)#90 | 12.4%(+2.70)#3,750 |
| 91. | Lake Hopatcong | 15.7% | 10.1%(+5.61)#91 | 12.4%(+3.23)#3,907 |
| 92. | Garfield | 15.8% | 10.1%(+5.73)#92 | 12.4%(+3.35)#3,930 |
| 93. | Lake Como Borough | 15.8% | 10.1%(+5.73)#93 | 12.4%(+3.35)#3,939 |
| 94. | Holiday City Berkeley | 15.8% | 10.1%(+5.79)#94 | 12.4%(+3.41)#3,964 |
| 95. | Keyport Borough | 15.8% | 10.1%(+5.79)#95 | 12.4%(+3.41)#3,965 |
| 96. | Newark | 16.5% | 10.1%(+6.48)#96 | 12.4%(+4.09)#4,110 |
| 97. | Neptune City Borough | 16.7% | 10.1%(+6.61)#97 | 12.4%(+4.23)#4,130 |
| 98. | Florham Park Borough | 16.8% | 10.1%(+6.75)#98 | 12.4%(+4.37)#4,231 |
| 99. | Penns Grove Borough | 17.3% | 10.1%(+7.25)#99 | 12.4%(+4.87)#4,331 |
| 100. | Newfield Borough | 17.5% | 10.1%(+7.45)#100 | 12.4%(+5.06)#4,363 |
Common Questions
What are the Top 10 Cities with the Lowest Poverty Level Among Single Males in New Jersey?
Top 10 Cities with the Lowest Poverty Level Among Single Males in New Jersey are:
#1
1.2%
#2
1.5%
#3
1.9%
#4
2.1%
#5
2.9%
#6
2.9%
#7
3.1%
#8
3.6%
#9
3.8%
#10
3.8%
What city has the Lowest Poverty Level Among Single Males in New Jersey?
Pennsville has the Lowest Poverty Level Among Single Males in New Jersey with 1.2%.
What is the Poverty Level Among Single Males in the State of New Jersey?
Poverty Level Among Single Males in New Jersey is 10.1%.
What is the Poverty Level Among Single Males in the United States?
Poverty Level Among Single Males in the United States is 12.4%.