Milltown borough, NJ Map & Demographics
Milltown borough Overview
$50,395
PER CAPITA INCOME
$137,631
AVG FAMILY INCOME
$125,043
AVG HOUSEHOLD INCOME
27.6%
WAGE / INCOME GAP [ % ]
72.4¢/ $1
WAGE / INCOME GAP [ $ ]
0.34
INEQUALITY / GINI INDEX
7,017
TOTAL POPULATION
3,267
MALE POPULATION
3,750
FEMALE POPULATION
87.12
MALES / 100 FEMALES
114.78
FEMALES / 100 MALES
41.5
MEDIAN AGE
3.2
AVG FAMILY SIZE
2.8
AVG HOUSEHOLD SIZE
4,159
LABOR FORCE [ PEOPLE ]
74.7%
PERCENT IN LABOR FORCE
4.9%
UNEMPLOYMENT RATE
Income in Milltown borough
Income Overview in Milltown borough
Per Capita Income in Milltown borough is $50,395, while median incomes of families and households are $137,631 and $125,043 respectively.
| Characteristic | Number | Measure |
| Per Capita Income | 7,017 | $50,395 |
| Median Family Income | 1,913 | $137,631 |
| Mean Family Income | 1,913 | $147,836 |
| Median Household Income | 2,496 | $125,043 |
| Mean Household Income | 2,496 | $135,587 |
| Income Deficit | 1,913 | $0 |
| Wage / Income Gap (%) | 7,017 | 27.60% |
| Wage / Income Gap ($) | 7,017 | 72.40¢ per $1 |
| Gini / Inequality Index | 7,017 | 0.34 |
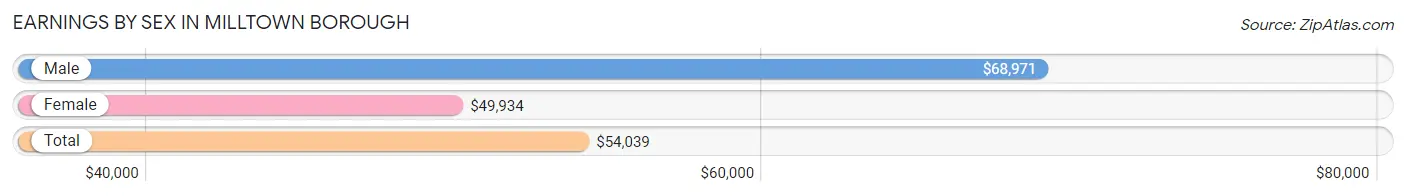
Earnings by Sex in Milltown borough
Average Earnings in Milltown borough are $54,039, $68,971 for men and $49,934 for women, a difference of 27.6%.
| Sex | Number | Average Earnings |
| Male | 1,940 (45.1%) | $68,971 |
| Female | 2,361 (54.9%) | $49,934 |
| Total | 4,301 (100.0%) | $54,039 |
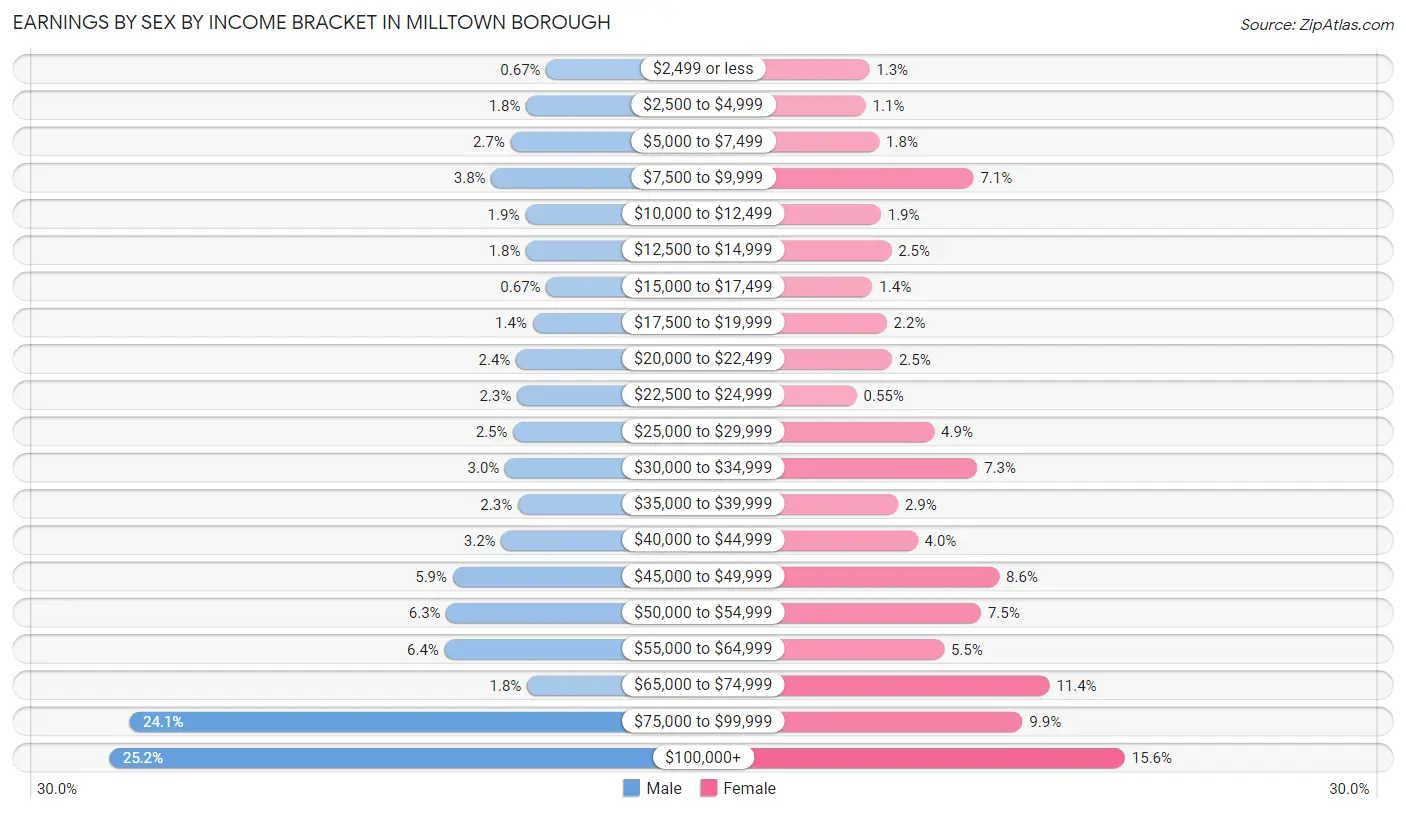
Earnings by Sex by Income Bracket in Milltown borough
The most common earnings brackets in Milltown borough are $100,000+ for men (489 | 25.2%) and $100,000+ for women (369 | 15.6%).
| Income | Male | Female |
| $2,499 or less | 13 (0.7%) | 30 (1.3%) |
| $2,500 to $4,999 | 35 (1.8%) | 25 (1.1%) |
| $5,000 to $7,499 | 52 (2.7%) | 43 (1.8%) |
| $7,500 to $9,999 | 73 (3.8%) | 168 (7.1%) |
| $10,000 to $12,499 | 36 (1.9%) | 45 (1.9%) |
| $12,500 to $14,999 | 35 (1.8%) | 59 (2.5%) |
| $15,000 to $17,499 | 13 (0.7%) | 34 (1.4%) |
| $17,500 to $19,999 | 28 (1.4%) | 53 (2.2%) |
| $20,000 to $22,499 | 46 (2.4%) | 60 (2.5%) |
| $22,500 to $24,999 | 45 (2.3%) | 13 (0.5%) |
| $25,000 to $29,999 | 49 (2.5%) | 116 (4.9%) |
| $30,000 to $34,999 | 58 (3.0%) | 173 (7.3%) |
| $35,000 to $39,999 | 44 (2.3%) | 68 (2.9%) |
| $40,000 to $44,999 | 62 (3.2%) | 94 (4.0%) |
| $45,000 to $49,999 | 115 (5.9%) | 202 (8.6%) |
| $50,000 to $54,999 | 122 (6.3%) | 178 (7.5%) |
| $55,000 to $64,999 | 124 (6.4%) | 129 (5.5%) |
| $65,000 to $74,999 | 34 (1.8%) | 269 (11.4%) |
| $75,000 to $99,999 | 467 (24.1%) | 233 (9.9%) |
| $100,000+ | 489 (25.2%) | 369 (15.6%) |
| Total | 1,940 (100.0%) | 2,361 (100.0%) |
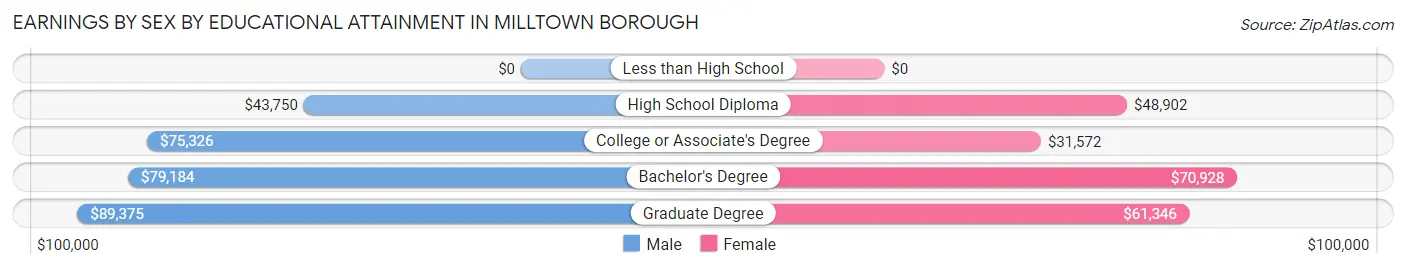
Earnings by Sex by Educational Attainment in Milltown borough
Average earnings in Milltown borough are $77,704 for men and $50,856 for women, a difference of 34.5%. Men with an educational attainment of graduate degree enjoy the highest average annual earnings of $89,375, while those with high school diploma education earn the least with $43,750. Women with an educational attainment of bachelor's degree earn the most with the average annual earnings of $70,928, while those with college or associate's degree education have the smallest earnings of $31,572.
| Educational Attainment | Male Income | Female Income |
| Less than High School | - | - |
| High School Diploma | $43,750 | $48,902 |
| College or Associate's Degree | $75,326 | $31,572 |
| Bachelor's Degree | $79,184 | $70,928 |
| Graduate Degree | $89,375 | $61,346 |
| Total | $77,704 | $50,856 |
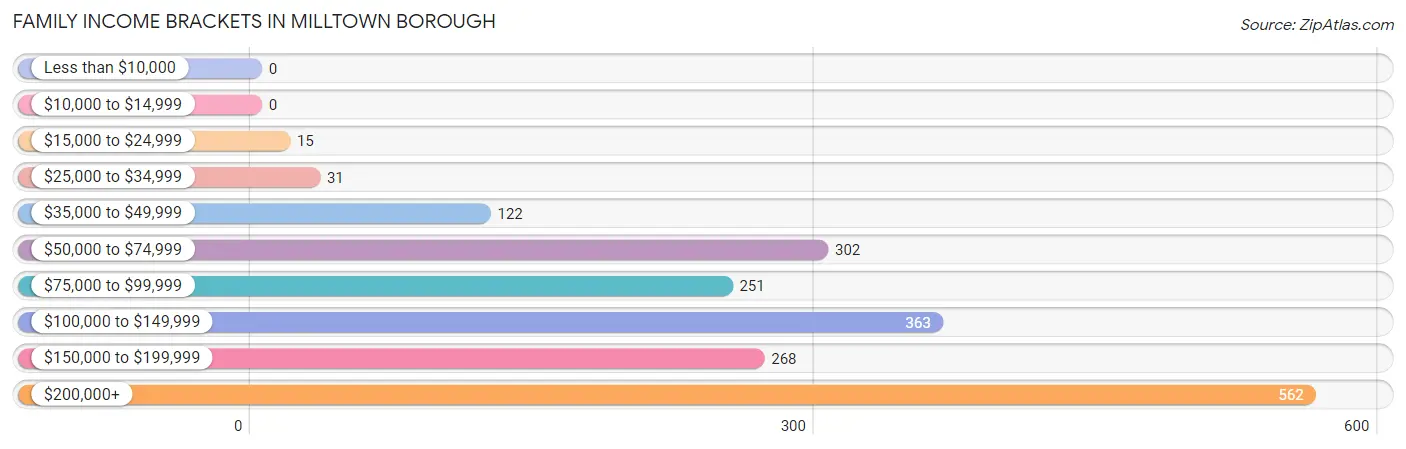
Family Income in Milltown borough
Family Income Brackets in Milltown borough
According to the Milltown borough family income data, there are 562 families falling into the $200,000+ income range, which is the most common income bracket and makes up 29.4% of all families.
| Income Bracket | # Families | % Families |
| Less than $10,000 | 0 | 0.0% |
| $10,000 to $14,999 | 0 | 0.0% |
| $15,000 to $24,999 | 15 | 0.8% |
| $25,000 to $34,999 | 31 | 1.6% |
| $35,000 to $49,999 | 122 | 6.4% |
| $50,000 to $74,999 | 302 | 15.8% |
| $75,000 to $99,999 | 251 | 13.1% |
| $100,000 to $149,999 | 363 | 19.0% |
| $150,000 to $199,999 | 268 | 14.0% |
| $200,000+ | 562 | 29.4% |
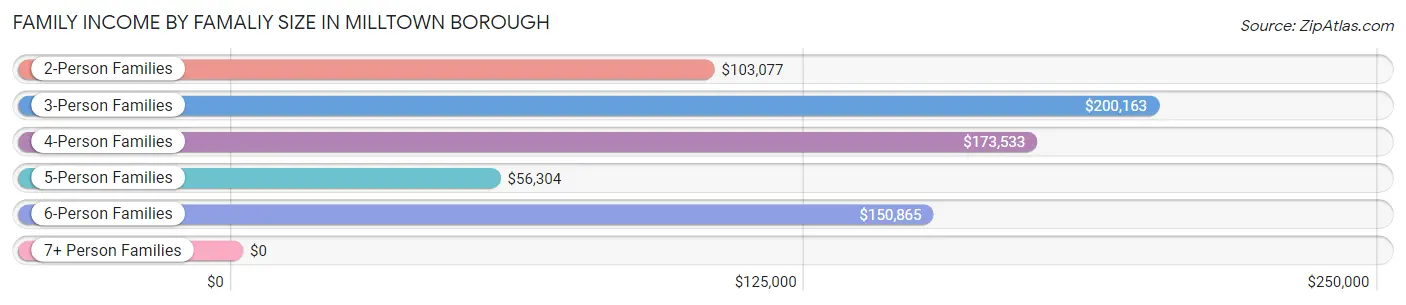
Family Income by Famaliy Size in Milltown borough
3-person families (442 | 23.1%) account for the highest median family income in Milltown borough with $200,163 per family, while 3-person families (442 | 23.1%) have the highest median income of $66,721 per family member.
| Income Bracket | # Families | Median Income |
| 2-Person Families | 764 (39.9%) | $103,077 |
| 3-Person Families | 442 (23.1%) | $200,163 |
| 4-Person Families | 345 (18.0%) | $173,533 |
| 5-Person Families | 263 (13.8%) | $56,304 |
| 6-Person Families | 75 (3.9%) | $150,865 |
| 7+ Person Families | 24 (1.3%) | $0 |
| Total | 1,913 (100.0%) | $137,631 |
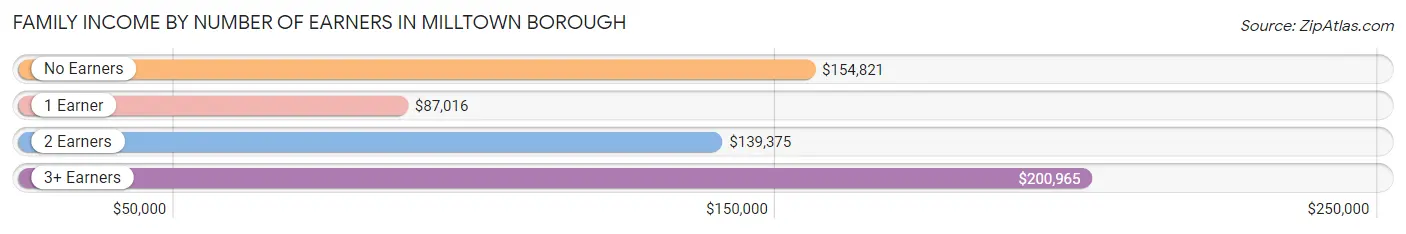
Family Income by Number of Earners in Milltown borough
The median family income in Milltown borough is $137,631, with families comprising 3+ earners (369) having the highest median family income of $200,965, while families with 1 earner (564) have the lowest median family income of $87,016, accounting for 19.3% and 29.5% of families, respectively.
| Number of Earners | # Families | Median Income |
| No Earners | 66 (3.5%) | $154,821 |
| 1 Earner | 564 (29.5%) | $87,016 |
| 2 Earners | 914 (47.8%) | $139,375 |
| 3+ Earners | 369 (19.3%) | $200,965 |
| Total | 1,913 (100.0%) | $137,631 |
Household Income in Milltown borough
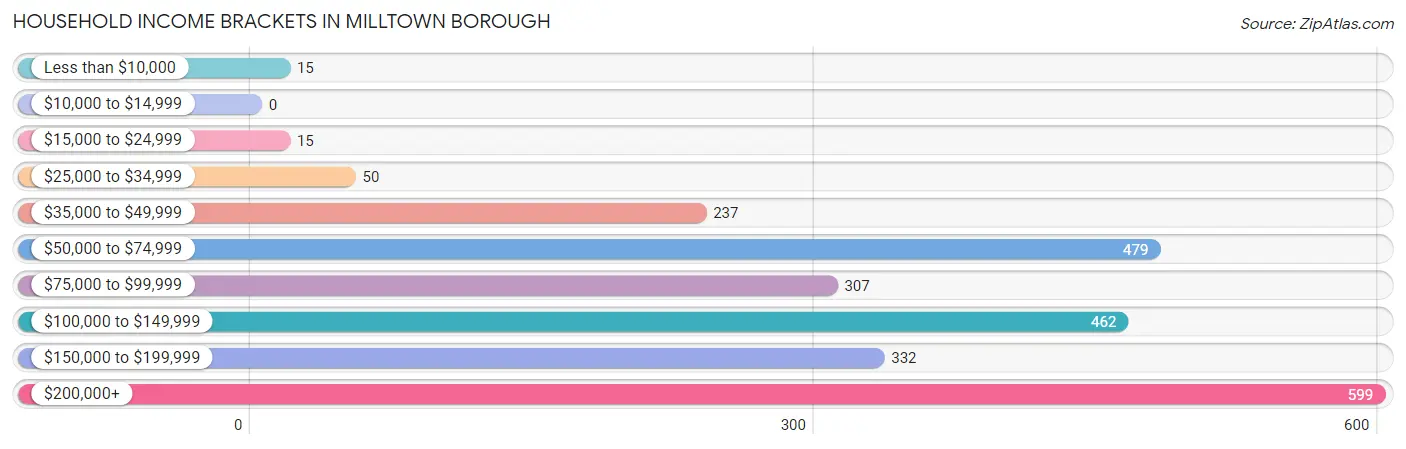
Household Income Brackets in Milltown borough
With 599 households falling in the category, the $200,000+ income range is the most frequent in Milltown borough, accounting for 24.0% of all households.
| Income Bracket | # Households | % Households |
| Less than $10,000 | 15 | 0.6% |
| $10,000 to $14,999 | 0 | 0.0% |
| $15,000 to $24,999 | 15 | 0.6% |
| $25,000 to $34,999 | 50 | 2.0% |
| $35,000 to $49,999 | 237 | 9.5% |
| $50,000 to $74,999 | 479 | 19.2% |
| $75,000 to $99,999 | 307 | 12.3% |
| $100,000 to $149,999 | 462 | 18.5% |
| $150,000 to $199,999 | 332 | 13.3% |
| $200,000+ | 599 | 24.0% |
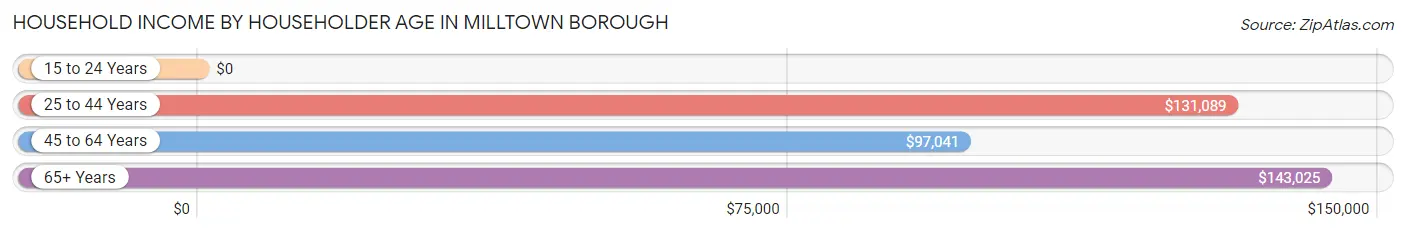
Household Income by Householder Age in Milltown borough
The median household income in Milltown borough is $125,043, with the highest median household income of $143,025 found in the 65+ years age bracket for the primary householder. A total of 477 households (19.1%) fall into this category.
| Income Bracket | # Households | Median Income |
| 15 to 24 Years | 0 (0.0%) | $0 |
| 25 to 44 Years | 710 (28.4%) | $131,089 |
| 45 to 64 Years | 1,309 (52.4%) | $97,041 |
| 65+ Years | 477 (19.1%) | $143,025 |
| Total | 2,496 (100.0%) | $125,043 |
Poverty in Milltown borough
Income Below Poverty by Sex and Age in Milltown borough
With 1.8% poverty level for males and 0.6% for females among the residents of Milltown borough, 55 to 64 year old males and 75 year old and over females are the most vulnerable to poverty, with 28 males (7.2%) and 7 females (3.3%) in their respective age groups living below the poverty level.
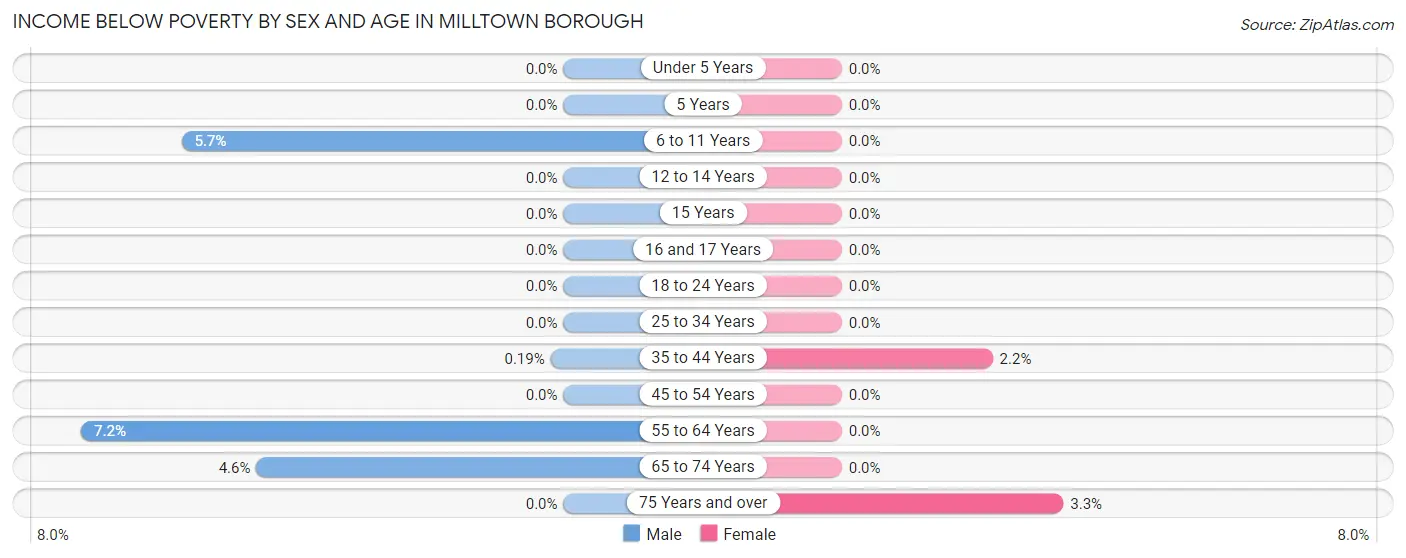
| Age Bracket | Male | Female |
| Under 5 Years | 0 (0.0%) | 0 (0.0%) |
| 5 Years | 0 (0.0%) | 0 (0.0%) |
| 6 to 11 Years | 14 (5.7%) | 0 (0.0%) |
| 12 to 14 Years | 0 (0.0%) | 0 (0.0%) |
| 15 Years | 0 (0.0%) | 0 (0.0%) |
| 16 and 17 Years | 0 (0.0%) | 0 (0.0%) |
| 18 to 24 Years | 0 (0.0%) | 0 (0.0%) |
| 25 to 34 Years | 0 (0.0%) | 0 (0.0%) |
| 35 to 44 Years | 1 (0.2%) | 14 (2.2%) |
| 45 to 54 Years | 0 (0.0%) | 0 (0.0%) |
| 55 to 64 Years | 28 (7.2%) | 0 (0.0%) |
| 65 to 74 Years | 15 (4.6%) | 0 (0.0%) |
| 75 Years and over | 0 (0.0%) | 7 (3.3%) |
| Total | 58 (1.8%) | 21 (0.6%) |
Income Above Poverty by Sex and Age in Milltown borough
According to the poverty statistics in Milltown borough, males aged under 5 years and females aged under 5 years are the age groups that are most secure financially, with 100.0% of males and 100.0% of females in these age groups living above the poverty line.
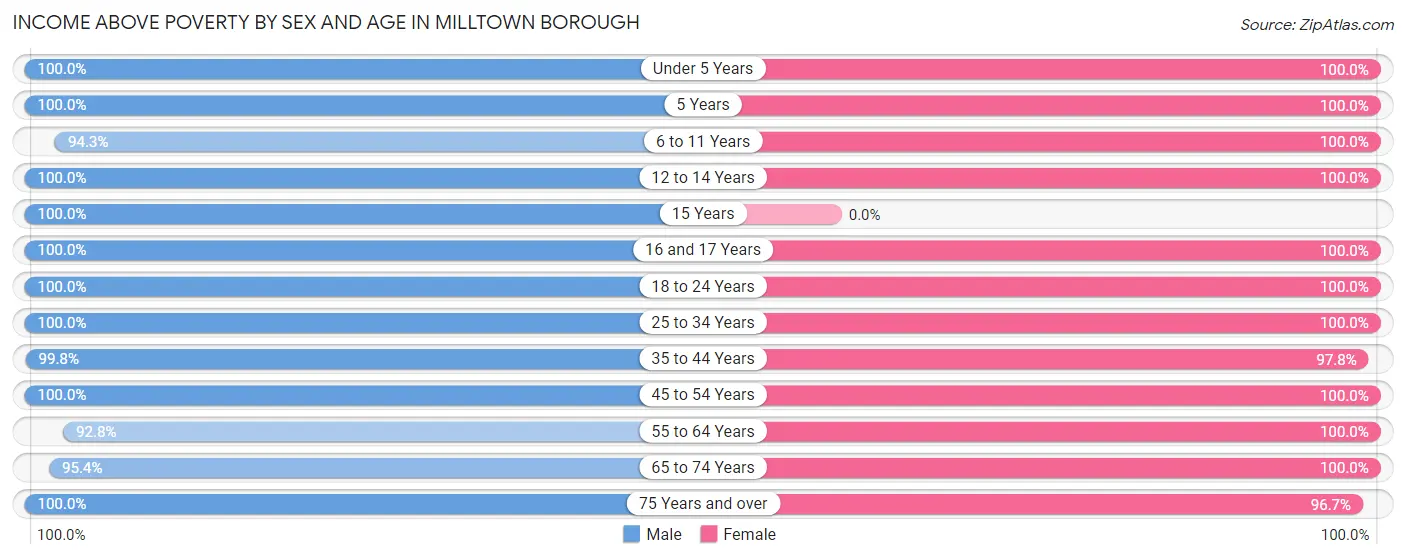
| Age Bracket | Male | Female |
| Under 5 Years | 388 (100.0%) | 186 (100.0%) |
| 5 Years | 44 (100.0%) | 48 (100.0%) |
| 6 to 11 Years | 233 (94.3%) | 207 (100.0%) |
| 12 to 14 Years | 85 (100.0%) | 234 (100.0%) |
| 15 Years | 10 (100.0%) | 0 (0.0%) |
| 16 and 17 Years | 173 (100.0%) | 59 (100.0%) |
| 18 to 24 Years | 128 (100.0%) | 157 (100.0%) |
| 25 to 34 Years | 389 (100.0%) | 434 (100.0%) |
| 35 to 44 Years | 531 (99.8%) | 610 (97.8%) |
| 45 to 54 Years | 444 (100.0%) | 417 (100.0%) |
| 55 to 64 Years | 363 (92.8%) | 936 (100.0%) |
| 65 to 74 Years | 314 (95.4%) | 235 (100.0%) |
| 75 Years and over | 107 (100.0%) | 206 (96.7%) |
| Total | 3,209 (98.2%) | 3,729 (99.4%) |
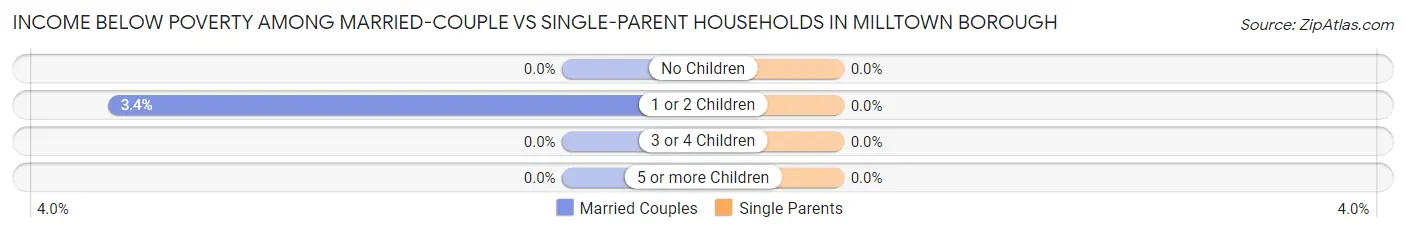
Income Below Poverty Among Married-Couple Families in Milltown borough
The poverty statistics for married-couple families in Milltown borough show that 1.1% or 15 of the total 1,399 families live below the poverty line. Families with 1 or 2 children have the highest poverty rate of 3.4%, comprising of 15 families. On the other hand, families with no children have the lowest poverty rate of 0.0%, which includes 0 families.
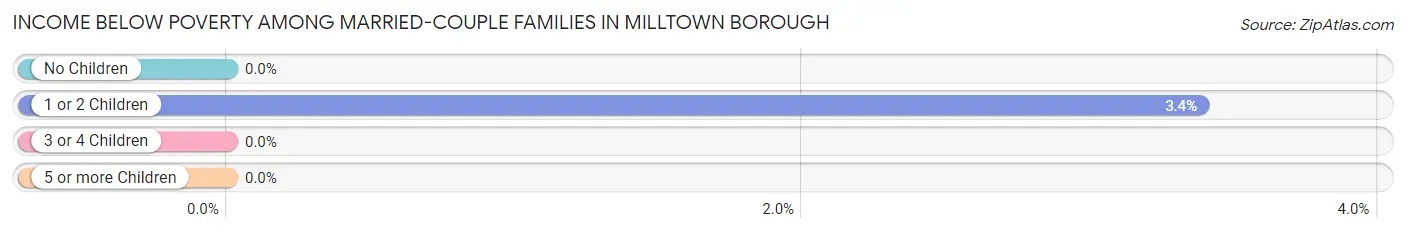
| Children | Above Poverty | Below Poverty |
| No Children | 700 (100.0%) | 0 (0.0%) |
| 1 or 2 Children | 429 (96.6%) | 15 (3.4%) |
| 3 or 4 Children | 255 (100.0%) | 0 (0.0%) |
| 5 or more Children | 0 (0.0%) | 0 (0.0%) |
| Total | 1,384 (98.9%) | 15 (1.1%) |
Income Below Poverty Among Single-Parent Households in Milltown borough
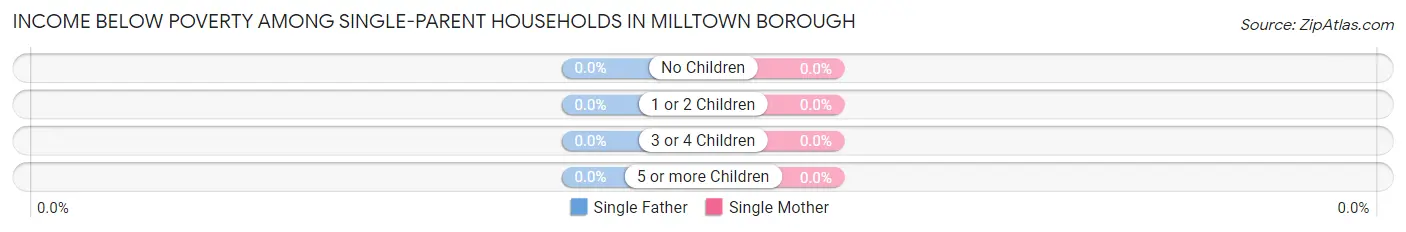
| Children | Single Father | Single Mother |
| No Children | 0 (0.0%) | 0 (0.0%) |
| 1 or 2 Children | 0 (0.0%) | 0 (0.0%) |
| 3 or 4 Children | 0 (0.0%) | 0 (0.0%) |
| 5 or more Children | 0 (0.0%) | 0 (0.0%) |
| Total | 0 (0.0%) | 0 (0.0%) |
Income Below Poverty Among Married-Couple vs Single-Parent Households in Milltown borough
| Children | Married-Couple Families | Single-Parent Households |
| No Children | 0 (0.0%) | 0 (0.0%) |
| 1 or 2 Children | 15 (3.4%) | 0 (0.0%) |
| 3 or 4 Children | 0 (0.0%) | 0 (0.0%) |
| 5 or more Children | 0 (0.0%) | 0 (0.0%) |
| Total | 15 (1.1%) | 0 (0.0%) |
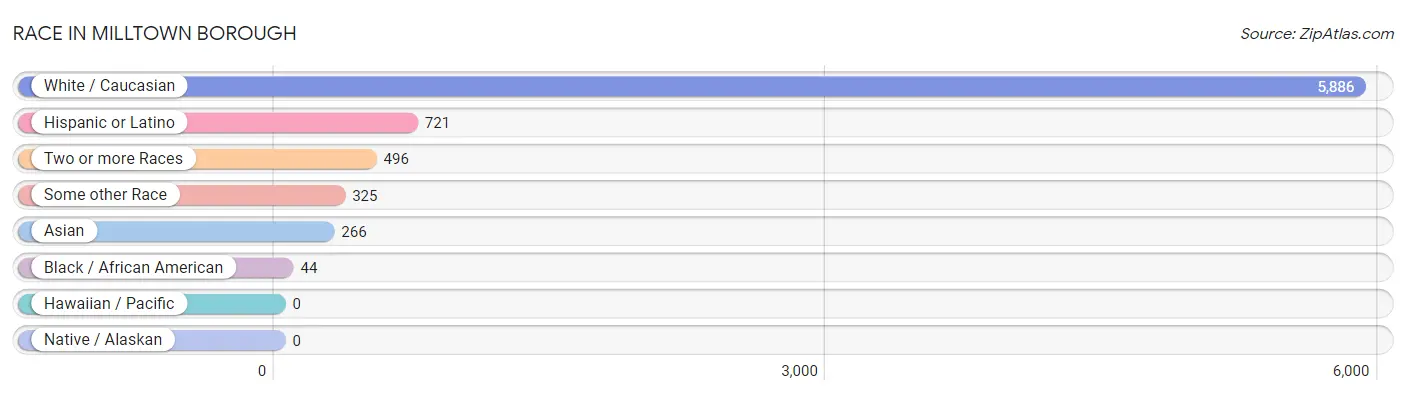
Race in Milltown borough
The most populous races in Milltown borough are White / Caucasian (5,886 | 83.9%), Hispanic or Latino (721 | 10.3%), and Two or more Races (496 | 7.1%).
| Race | # Population | % Population |
| Asian | 266 | 3.8% |
| Black / African American | 44 | 0.6% |
| Hawaiian / Pacific | 0 | 0.0% |
| Hispanic or Latino | 721 | 10.3% |
| Native / Alaskan | 0 | 0.0% |
| White / Caucasian | 5,886 | 83.9% |
| Two or more Races | 496 | 7.1% |
| Some other Race | 325 | 4.6% |
| Total | 7,017 | 100.0% |
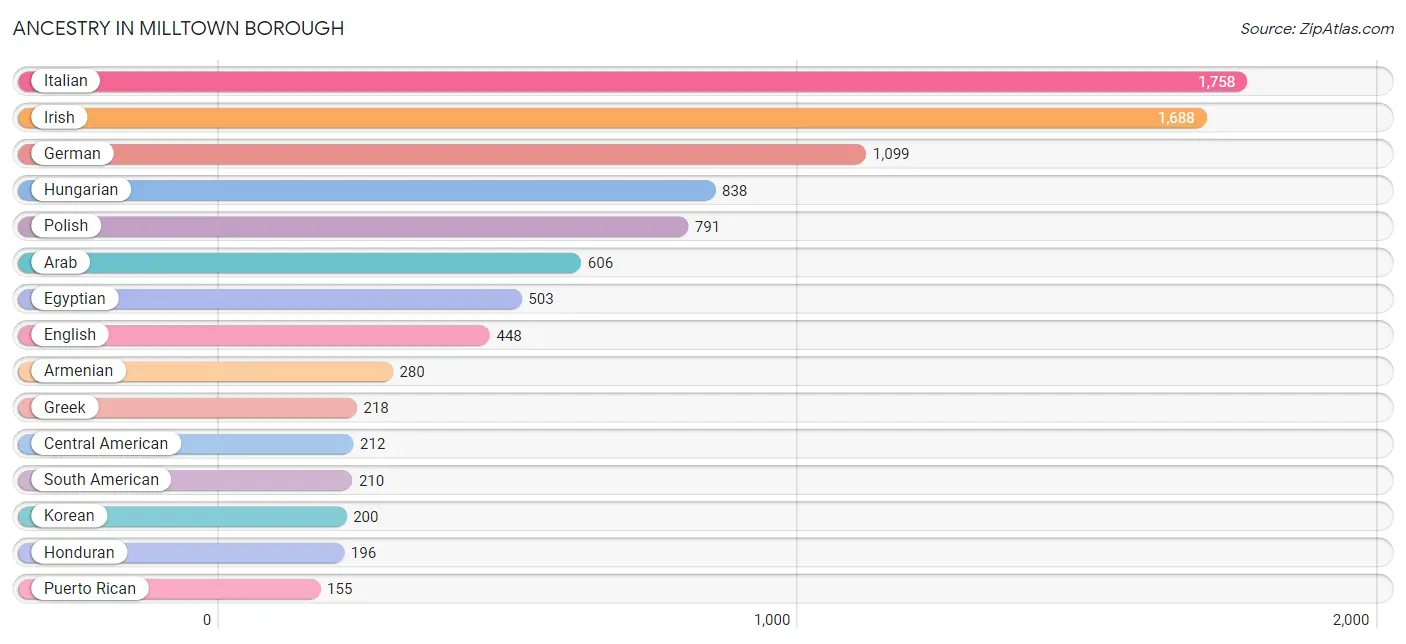
Ancestry in Milltown borough
The most populous ancestries reported in Milltown borough are Italian (1,758 | 25.1%), Irish (1,688 | 24.1%), German (1,099 | 15.7%), Hungarian (838 | 11.9%), and Polish (791 | 11.3%), together accounting for 88.0% of all Milltown borough residents.
| Ancestry | # Population | % Population |
| American | 83 | 1.2% |
| Arab | 606 | 8.6% |
| Armenian | 280 | 4.0% |
| Austrian | 16 | 0.2% |
| Belgian | 30 | 0.4% |
| Brazilian | 44 | 0.6% |
| British | 14 | 0.2% |
| Bulgarian | 10 | 0.1% |
| Burmese | 21 | 0.3% |
| Central American | 212 | 3.0% |
| Cherokee | 25 | 0.4% |
| Colombian | 73 | 1.0% |
| Cuban | 115 | 1.6% |
| Czech | 12 | 0.2% |
| Dominican | 24 | 0.3% |
| Dutch | 37 | 0.5% |
| Eastern European | 52 | 0.7% |
| Ecuadorian | 137 | 1.9% |
| Egyptian | 503 | 7.2% |
| English | 448 | 6.4% |
| French | 27 | 0.4% |
| French Canadian | 12 | 0.2% |
| German | 1,099 | 15.7% |
| Greek | 218 | 3.1% |
| Guatemalan | 16 | 0.2% |
| Honduran | 196 | 2.8% |
| Hungarian | 838 | 11.9% |
| Indian (Asian) | 30 | 0.4% |
| Irish | 1,688 | 24.1% |
| Israeli | 13 | 0.2% |
| Italian | 1,758 | 25.1% |
| Jordanian | 103 | 1.5% |
| Korean | 200 | 2.9% |
| Lithuanian | 117 | 1.7% |
| Macedonian | 43 | 0.6% |
| Norwegian | 22 | 0.3% |
| Polish | 791 | 11.3% |
| Portuguese | 56 | 0.8% |
| Puerto Rican | 155 | 2.2% |
| Russian | 94 | 1.3% |
| Scottish | 75 | 1.1% |
| Slavic | 14 | 0.2% |
| Slovak | 14 | 0.2% |
| South American | 210 | 3.0% |
| Spanish | 5 | 0.1% |
| Swedish | 23 | 0.3% |
| Swiss | 13 | 0.2% |
| Thai | 31 | 0.4% |
| U.S. Virgin Islander | 21 | 0.3% |
| Ukrainian | 20 | 0.3% | View All 50 Rows |
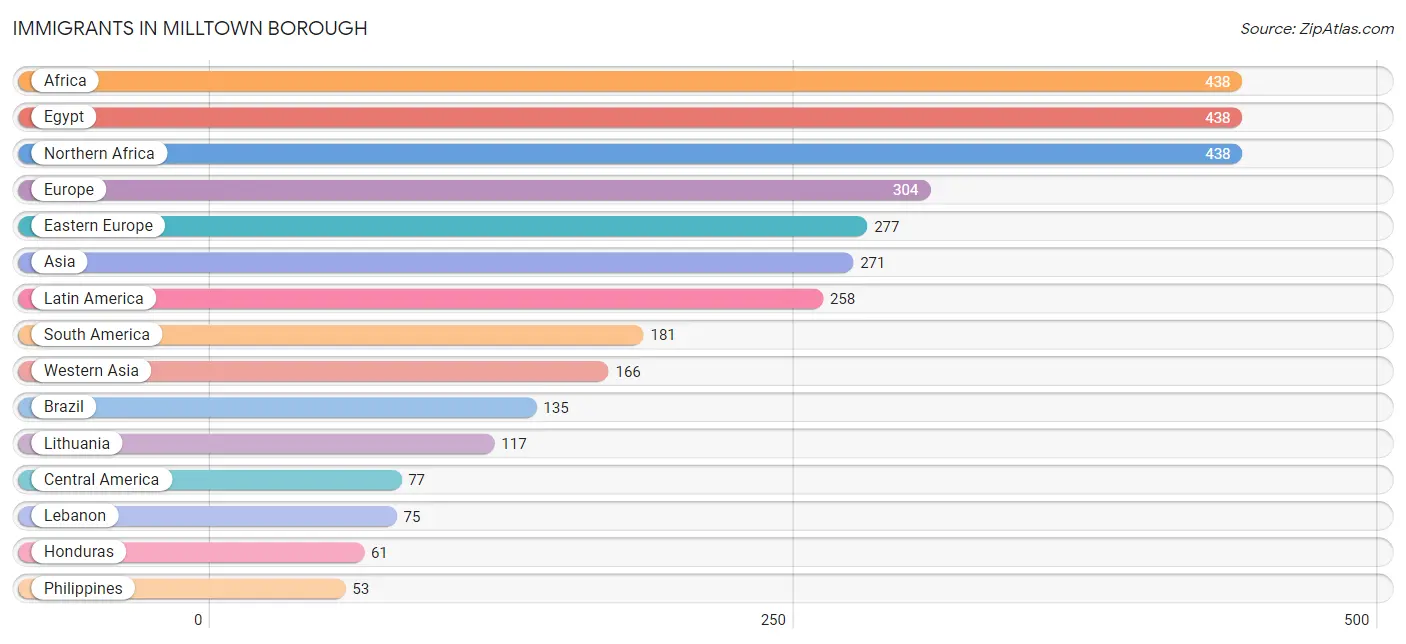
Immigrants in Milltown borough
The most numerous immigrant groups reported in Milltown borough came from Africa (438 | 6.2%), Egypt (438 | 6.2%), Northern Africa (438 | 6.2%), Europe (304 | 4.3%), and Eastern Europe (277 | 4.0%), together accounting for 27.0% of all Milltown borough residents.
| Immigration Origin | # Population | % Population |
| Africa | 438 | 6.2% |
| Asia | 271 | 3.9% |
| Brazil | 135 | 1.9% |
| Bulgaria | 33 | 0.5% |
| Canada | 37 | 0.5% |
| Central America | 77 | 1.1% |
| Colombia | 14 | 0.2% |
| Eastern Asia | 21 | 0.3% |
| Eastern Europe | 277 | 4.0% |
| Ecuador | 32 | 0.5% |
| Egypt | 438 | 6.2% |
| Europe | 304 | 4.3% |
| Guatemala | 16 | 0.2% |
| Honduras | 61 | 0.9% |
| Hungary | 37 | 0.5% |
| India | 31 | 0.4% |
| Israel | 26 | 0.4% |
| Italy | 14 | 0.2% |
| Korea | 21 | 0.3% |
| Latin America | 258 | 3.7% |
| Lebanon | 75 | 1.1% |
| Lithuania | 117 | 1.7% |
| Netherlands | 13 | 0.2% |
| North Macedonia | 29 | 0.4% |
| Northern Africa | 438 | 6.2% |
| Philippines | 53 | 0.8% |
| Poland | 35 | 0.5% |
| South America | 181 | 2.6% |
| South Central Asia | 31 | 0.4% |
| South Eastern Asia | 53 | 0.8% |
| Southern Europe | 14 | 0.2% |
| Ukraine | 26 | 0.4% |
| Western Asia | 166 | 2.4% |
| Western Europe | 13 | 0.2% | View All 34 Rows |
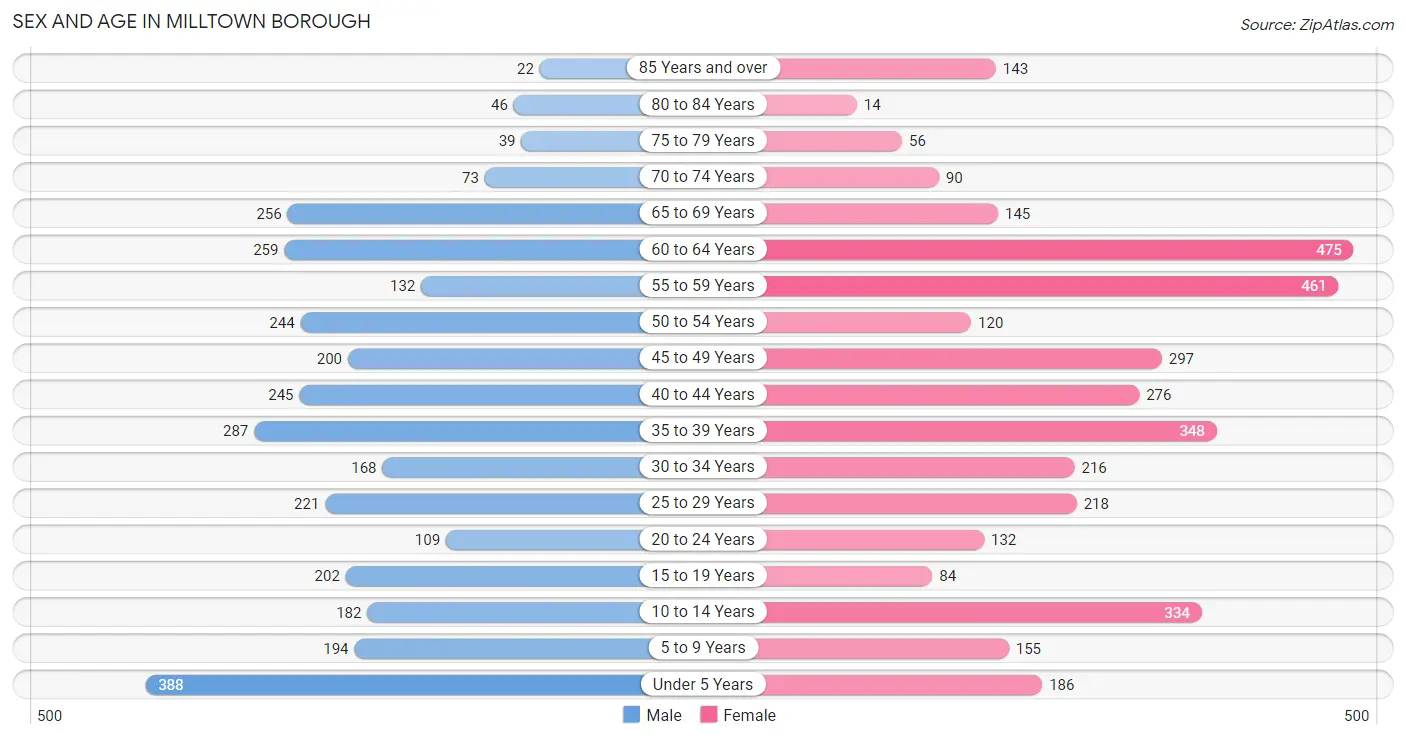
Sex and Age in Milltown borough
Sex and Age in Milltown borough
The most populous age groups in Milltown borough are Under 5 Years (388 | 11.9%) for men and 60 to 64 Years (475 | 12.7%) for women.
| Age Bracket | Male | Female |
| Under 5 Years | 388 (11.9%) | 186 (5.0%) |
| 5 to 9 Years | 194 (5.9%) | 155 (4.1%) |
| 10 to 14 Years | 182 (5.6%) | 334 (8.9%) |
| 15 to 19 Years | 202 (6.2%) | 84 (2.2%) |
| 20 to 24 Years | 109 (3.3%) | 132 (3.5%) |
| 25 to 29 Years | 221 (6.8%) | 218 (5.8%) |
| 30 to 34 Years | 168 (5.1%) | 216 (5.8%) |
| 35 to 39 Years | 287 (8.8%) | 348 (9.3%) |
| 40 to 44 Years | 245 (7.5%) | 276 (7.4%) |
| 45 to 49 Years | 200 (6.1%) | 297 (7.9%) |
| 50 to 54 Years | 244 (7.5%) | 120 (3.2%) |
| 55 to 59 Years | 132 (4.0%) | 461 (12.3%) |
| 60 to 64 Years | 259 (7.9%) | 475 (12.7%) |
| 65 to 69 Years | 256 (7.8%) | 145 (3.9%) |
| 70 to 74 Years | 73 (2.2%) | 90 (2.4%) |
| 75 to 79 Years | 39 (1.2%) | 56 (1.5%) |
| 80 to 84 Years | 46 (1.4%) | 14 (0.4%) |
| 85 Years and over | 22 (0.7%) | 143 (3.8%) |
| Total | 3,267 (100.0%) | 3,750 (100.0%) |
Families and Households in Milltown borough
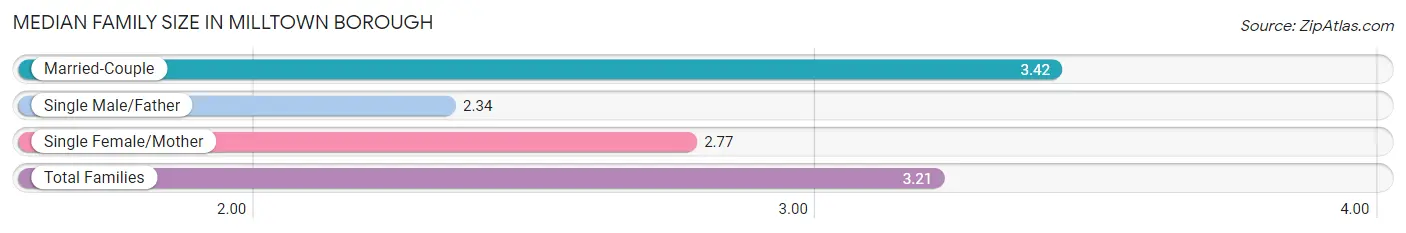
Median Family Size in Milltown borough
The median family size in Milltown borough is 3.21 persons per family, with married-couple families (1,399 | 73.1%) accounting for the largest median family size of 3.42 persons per family. On the other hand, single male/father families (178 | 9.3%) represent the smallest median family size with 2.34 persons per family.
| Family Type | # Families | Family Size |
| Married-Couple | 1,399 (73.1%) | 3.42 |
| Single Male/Father | 178 (9.3%) | 2.34 |
| Single Female/Mother | 336 (17.6%) | 2.77 |
| Total Families | 1,913 (100.0%) | 3.21 |
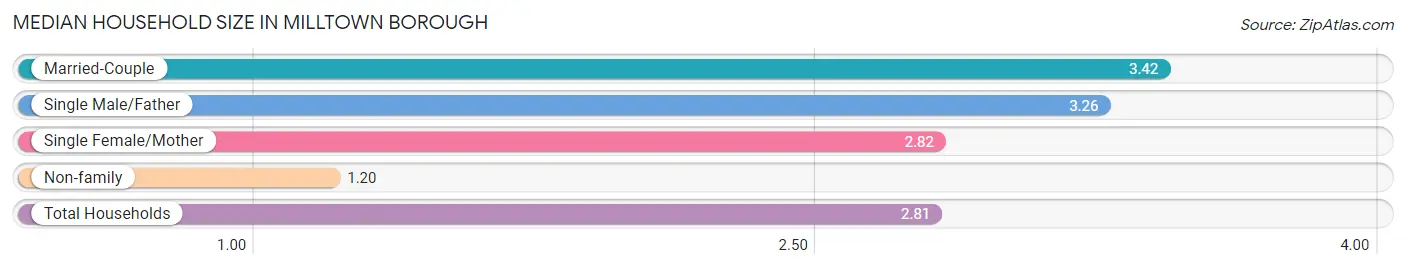
Median Household Size in Milltown borough
The median household size in Milltown borough is 2.81 persons per household, with married-couple households (1,399 | 56.0%) accounting for the largest median household size of 3.42 persons per household. non-family households (583 | 23.4%) represent the smallest median household size with 1.20 persons per household.
| Household Type | # Households | Household Size |
| Married-Couple | 1,399 (56.0%) | 3.42 |
| Single Male/Father | 178 (7.1%) | 3.26 |
| Single Female/Mother | 336 (13.5%) | 2.82 |
| Non-family | 583 (23.4%) | 1.20 |
| Total Households | 2,496 (100.0%) | 2.81 |
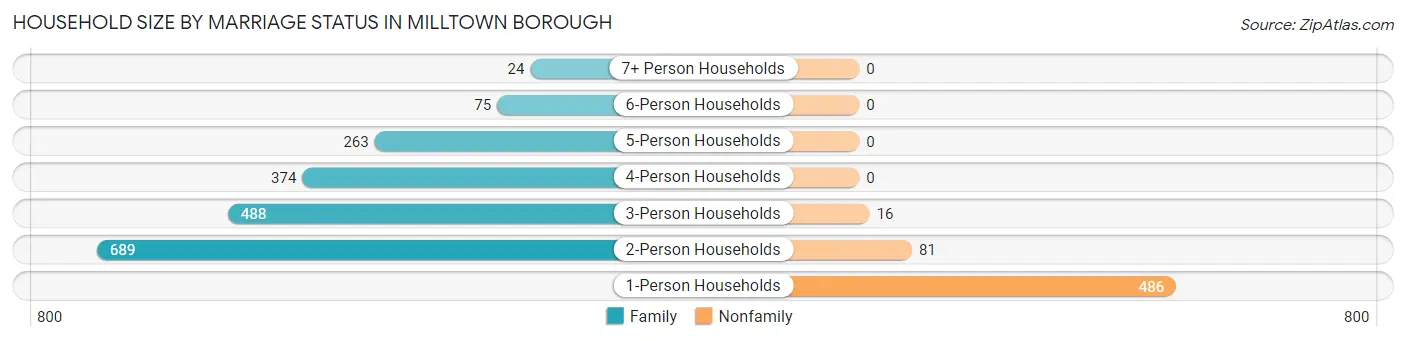
Household Size by Marriage Status in Milltown borough
Out of a total of 2,496 households in Milltown borough, 1,913 (76.6%) are family households, while 583 (23.4%) are nonfamily households. The most numerous type of family households are 2-person households, comprising 689, and the most common type of nonfamily households are 1-person households, comprising 486.
| Household Size | Family Households | Nonfamily Households |
| 1-Person Households | - | 486 (19.5%) |
| 2-Person Households | 689 (27.6%) | 81 (3.3%) |
| 3-Person Households | 488 (19.6%) | 16 (0.6%) |
| 4-Person Households | 374 (15.0%) | 0 (0.0%) |
| 5-Person Households | 263 (10.5%) | 0 (0.0%) |
| 6-Person Households | 75 (3.0%) | 0 (0.0%) |
| 7+ Person Households | 24 (1.0%) | 0 (0.0%) |
| Total | 1,913 (76.6%) | 583 (23.4%) |
Female Fertility in Milltown borough
Fertility by Age in Milltown borough
Average fertility rate in Milltown borough is 96.0 births per 1,000 women. Women in the age bracket of 20 to 34 years have the highest fertility rate with 124.0 births per 1,000 women. Women in the age bracket of 35 to 50 years acount for 54.2% of all women with births.
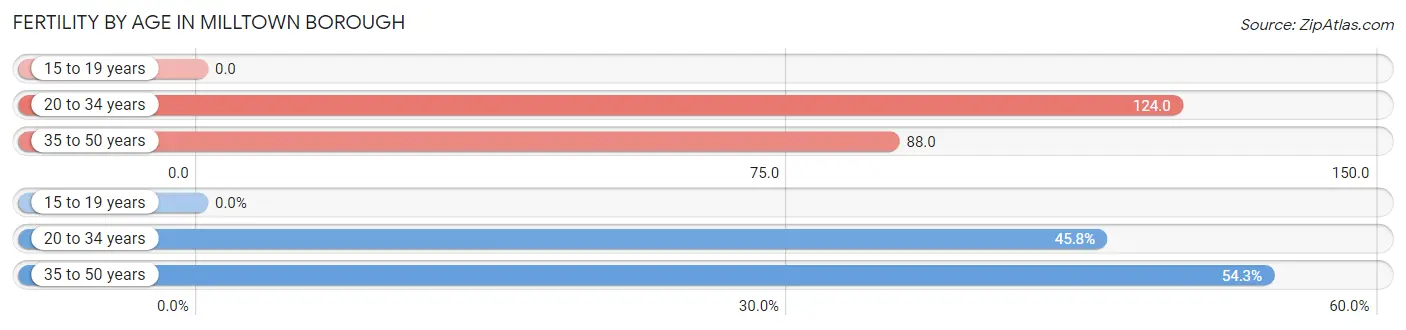
| Age Bracket | Women with Births | Births / 1,000 Women |
| 15 to 19 years | 0 (0.0%) | 0.0 |
| 20 to 34 years | 70 (45.8%) | 124.0 |
| 35 to 50 years | 83 (54.2%) | 88.0 |
| Total | 153 (100.0%) | 96.0 |
Fertility by Age by Marriage Status in Milltown borough
54.9% of women with births (153) in Milltown borough are married. The highest percentage of unmarried women with births falls into 35 to 50 years age bracket with 83.1% of them unmarried at the time of birth, while the lowest percentage of unmarried women with births belong to 20 to 34 years age bracket with 0.0% of them unmarried.
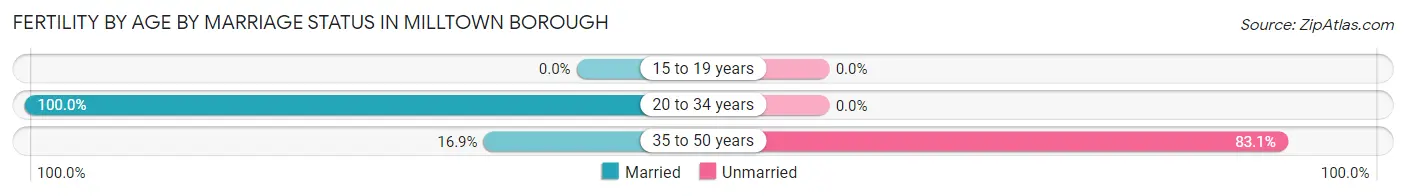
| Age Bracket | Married | Unmarried |
| 15 to 19 years | 0 (0.0%) | 0 (0.0%) |
| 20 to 34 years | 70 (100.0%) | 0 (0.0%) |
| 35 to 50 years | 14 (16.9%) | 69 (83.1%) |
| Total | 84 (54.9%) | 69 (45.1%) |
Fertility by Education in Milltown borough
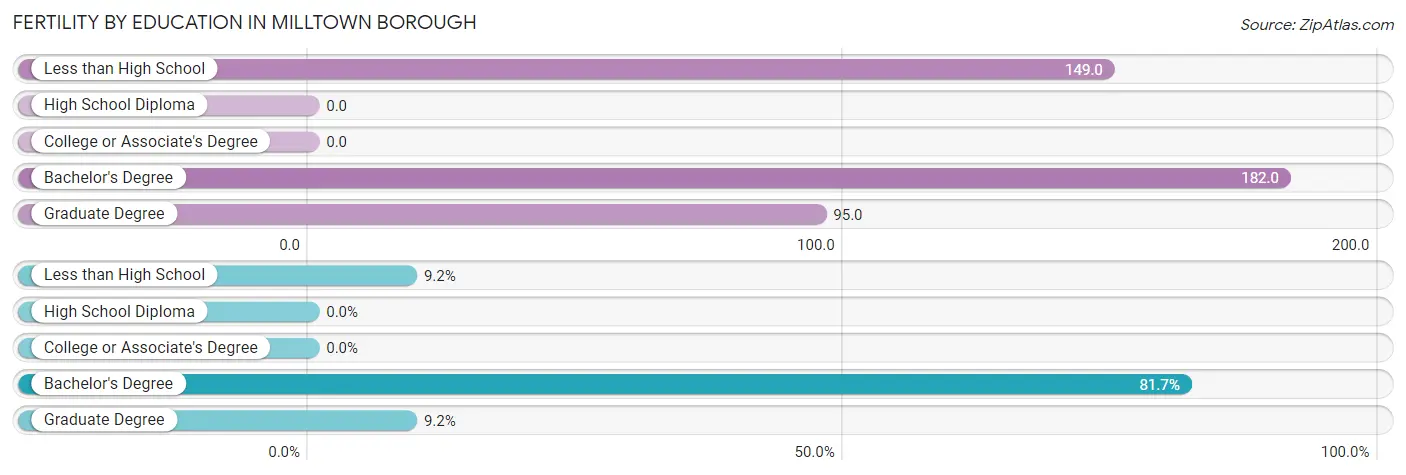
| Educational Attainment | Women with Births | Births / 1,000 Women |
| Less than High School | 14 (9.1%) | 149.0 |
| High School Diploma | 0 (0.0%) | 0.0 |
| College or Associate's Degree | 0 (0.0%) | 0.0 |
| Bachelor's Degree | 125 (81.7%) | 182.0 |
| Graduate Degree | 14 (9.1%) | 95.0 |
| Total | 153 (100.0%) | 96.0 |
Fertility by Education by Marriage Status in Milltown borough
45.1% of women with births in Milltown borough are unmarried. Women with the educational attainment of less than high school are most likely to be married with 100.0% of them married at childbirth, while women with the educational attainment of bachelor's degree are least likely to be married with 55.2% of them unmarried at childbirth.
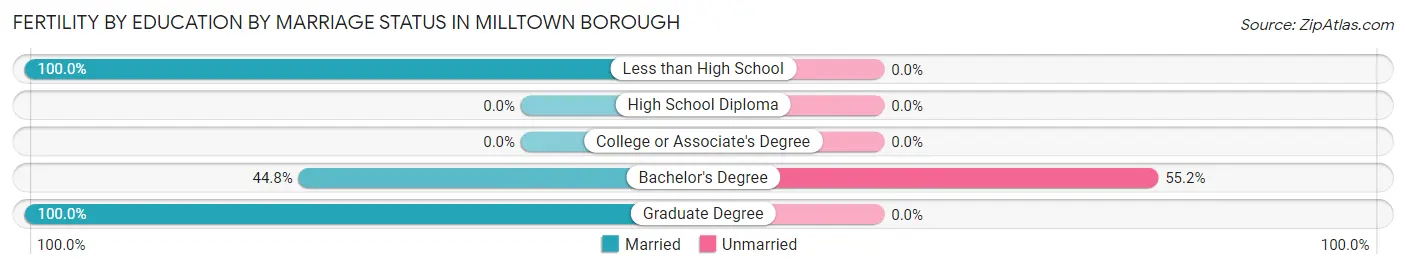
| Educational Attainment | Married | Unmarried |
| Less than High School | 14 (100.0%) | 0 (0.0%) |
| High School Diploma | 0 (0.0%) | 0 (0.0%) |
| College or Associate's Degree | 0 (0.0%) | 0 (0.0%) |
| Bachelor's Degree | 56 (44.8%) | 69 (55.2%) |
| Graduate Degree | 14 (100.0%) | 0 (0.0%) |
| Total | 84 (54.9%) | 69 (45.1%) |
Employment Characteristics in Milltown borough
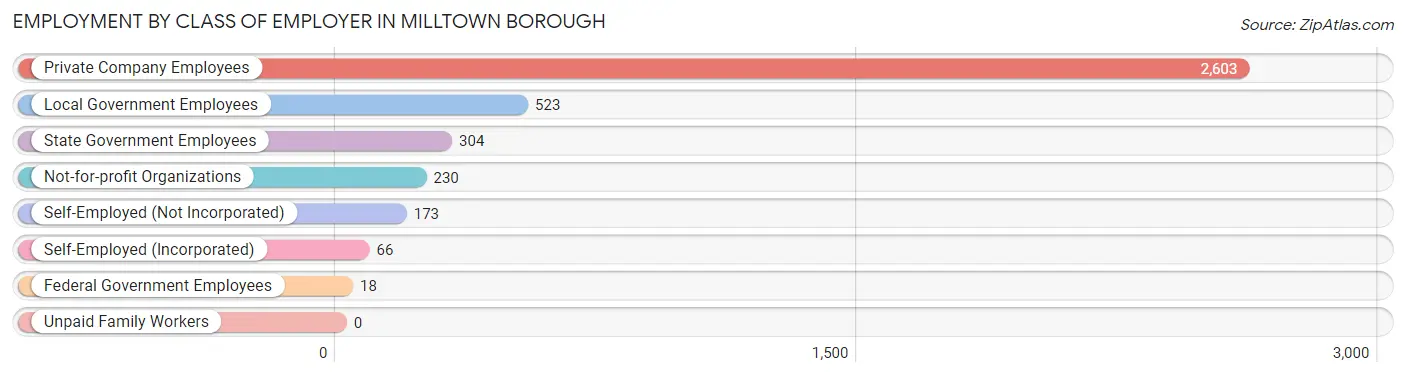
Employment by Class of Employer in Milltown borough
Among the 3,917 employed individuals in Milltown borough, private company employees (2,603 | 66.4%), local government employees (523 | 13.4%), and state government employees (304 | 7.8%) make up the most common classes of employment.
| Employer Class | # Employees | % Employees |
| Private Company Employees | 2,603 | 66.4% |
| Self-Employed (Incorporated) | 66 | 1.7% |
| Self-Employed (Not Incorporated) | 173 | 4.4% |
| Not-for-profit Organizations | 230 | 5.9% |
| Local Government Employees | 523 | 13.4% |
| State Government Employees | 304 | 7.8% |
| Federal Government Employees | 18 | 0.5% |
| Unpaid Family Workers | 0 | 0.0% |
| Total | 3,917 | 100.0% |
Employment Status by Age in Milltown borough
According to the labor force statistics for Milltown borough, out of the total population over 16 years of age (5,568), 74.7% or 4,159 individuals are in the labor force, with 4.9% or 204 of them unemployed. The age group with the highest labor force participation rate is 30 to 34 years, with 100.0% or 384 individuals in the labor force. Within the labor force, the 45 to 54 years age range has the highest percentage of unemployed individuals, with 8.7% or 70 of them being unemployed.
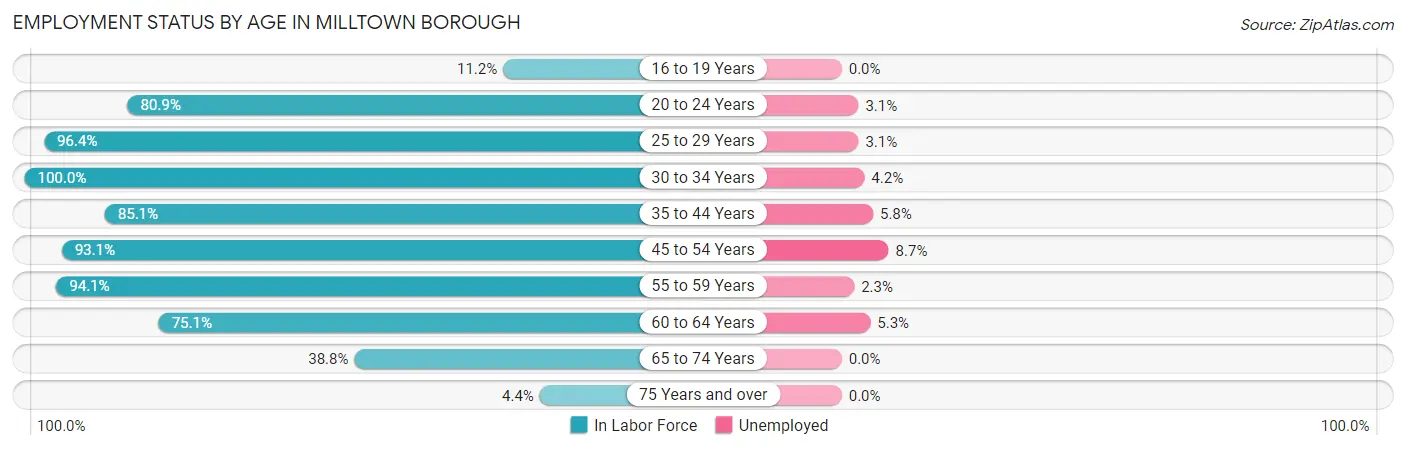
| Age Bracket | In Labor Force | Unemployed |
| 16 to 19 Years | 31 (11.2%) | 0 (0.0%) |
| 20 to 24 Years | 195 (80.9%) | 6 (3.1%) |
| 25 to 29 Years | 423 (96.4%) | 13 (3.1%) |
| 30 to 34 Years | 384 (100.0%) | 16 (4.2%) |
| 35 to 44 Years | 984 (85.1%) | 57 (5.8%) |
| 45 to 54 Years | 802 (93.1%) | 70 (8.7%) |
| 55 to 59 Years | 558 (94.1%) | 13 (2.3%) |
| 60 to 64 Years | 551 (75.1%) | 29 (5.3%) |
| 65 to 74 Years | 219 (38.8%) | 0 (0.0%) |
| 75 Years and over | 14 (4.4%) | 0 (0.0%) |
| Total | 4,159 (74.7%) | 204 (4.9%) |
Employment Status by Educational Attainment in Milltown borough
According to labor force statistics for Milltown borough, 88.8% of individuals (3,700) out of the total population between 25 and 64 years of age (4,167) are in the labor force, with 5.3% or 196 of them being unemployed. The group with the highest labor force participation rate are those with the educational attainment of bachelor's degree or higher, with 95.6% or 1,719 individuals in the labor force. Within the labor force, individuals with college / associate degree education have the highest percentage of unemployment, with 10.8% or 124 of them being unemployed.
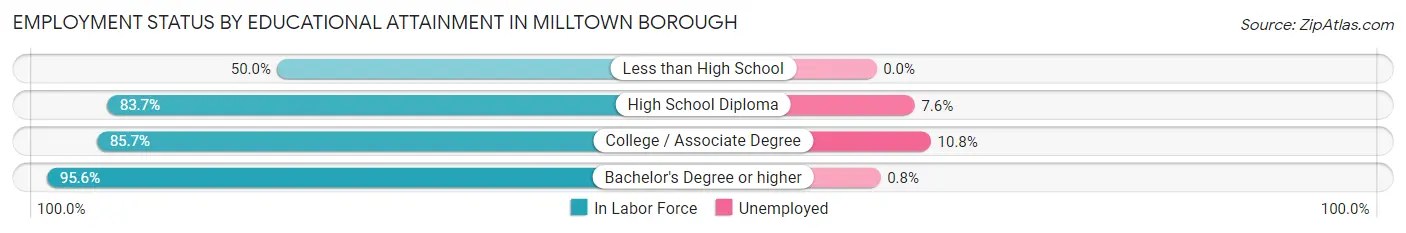
| Educational Attainment | In Labor Force | Unemployed |
| Less than High School | 38 (50.0%) | 0 (0.0%) |
| High School Diploma | 801 (83.7%) | 73 (7.6%) |
| College / Associate Degree | 1,145 (85.7%) | 144 (10.8%) |
| Bachelor's Degree or higher | 1,719 (95.6%) | 14 (0.8%) |
| Total | 3,700 (88.8%) | 221 (5.3%) |
Employment Occupations by Sex in Milltown borough
Management, Business, Science and Arts Occupations
The most common Management, Business, Science and Arts occupations in Milltown borough are Management (624 | 15.8%), Community & Social Service (383 | 9.7%), Computers, Engineering & Science (334 | 8.4%), Health Diagnosing & Treating (283 | 7.1%), and Health Technologists (225 | 5.7%).
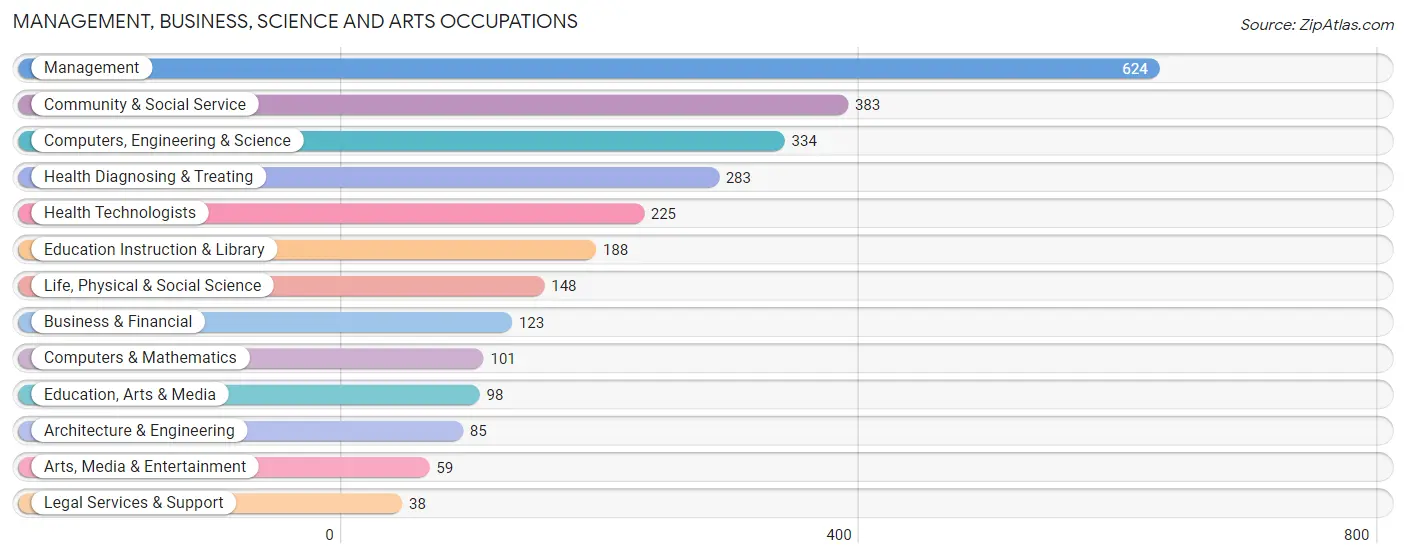
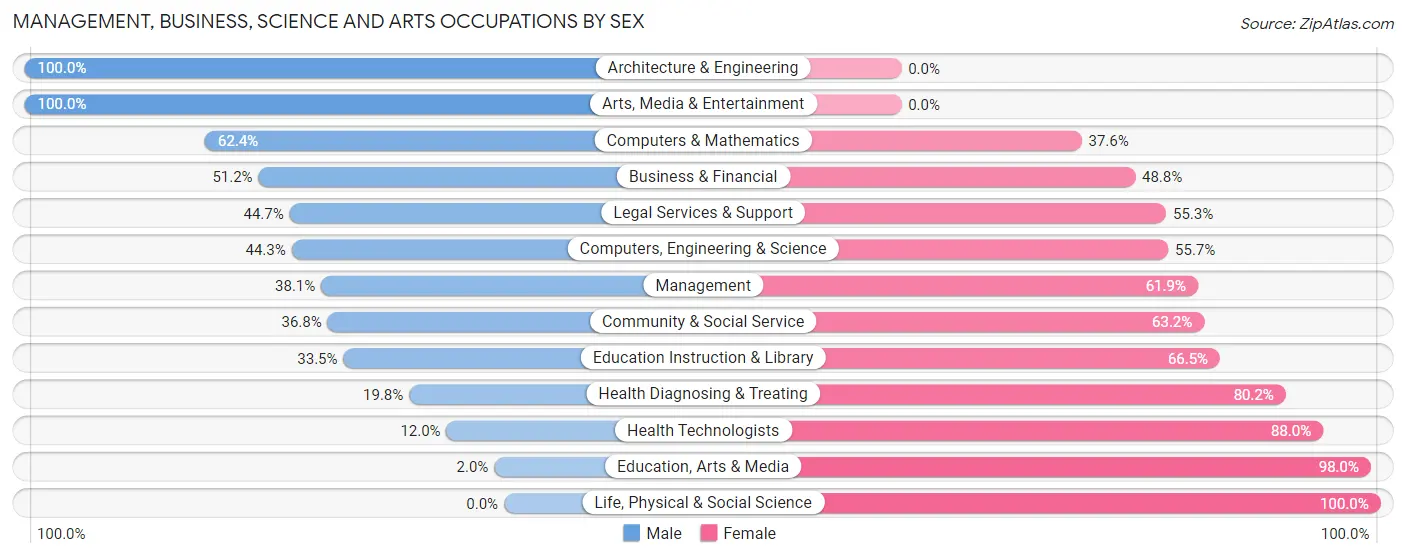
Management, Business, Science and Arts Occupations by Sex
Within the Management, Business, Science and Arts occupations in Milltown borough, the most male-oriented occupations are Architecture & Engineering (100.0%), Arts, Media & Entertainment (100.0%), and Computers & Mathematics (62.4%), while the most female-oriented occupations are Life, Physical & Social Science (100.0%), Education, Arts & Media (98.0%), and Health Technologists (88.0%).
| Occupation | Male | Female |
| Management | 238 (38.1%) | 386 (61.9%) |
| Business & Financial | 63 (51.2%) | 60 (48.8%) |
| Computers, Engineering & Science | 148 (44.3%) | 186 (55.7%) |
| Computers & Mathematics | 63 (62.4%) | 38 (37.6%) |
| Architecture & Engineering | 85 (100.0%) | 0 (0.0%) |
| Life, Physical & Social Science | 0 (0.0%) | 148 (100.0%) |
| Community & Social Service | 141 (36.8%) | 242 (63.2%) |
| Education, Arts & Media | 2 (2.0%) | 96 (98.0%) |
| Legal Services & Support | 17 (44.7%) | 21 (55.3%) |
| Education Instruction & Library | 63 (33.5%) | 125 (66.5%) |
| Arts, Media & Entertainment | 59 (100.0%) | 0 (0.0%) |
| Health Diagnosing & Treating | 56 (19.8%) | 227 (80.2%) |
| Health Technologists | 27 (12.0%) | 198 (88.0%) |
| Total (Category) | 646 (37.0%) | 1,101 (63.0%) |
| Total (Overall) | 1,757 (44.4%) | 2,200 (55.6%) |
Services Occupations
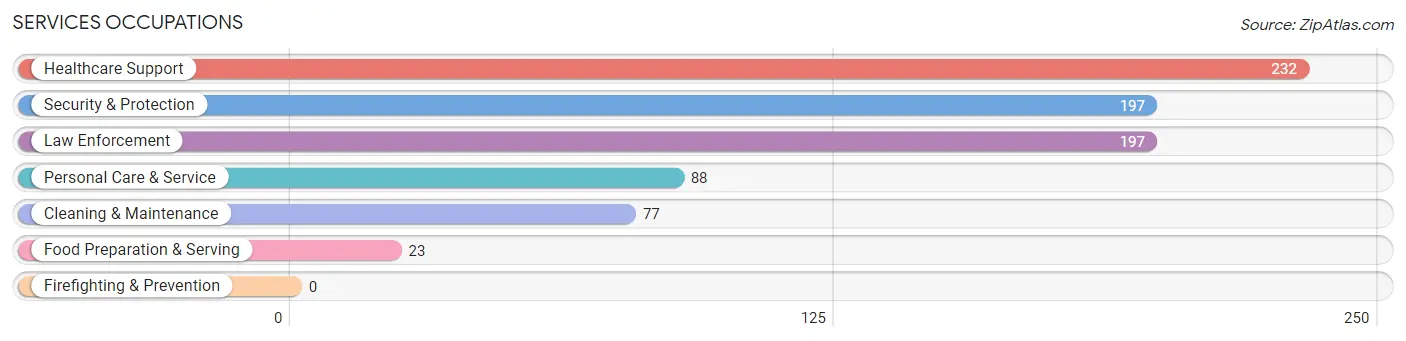
The most common Services occupations in Milltown borough are Healthcare Support (232 | 5.9%), Security & Protection (197 | 5.0%), Law Enforcement (197 | 5.0%), Personal Care & Service (88 | 2.2%), and Cleaning & Maintenance (77 | 1.9%).
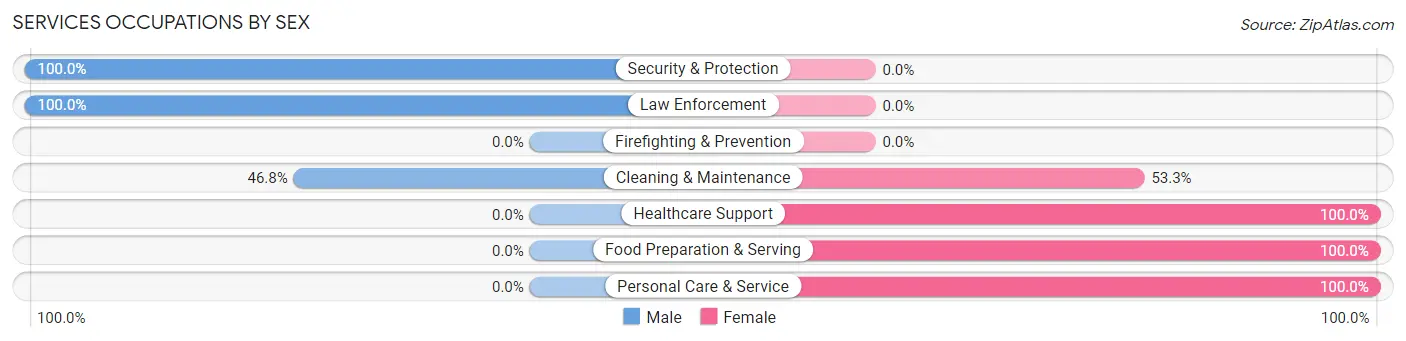
Services Occupations by Sex
Within the Services occupations in Milltown borough, the most male-oriented occupations are Security & Protection (100.0%), Law Enforcement (100.0%), and Cleaning & Maintenance (46.8%), while the most female-oriented occupations are Healthcare Support (100.0%), Food Preparation & Serving (100.0%), and Personal Care & Service (100.0%).
| Occupation | Male | Female |
| Healthcare Support | 0 (0.0%) | 232 (100.0%) |
| Security & Protection | 197 (100.0%) | 0 (0.0%) |
| Firefighting & Prevention | 0 (0.0%) | 0 (0.0%) |
| Law Enforcement | 197 (100.0%) | 0 (0.0%) |
| Food Preparation & Serving | 0 (0.0%) | 23 (100.0%) |
| Cleaning & Maintenance | 36 (46.8%) | 41 (53.2%) |
| Personal Care & Service | 0 (0.0%) | 88 (100.0%) |
| Total (Category) | 233 (37.8%) | 384 (62.2%) |
| Total (Overall) | 1,757 (44.4%) | 2,200 (55.6%) |
Sales and Office Occupations
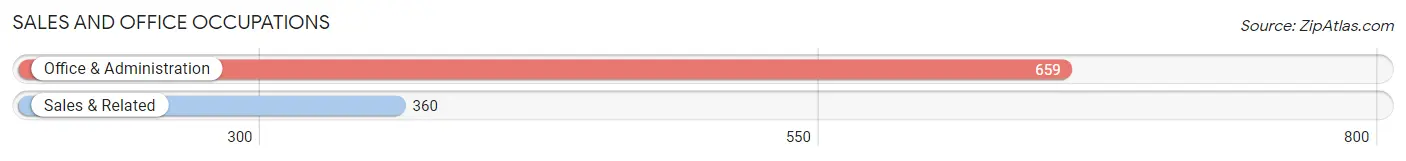
The most common Sales and Office occupations in Milltown borough are Office & Administration (659 | 16.7%), and Sales & Related (360 | 9.1%).
Sales and Office Occupations by Sex
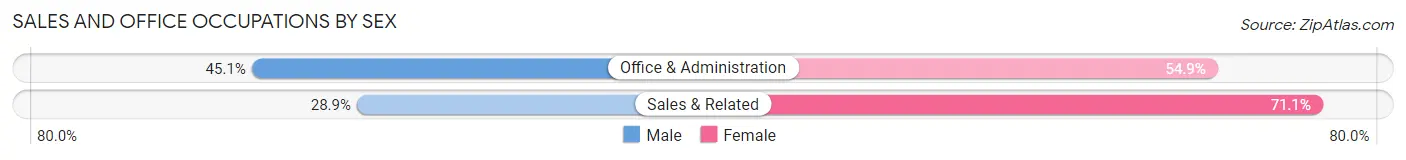
| Occupation | Male | Female |
| Sales & Related | 104 (28.9%) | 256 (71.1%) |
| Office & Administration | 297 (45.1%) | 362 (54.9%) |
| Total (Category) | 401 (39.4%) | 618 (60.7%) |
| Total (Overall) | 1,757 (44.4%) | 2,200 (55.6%) |
Natural Resources, Construction and Maintenance Occupations
The most common Natural Resources, Construction and Maintenance occupations in Milltown borough are Construction & Extraction (131 | 3.3%), and Installation, Maintenance & Repair (28 | 0.7%).
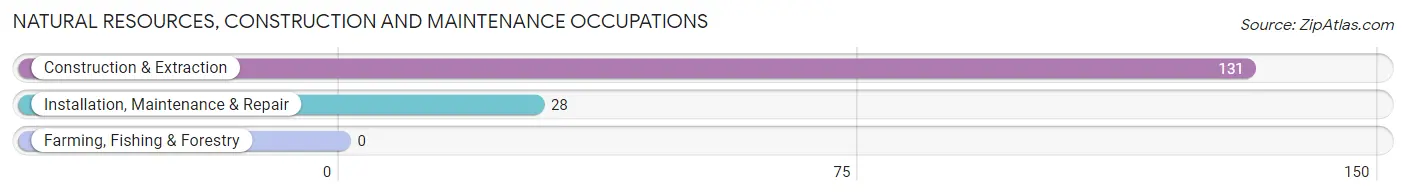
Natural Resources, Construction and Maintenance Occupations by Sex
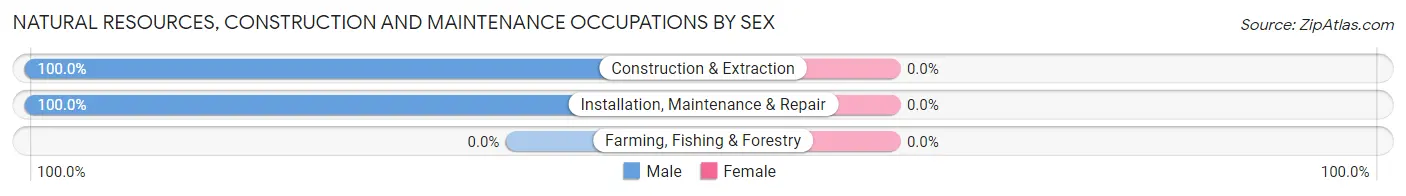
| Occupation | Male | Female |
| Farming, Fishing & Forestry | 0 (0.0%) | 0 (0.0%) |
| Construction & Extraction | 131 (100.0%) | 0 (0.0%) |
| Installation, Maintenance & Repair | 28 (100.0%) | 0 (0.0%) |
| Total (Category) | 159 (100.0%) | 0 (0.0%) |
| Total (Overall) | 1,757 (44.4%) | 2,200 (55.6%) |
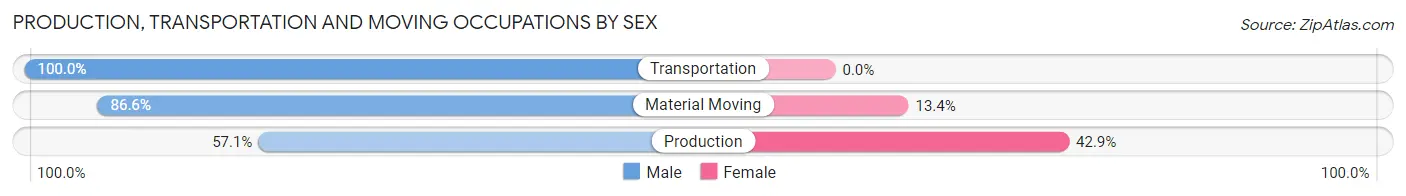
Production, Transportation and Moving Occupations
The most common Production, Transportation and Moving occupations in Milltown borough are Production (196 | 5.0%), Transportation (122 | 3.1%), and Material Moving (97 | 2.5%).
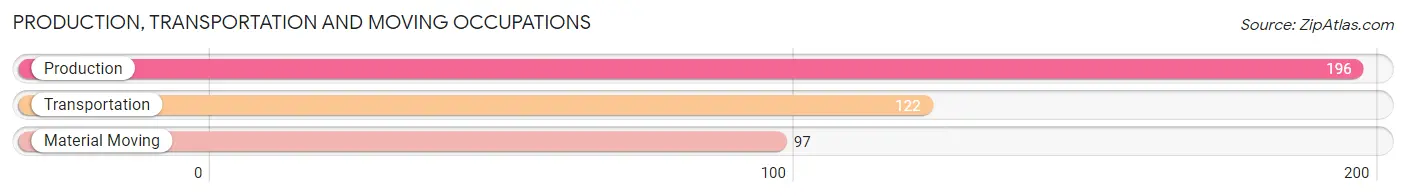
Production, Transportation and Moving Occupations by Sex
| Occupation | Male | Female |
| Production | 112 (57.1%) | 84 (42.9%) |
| Transportation | 122 (100.0%) | 0 (0.0%) |
| Material Moving | 84 (86.6%) | 13 (13.4%) |
| Total (Category) | 318 (76.6%) | 97 (23.4%) |
| Total (Overall) | 1,757 (44.4%) | 2,200 (55.6%) |
Employment Industries by Sex in Milltown borough
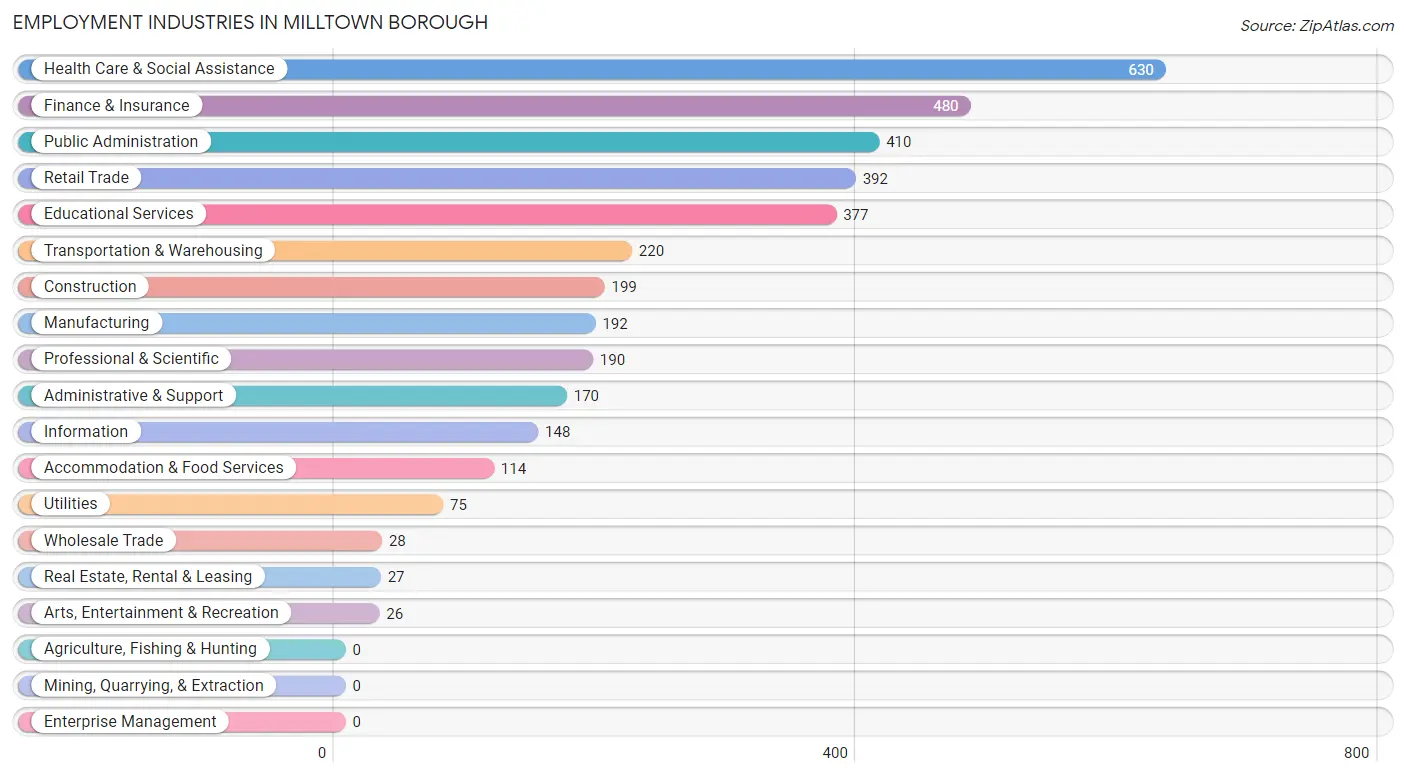
Employment Industries in Milltown borough
The major employment industries in Milltown borough include Health Care & Social Assistance (630 | 15.9%), Finance & Insurance (480 | 12.1%), Public Administration (410 | 10.4%), Retail Trade (392 | 9.9%), and Educational Services (377 | 9.5%).
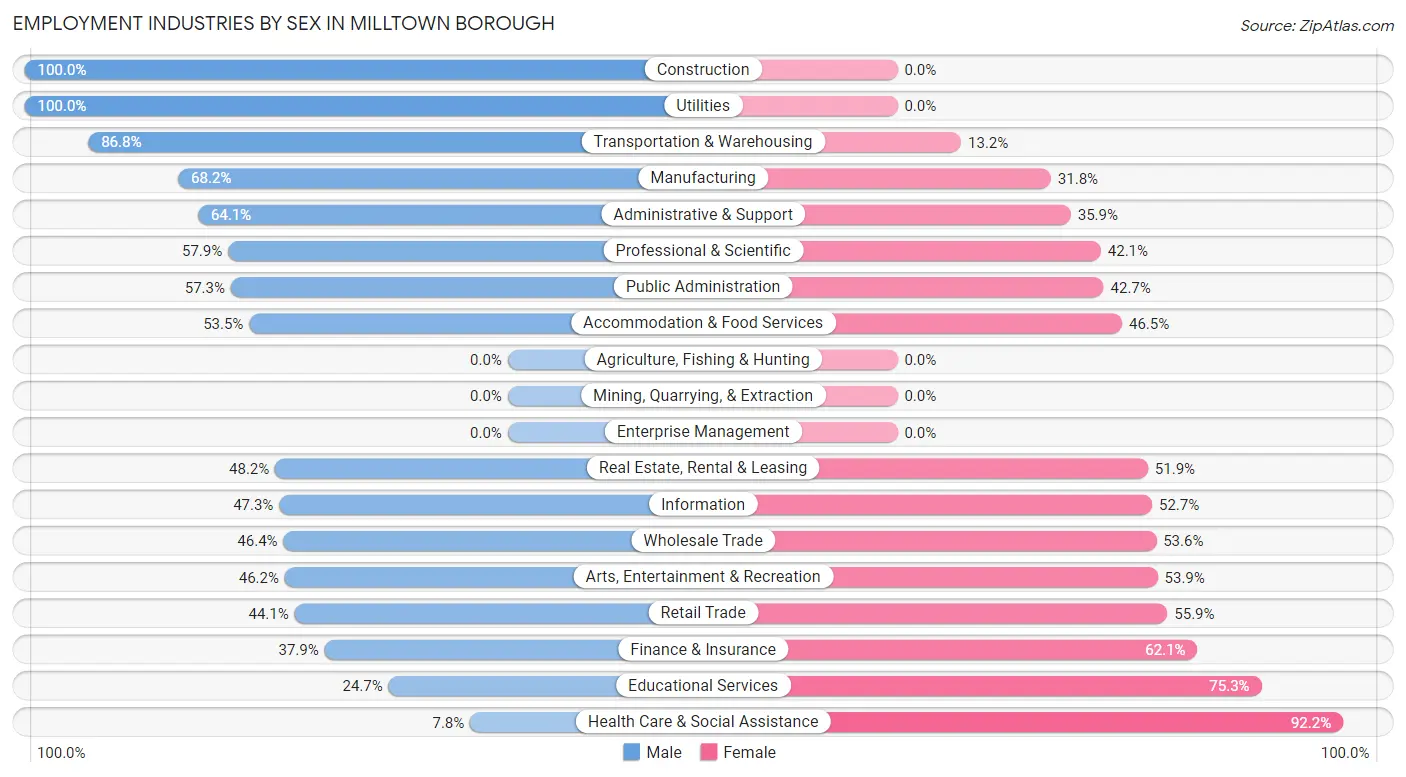
Employment Industries by Sex in Milltown borough
The Milltown borough industries that see more men than women are Construction (100.0%), Utilities (100.0%), and Transportation & Warehousing (86.8%), whereas the industries that tend to have a higher number of women are Health Care & Social Assistance (92.2%), Educational Services (75.3%), and Finance & Insurance (62.1%).
| Industry | Male | Female |
| Agriculture, Fishing & Hunting | 0 (0.0%) | 0 (0.0%) |
| Mining, Quarrying, & Extraction | 0 (0.0%) | 0 (0.0%) |
| Construction | 199 (100.0%) | 0 (0.0%) |
| Manufacturing | 131 (68.2%) | 61 (31.8%) |
| Wholesale Trade | 13 (46.4%) | 15 (53.6%) |
| Retail Trade | 173 (44.1%) | 219 (55.9%) |
| Transportation & Warehousing | 191 (86.8%) | 29 (13.2%) |
| Utilities | 75 (100.0%) | 0 (0.0%) |
| Information | 70 (47.3%) | 78 (52.7%) |
| Finance & Insurance | 182 (37.9%) | 298 (62.1%) |
| Real Estate, Rental & Leasing | 13 (48.1%) | 14 (51.8%) |
| Professional & Scientific | 110 (57.9%) | 80 (42.1%) |
| Enterprise Management | 0 (0.0%) | 0 (0.0%) |
| Administrative & Support | 109 (64.1%) | 61 (35.9%) |
| Educational Services | 93 (24.7%) | 284 (75.3%) |
| Health Care & Social Assistance | 49 (7.8%) | 581 (92.2%) |
| Arts, Entertainment & Recreation | 12 (46.2%) | 14 (53.8%) |
| Accommodation & Food Services | 61 (53.5%) | 53 (46.5%) |
| Public Administration | 235 (57.3%) | 175 (42.7%) |
| Total | 1,757 (44.4%) | 2,200 (55.6%) |
Education in Milltown borough
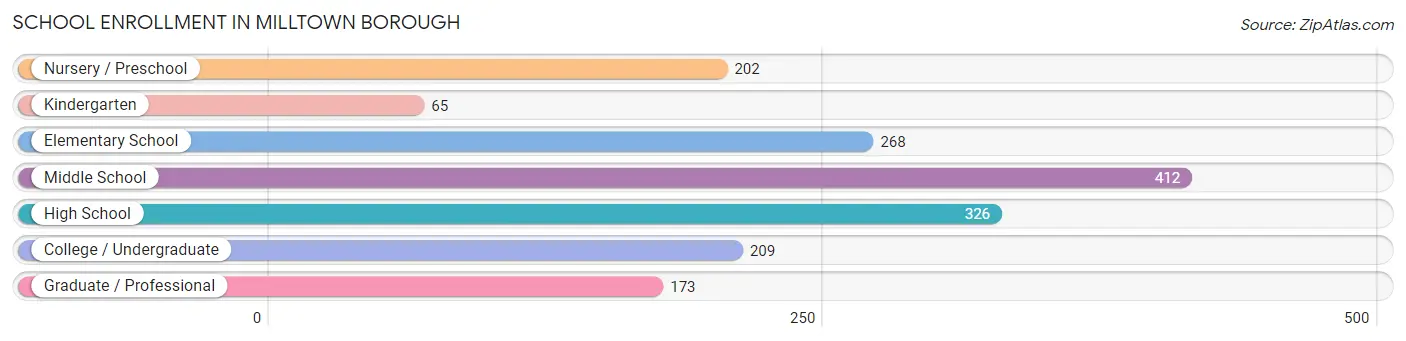
School Enrollment in Milltown borough
The most common levels of schooling among the 1,655 students in Milltown borough are middle school (412 | 24.9%), high school (326 | 19.7%), and elementary school (268 | 16.2%).
| School Level | # Students | % Students |
| Nursery / Preschool | 202 | 12.2% |
| Kindergarten | 65 | 3.9% |
| Elementary School | 268 | 16.2% |
| Middle School | 412 | 24.9% |
| High School | 326 | 19.7% |
| College / Undergraduate | 209 | 12.6% |
| Graduate / Professional | 173 | 10.4% |
| Total | 1,655 | 100.0% |
School Enrollment by Age by Funding Source in Milltown borough
Out of a total of 1,655 students who are enrolled in schools in Milltown borough, 463 (28.0%) attend a private institution, while the remaining 1,192 (72.0%) are enrolled in public schools. The age group of 3 to 4 year olds has the highest likelihood of being enrolled in private schools, with 112 (75.2% in the age bracket) enrolled. Conversely, the age group of 15 to 17 year olds has the lowest likelihood of being enrolled in a private school, with 242 (100.0% in the age bracket) attending a public institution.
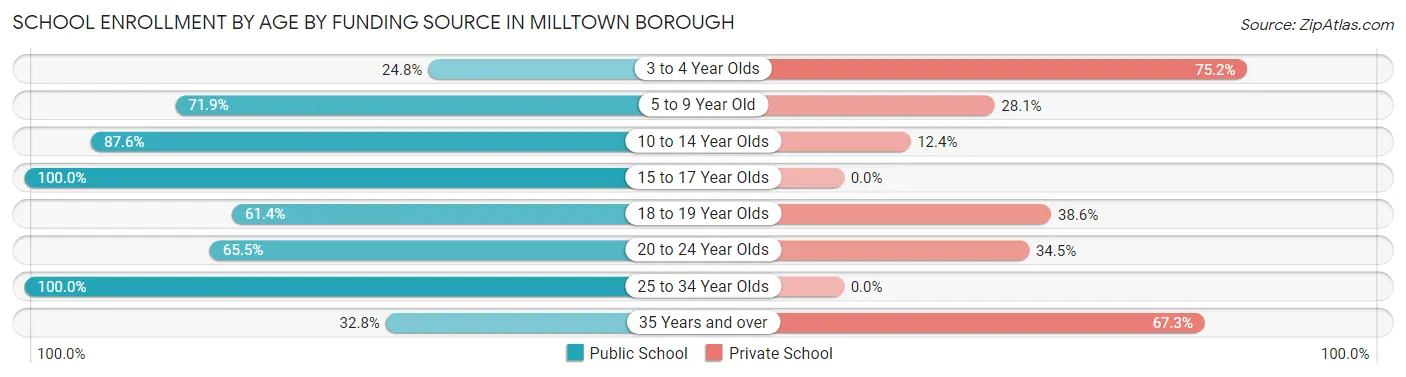
| Age Bracket | Public School | Private School |
| 3 to 4 Year Olds | 37 (24.8%) | 112 (75.2%) |
| 5 to 9 Year Old | 251 (71.9%) | 98 (28.1%) |
| 10 to 14 Year Olds | 452 (87.6%) | 64 (12.4%) |
| 15 to 17 Year Olds | 242 (100.0%) | 0 (0.0%) |
| 18 to 19 Year Olds | 27 (61.4%) | 17 (38.6%) |
| 20 to 24 Year Olds | 110 (65.5%) | 58 (34.5%) |
| 25 to 34 Year Olds | 16 (100.0%) | 0 (0.0%) |
| 35 Years and over | 56 (32.8%) | 115 (67.2%) |
| Total | 1,192 (72.0%) | 463 (28.0%) |
Educational Attainment by Field of Study in Milltown borough
Science & technology (379 | 15.9%), business (324 | 13.6%), social sciences (317 | 13.3%), engineering (248 | 10.4%), and computers & mathematics (184 | 7.7%) are the most common fields of study among 2,383 individuals in Milltown borough who have obtained a bachelor's degree or higher.
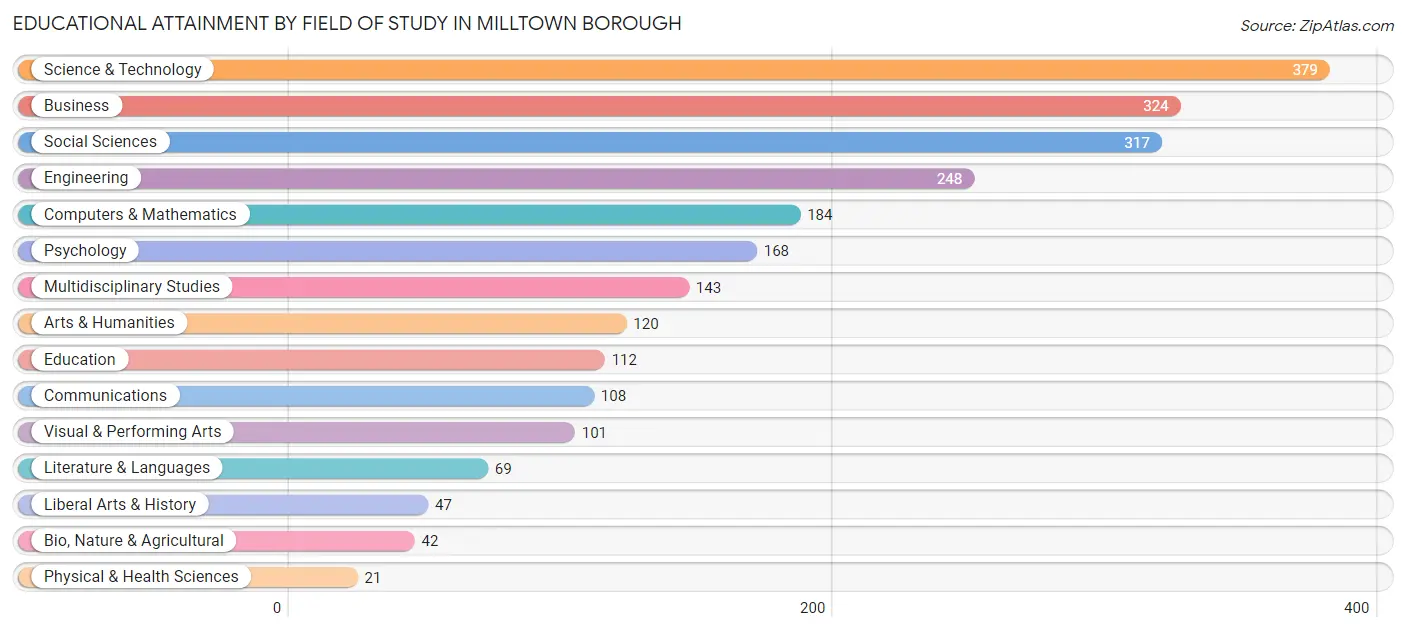
| Field of Study | # Graduates | % Graduates |
| Computers & Mathematics | 184 | 7.7% |
| Bio, Nature & Agricultural | 42 | 1.8% |
| Physical & Health Sciences | 21 | 0.9% |
| Psychology | 168 | 7.0% |
| Social Sciences | 317 | 13.3% |
| Engineering | 248 | 10.4% |
| Multidisciplinary Studies | 143 | 6.0% |
| Science & Technology | 379 | 15.9% |
| Business | 324 | 13.6% |
| Education | 112 | 4.7% |
| Literature & Languages | 69 | 2.9% |
| Liberal Arts & History | 47 | 2.0% |
| Visual & Performing Arts | 101 | 4.2% |
| Communications | 108 | 4.5% |
| Arts & Humanities | 120 | 5.0% |
| Total | 2,383 | 100.0% |
Transportation & Commute in Milltown borough
Vehicle Availability by Sex in Milltown borough
The most prevalent vehicle ownership categories in Milltown borough are males with 2 vehicles (794, accounting for 45.6%) and females with 2 vehicles (984, making up 36.6%).
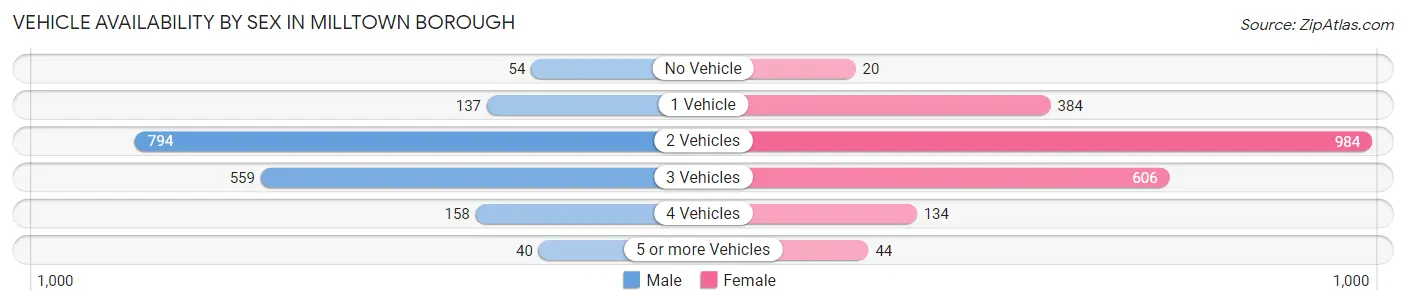
| Vehicles Available | Male | Female |
| No Vehicle | 54 (3.1%) | 20 (0.9%) |
| 1 Vehicle | 137 (7.9%) | 384 (17.7%) |
| 2 Vehicles | 794 (45.6%) | 984 (45.3%) |
| 3 Vehicles | 559 (32.1%) | 606 (27.9%) |
| 4 Vehicles | 158 (9.1%) | 134 (6.2%) |
| 5 or more Vehicles | 40 (2.3%) | 44 (2.0%) |
| Total | 1,742 (100.0%) | 2,172 (100.0%) |
Commute Time in Milltown borough
The most frequently occuring commute durations in Milltown borough are 20 to 24 minutes (641 commuters, 18.2%), 15 to 19 minutes (480 commuters, 13.6%), and 5 to 9 minutes (397 commuters, 11.3%).
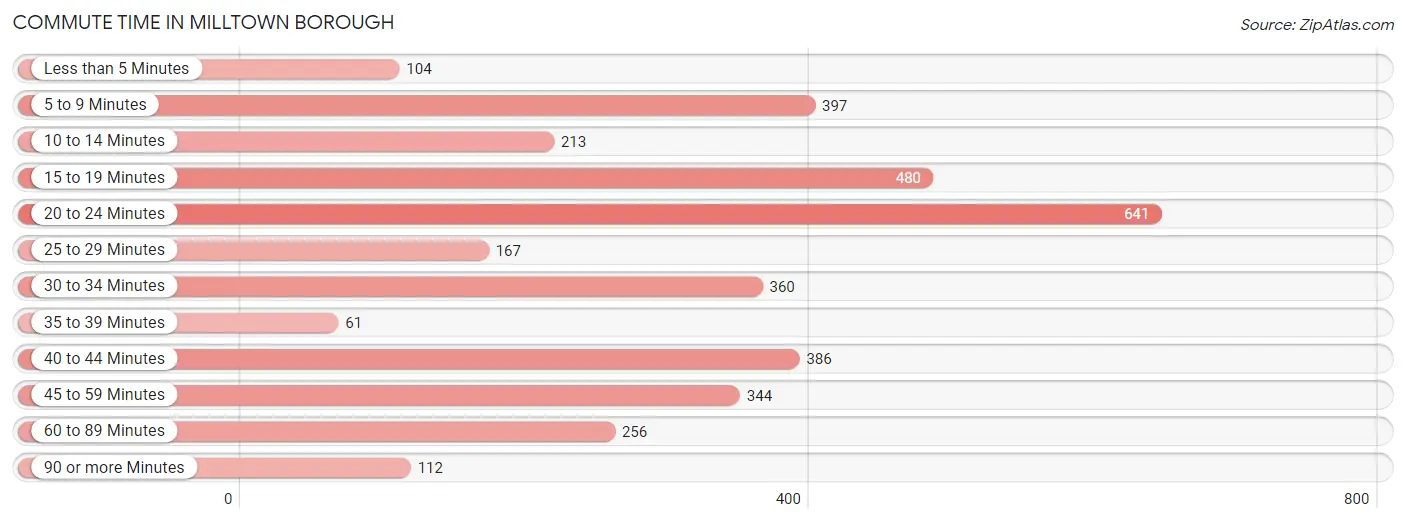
| Commute Time | # Commuters | % Commuters |
| Less than 5 Minutes | 104 | 2.9% |
| 5 to 9 Minutes | 397 | 11.3% |
| 10 to 14 Minutes | 213 | 6.0% |
| 15 to 19 Minutes | 480 | 13.6% |
| 20 to 24 Minutes | 641 | 18.2% |
| 25 to 29 Minutes | 167 | 4.7% |
| 30 to 34 Minutes | 360 | 10.2% |
| 35 to 39 Minutes | 61 | 1.7% |
| 40 to 44 Minutes | 386 | 11.0% |
| 45 to 59 Minutes | 344 | 9.8% |
| 60 to 89 Minutes | 256 | 7.3% |
| 90 or more Minutes | 112 | 3.2% |
Commute Time by Sex in Milltown borough
The most common commute times in Milltown borough are 20 to 24 minutes (346 commuters, 21.6%) for males and 20 to 24 minutes (295 commuters, 15.4%) for females.
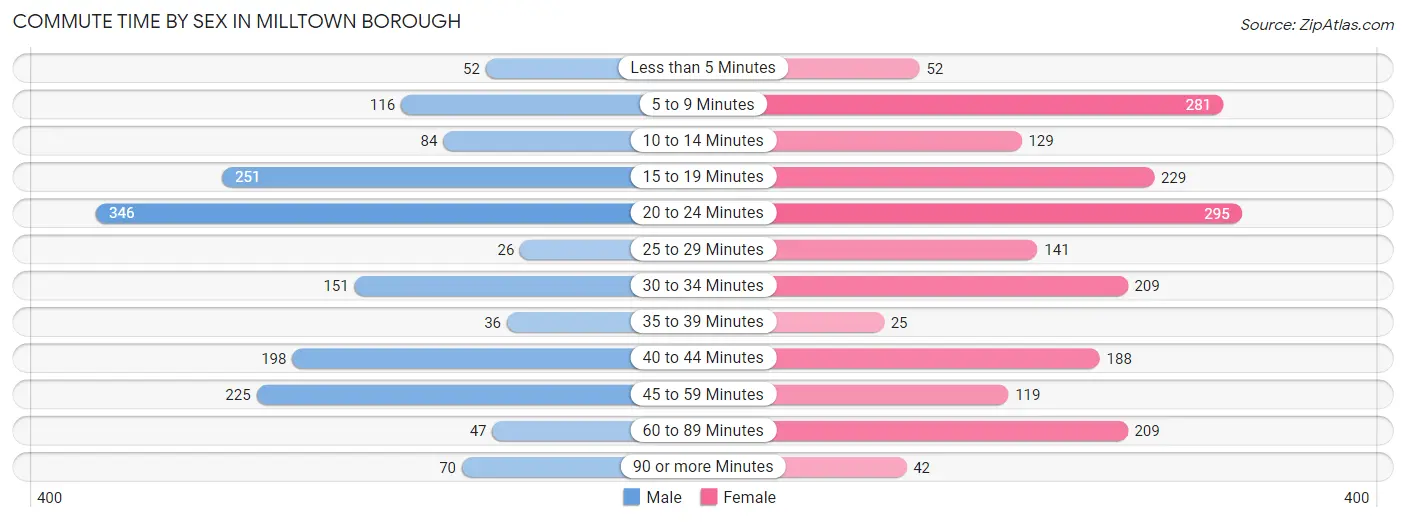
| Commute Time | Male | Female |
| Less than 5 Minutes | 52 (3.3%) | 52 (2.7%) |
| 5 to 9 Minutes | 116 (7.2%) | 281 (14.6%) |
| 10 to 14 Minutes | 84 (5.2%) | 129 (6.7%) |
| 15 to 19 Minutes | 251 (15.7%) | 229 (11.9%) |
| 20 to 24 Minutes | 346 (21.6%) | 295 (15.4%) |
| 25 to 29 Minutes | 26 (1.6%) | 141 (7.3%) |
| 30 to 34 Minutes | 151 (9.4%) | 209 (10.9%) |
| 35 to 39 Minutes | 36 (2.2%) | 25 (1.3%) |
| 40 to 44 Minutes | 198 (12.4%) | 188 (9.8%) |
| 45 to 59 Minutes | 225 (14.0%) | 119 (6.2%) |
| 60 to 89 Minutes | 47 (2.9%) | 209 (10.9%) |
| 90 or more Minutes | 70 (4.4%) | 42 (2.2%) |
Time of Departure to Work by Sex in Milltown borough
The most frequent times of departure to work in Milltown borough are 7:00 AM to 7:29 AM (339, 21.2%) for males and 8:00 AM to 8:29 AM (420, 21.9%) for females.
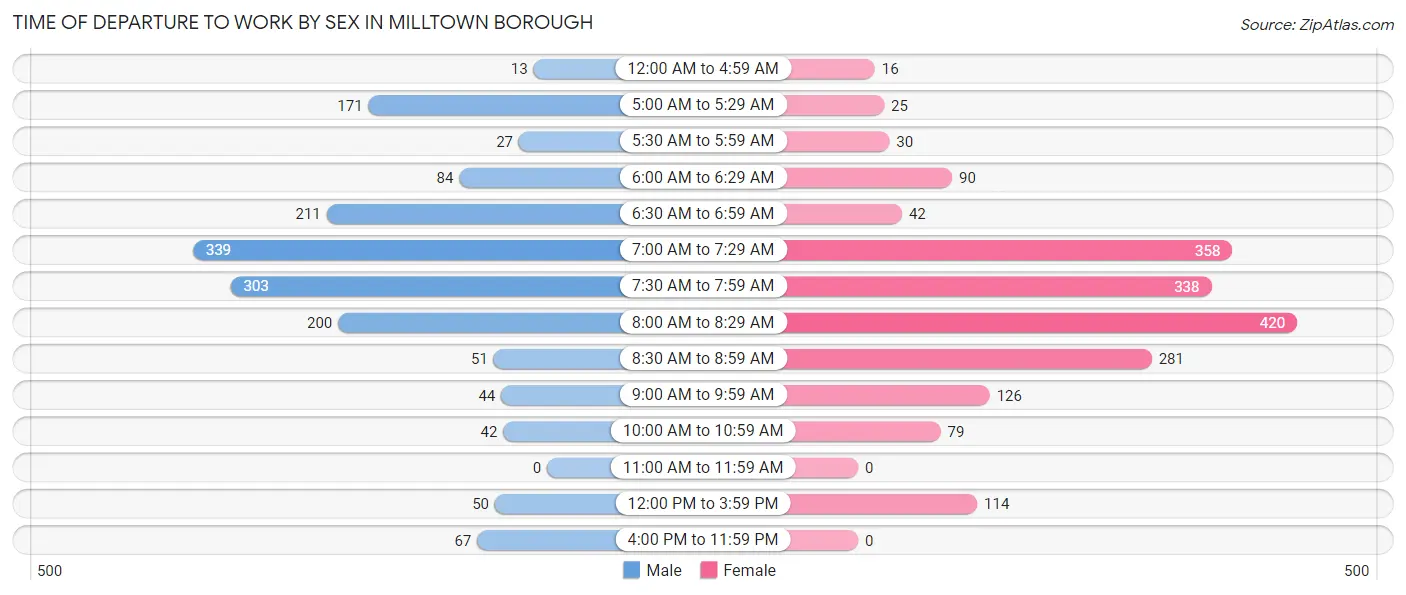
| Time of Departure | Male | Female |
| 12:00 AM to 4:59 AM | 13 (0.8%) | 16 (0.8%) |
| 5:00 AM to 5:29 AM | 171 (10.7%) | 25 (1.3%) |
| 5:30 AM to 5:59 AM | 27 (1.7%) | 30 (1.6%) |
| 6:00 AM to 6:29 AM | 84 (5.2%) | 90 (4.7%) |
| 6:30 AM to 6:59 AM | 211 (13.2%) | 42 (2.2%) |
| 7:00 AM to 7:29 AM | 339 (21.2%) | 358 (18.7%) |
| 7:30 AM to 7:59 AM | 303 (18.9%) | 338 (17.6%) |
| 8:00 AM to 8:29 AM | 200 (12.5%) | 420 (21.9%) |
| 8:30 AM to 8:59 AM | 51 (3.2%) | 281 (14.6%) |
| 9:00 AM to 9:59 AM | 44 (2.8%) | 126 (6.6%) |
| 10:00 AM to 10:59 AM | 42 (2.6%) | 79 (4.1%) |
| 11:00 AM to 11:59 AM | 0 (0.0%) | 0 (0.0%) |
| 12:00 PM to 3:59 PM | 50 (3.1%) | 114 (5.9%) |
| 4:00 PM to 11:59 PM | 67 (4.2%) | 0 (0.0%) |
| Total | 1,602 (100.0%) | 1,919 (100.0%) |
Housing Occupancy in Milltown borough
Occupancy by Ownership in Milltown borough
Of the total 2,496 dwellings in Milltown borough, owner-occupied units account for 2,012 (80.6%), while renter-occupied units make up 484 (19.4%).
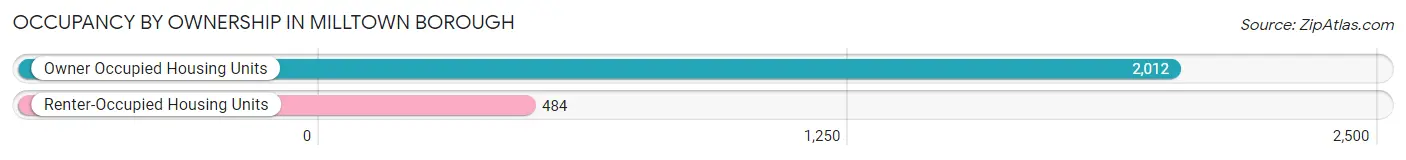
| Occupancy | # Housing Units | % Housing Units |
| Owner Occupied Housing Units | 2,012 | 80.6% |
| Renter-Occupied Housing Units | 484 | 19.4% |
| Total Occupied Housing Units | 2,496 | 100.0% |
Occupancy by Household Size in Milltown borough
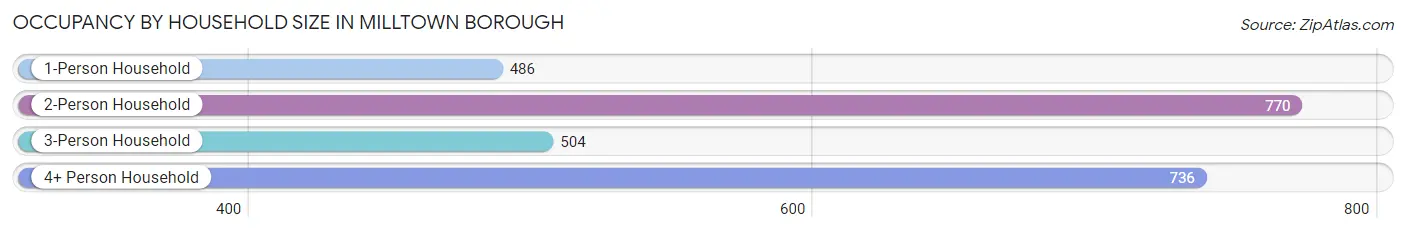
| Household Size | # Housing Units | % Housing Units |
| 1-Person Household | 486 | 19.5% |
| 2-Person Household | 770 | 30.8% |
| 3-Person Household | 504 | 20.2% |
| 4+ Person Household | 736 | 29.5% |
| Total Housing Units | 2,496 | 100.0% |
Occupancy by Ownership by Household Size in Milltown borough
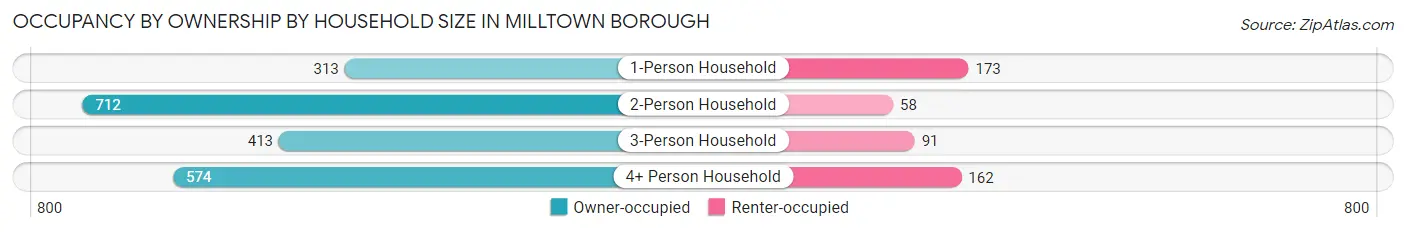
| Household Size | Owner-occupied | Renter-occupied |
| 1-Person Household | 313 (64.4%) | 173 (35.6%) |
| 2-Person Household | 712 (92.5%) | 58 (7.5%) |
| 3-Person Household | 413 (81.9%) | 91 (18.1%) |
| 4+ Person Household | 574 (78.0%) | 162 (22.0%) |
| Total Housing Units | 2,012 (80.6%) | 484 (19.4%) |
Occupancy by Educational Attainment in Milltown borough
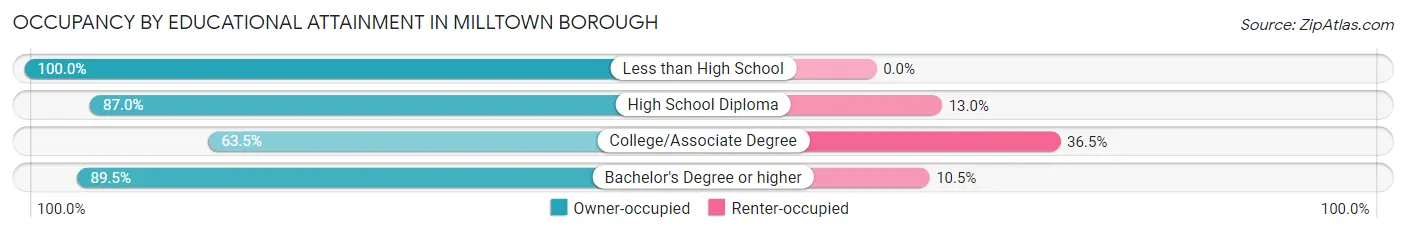
| Household Size | Owner-occupied | Renter-occupied |
| Less than High School | 83 (100.0%) | 0 (0.0%) |
| High School Diploma | 562 (87.0%) | 84 (13.0%) |
| College/Associate Degree | 524 (63.5%) | 301 (36.5%) |
| Bachelor's Degree or higher | 843 (89.5%) | 99 (10.5%) |
Occupancy by Age of Householder in Milltown borough
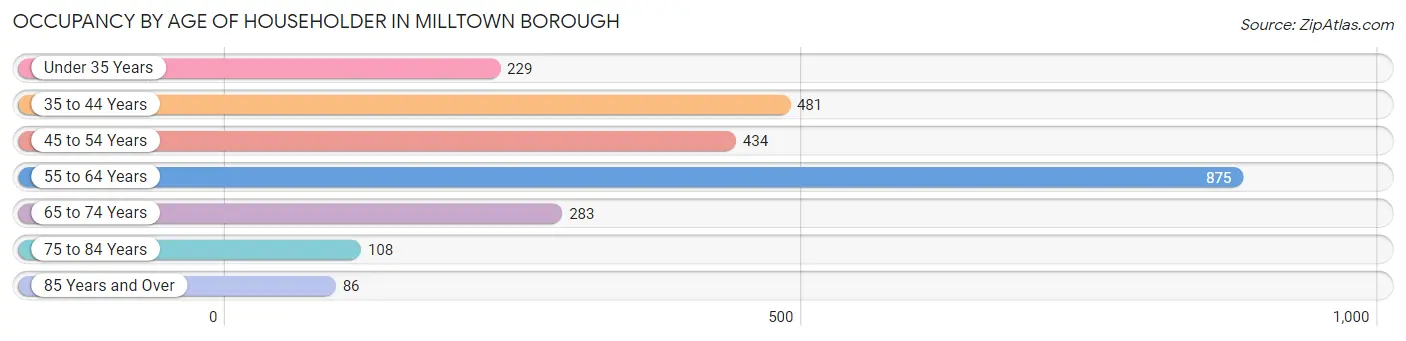
| Age Bracket | # Households | % Households |
| Under 35 Years | 229 | 9.2% |
| 35 to 44 Years | 481 | 19.3% |
| 45 to 54 Years | 434 | 17.4% |
| 55 to 64 Years | 875 | 35.1% |
| 65 to 74 Years | 283 | 11.3% |
| 75 to 84 Years | 108 | 4.3% |
| 85 Years and Over | 86 | 3.5% |
| Total | 2,496 | 100.0% |
Housing Finances in Milltown borough
Median Income by Occupancy in Milltown borough
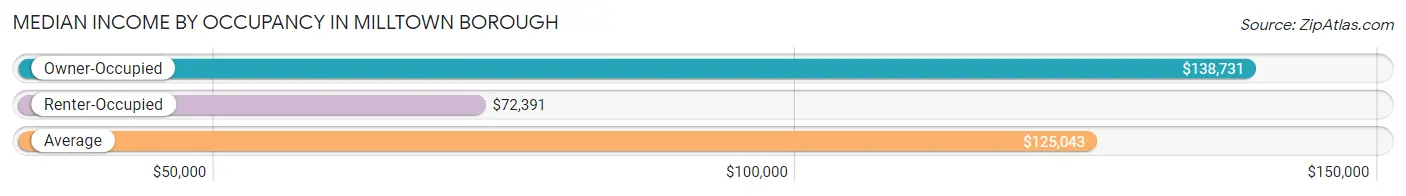
| Occupancy Type | # Households | Median Income |
| Owner-Occupied | 2,012 (80.6%) | $138,731 |
| Renter-Occupied | 484 (19.4%) | $72,391 |
| Average | 2,496 (100.0%) | $125,043 |
Occupancy by Householder Income Bracket in Milltown borough
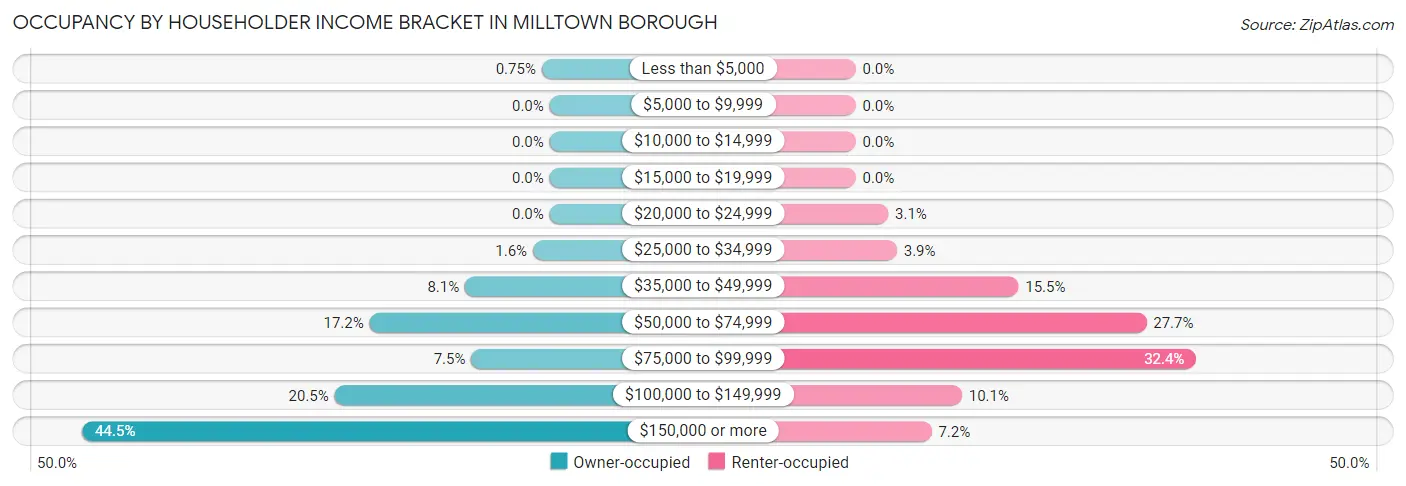
| Income Bracket | Owner-occupied | Renter-occupied |
| Less than $5,000 | 15 (0.7%) | 0 (0.0%) |
| $5,000 to $9,999 | 0 (0.0%) | 0 (0.0%) |
| $10,000 to $14,999 | 0 (0.0%) | 0 (0.0%) |
| $15,000 to $19,999 | 0 (0.0%) | 0 (0.0%) |
| $20,000 to $24,999 | 0 (0.0%) | 15 (3.1%) |
| $25,000 to $34,999 | 32 (1.6%) | 19 (3.9%) |
| $35,000 to $49,999 | 162 (8.1%) | 75 (15.5%) |
| $50,000 to $74,999 | 345 (17.2%) | 134 (27.7%) |
| $75,000 to $99,999 | 150 (7.5%) | 157 (32.4%) |
| $100,000 to $149,999 | 412 (20.5%) | 49 (10.1%) |
| $150,000 or more | 896 (44.5%) | 35 (7.2%) |
| Total | 2,012 (100.0%) | 484 (100.0%) |
Monthly Housing Cost Tiers in Milltown borough
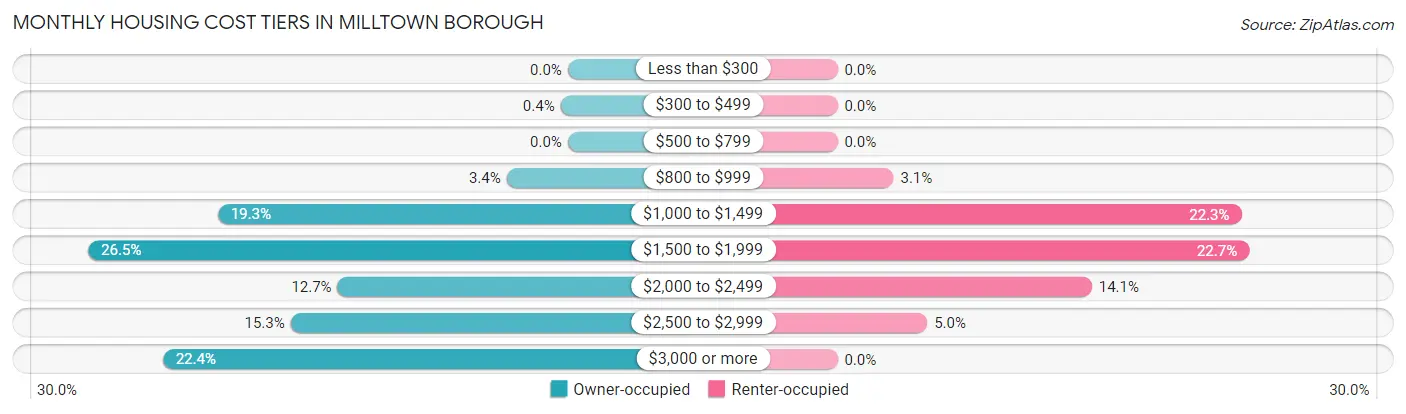
| Monthly Cost | Owner-occupied | Renter-occupied |
| Less than $300 | 0 (0.0%) | 0 (0.0%) |
| $300 to $499 | 8 (0.4%) | 0 (0.0%) |
| $500 to $799 | 0 (0.0%) | 0 (0.0%) |
| $800 to $999 | 68 (3.4%) | 15 (3.1%) |
| $1,000 to $1,499 | 389 (19.3%) | 108 (22.3%) |
| $1,500 to $1,999 | 533 (26.5%) | 110 (22.7%) |
| $2,000 to $2,499 | 256 (12.7%) | 68 (14.1%) |
| $2,500 to $2,999 | 308 (15.3%) | 24 (5.0%) |
| $3,000 or more | 450 (22.4%) | 0 (0.0%) |
| Total | 2,012 (100.0%) | 484 (100.0%) |
Physical Housing Characteristics in Milltown borough
Housing Structures in Milltown borough
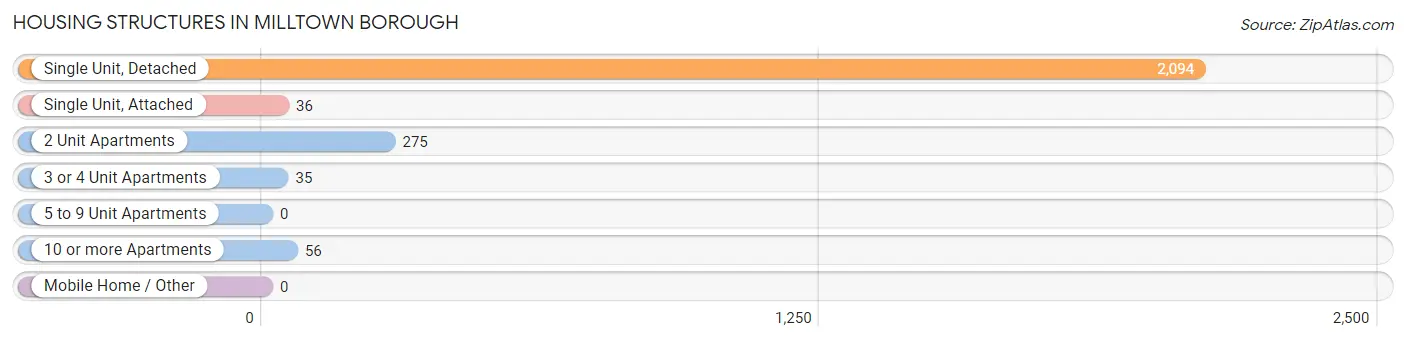
| Structure Type | # Housing Units | % Housing Units |
| Single Unit, Detached | 2,094 | 83.9% |
| Single Unit, Attached | 36 | 1.4% |
| 2 Unit Apartments | 275 | 11.0% |
| 3 or 4 Unit Apartments | 35 | 1.4% |
| 5 to 9 Unit Apartments | 0 | 0.0% |
| 10 or more Apartments | 56 | 2.2% |
| Mobile Home / Other | 0 | 0.0% |
| Total | 2,496 | 100.0% |
Housing Structures by Occupancy in Milltown borough
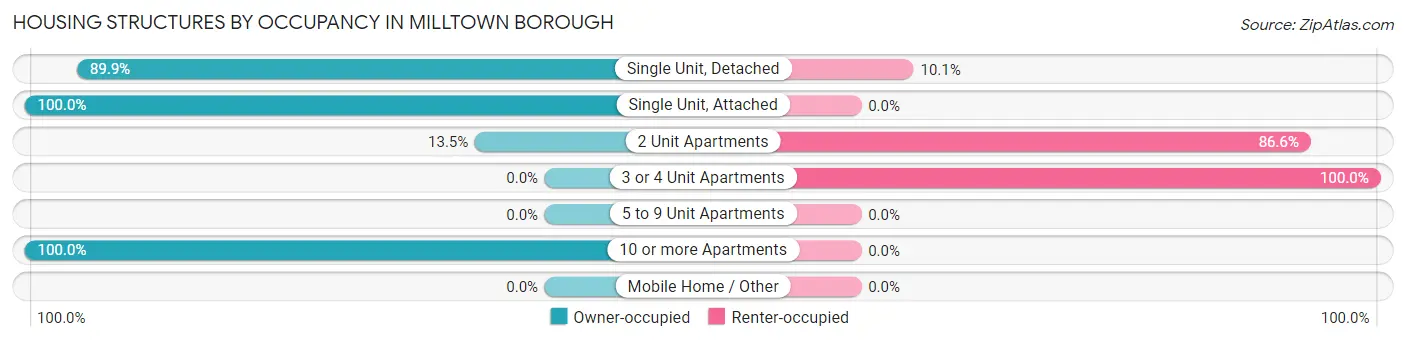
| Structure Type | Owner-occupied | Renter-occupied |
| Single Unit, Detached | 1,883 (89.9%) | 211 (10.1%) |
| Single Unit, Attached | 36 (100.0%) | 0 (0.0%) |
| 2 Unit Apartments | 37 (13.5%) | 238 (86.6%) |
| 3 or 4 Unit Apartments | 0 (0.0%) | 35 (100.0%) |
| 5 to 9 Unit Apartments | 0 (0.0%) | 0 (0.0%) |
| 10 or more Apartments | 56 (100.0%) | 0 (0.0%) |
| Mobile Home / Other | 0 (0.0%) | 0 (0.0%) |
| Total | 2,012 (80.6%) | 484 (19.4%) |
Housing Structures by Number of Rooms in Milltown borough
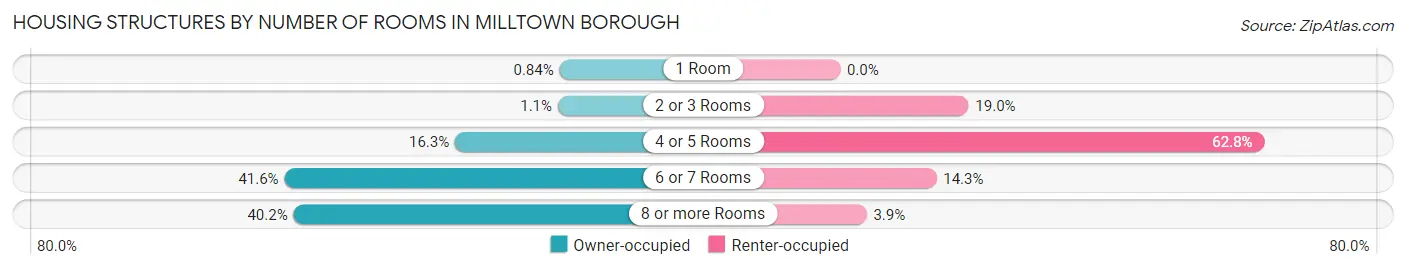
| Number of Rooms | Owner-occupied | Renter-occupied |
| 1 Room | 17 (0.8%) | 0 (0.0%) |
| 2 or 3 Rooms | 22 (1.1%) | 92 (19.0%) |
| 4 or 5 Rooms | 328 (16.3%) | 304 (62.8%) |
| 6 or 7 Rooms | 836 (41.5%) | 69 (14.3%) |
| 8 or more Rooms | 809 (40.2%) | 19 (3.9%) |
| Total | 2,012 (100.0%) | 484 (100.0%) |
Housing Structure by Heating Type in Milltown borough
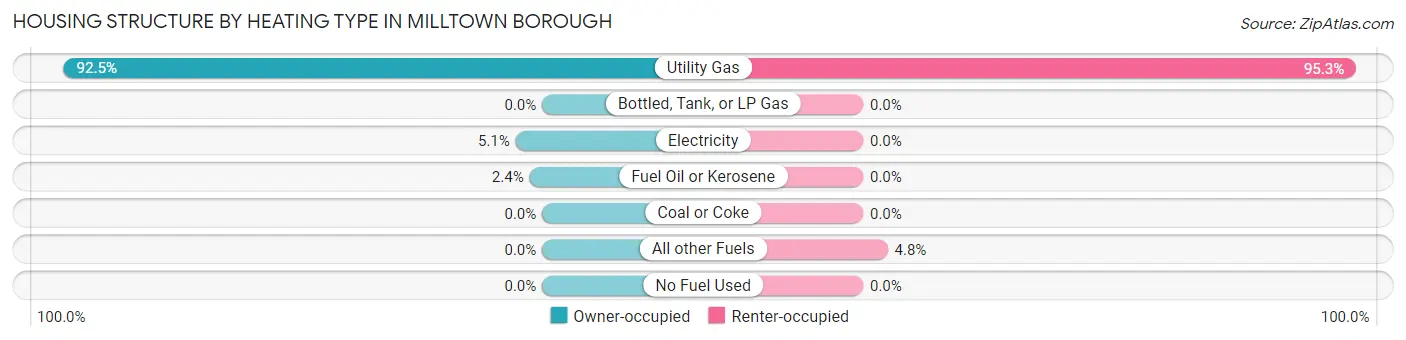
| Heating Type | Owner-occupied | Renter-occupied |
| Utility Gas | 1,860 (92.4%) | 461 (95.3%) |
| Bottled, Tank, or LP Gas | 0 (0.0%) | 0 (0.0%) |
| Electricity | 103 (5.1%) | 0 (0.0%) |
| Fuel Oil or Kerosene | 49 (2.4%) | 0 (0.0%) |
| Coal or Coke | 0 (0.0%) | 0 (0.0%) |
| All other Fuels | 0 (0.0%) | 23 (4.8%) |
| No Fuel Used | 0 (0.0%) | 0 (0.0%) |
| Total | 2,012 (100.0%) | 484 (100.0%) |
Household Vehicle Usage in Milltown borough
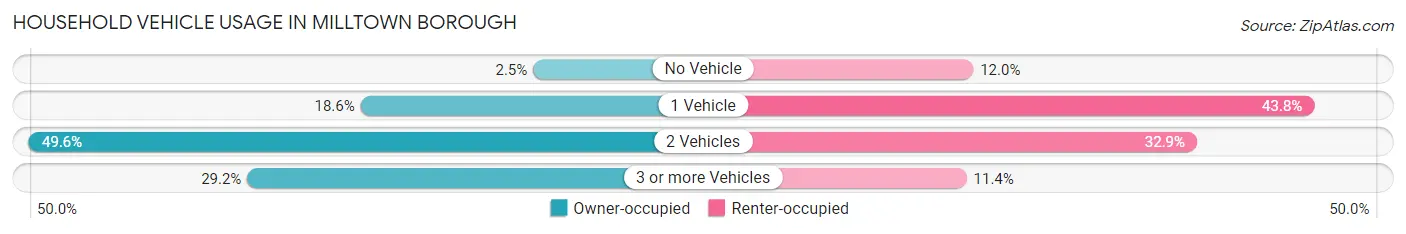
| Vehicles per Household | Owner-occupied | Renter-occupied |
| No Vehicle | 51 (2.5%) | 58 (12.0%) |
| 1 Vehicle | 375 (18.6%) | 212 (43.8%) |
| 2 Vehicles | 998 (49.6%) | 159 (32.9%) |
| 3 or more Vehicles | 588 (29.2%) | 55 (11.4%) |
| Total | 2,012 (100.0%) | 484 (100.0%) |
Real Estate & Mortgages in Milltown borough
Real Estate and Mortgage Overview in Milltown borough
| Characteristic | Without Mortgage | With Mortgage |
| Housing Units | 585 | 1,427 |
| Median Property Value | $409,600 | $404,500 |
| Median Household Income | $126,827 | $698 |
| Monthly Housing Costs | $1,377 | $450 |
| Real Estate Taxes | $10,001 | $0 |
Property Value by Mortgage Status in Milltown borough
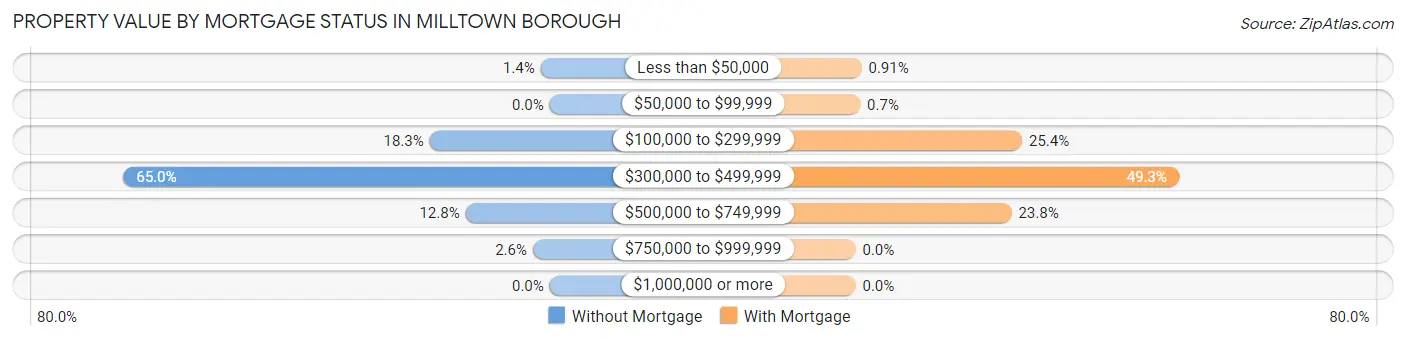
| Property Value | Without Mortgage | With Mortgage |
| Less than $50,000 | 8 (1.4%) | 13 (0.9%) |
| $50,000 to $99,999 | 0 (0.0%) | 10 (0.7%) |
| $100,000 to $299,999 | 107 (18.3%) | 362 (25.4%) |
| $300,000 to $499,999 | 380 (65.0%) | 703 (49.3%) |
| $500,000 to $749,999 | 75 (12.8%) | 339 (23.8%) |
| $750,000 to $999,999 | 15 (2.6%) | 0 (0.0%) |
| $1,000,000 or more | 0 (0.0%) | 0 (0.0%) |
| Total | 585 (100.0%) | 1,427 (100.0%) |
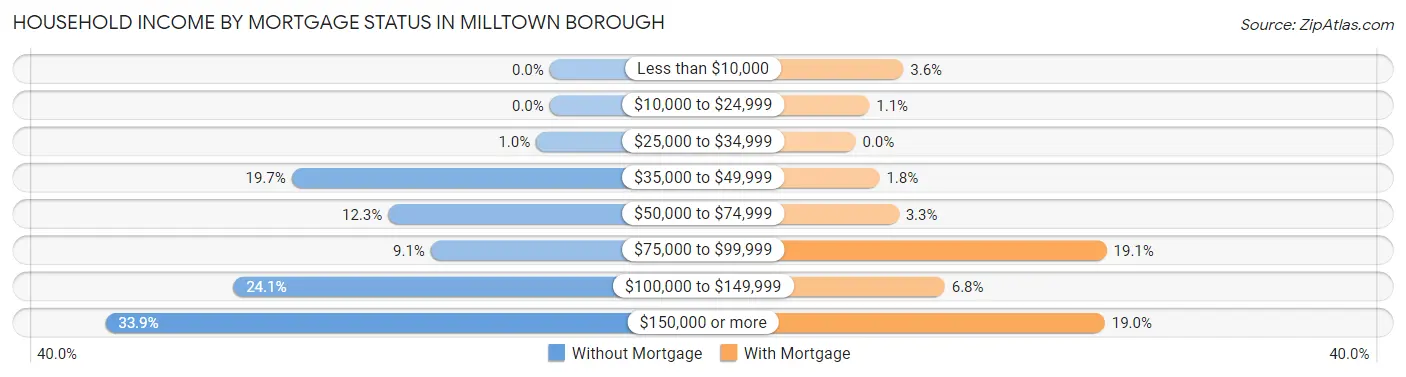
Household Income by Mortgage Status in Milltown borough
| Household Income | Without Mortgage | With Mortgage |
| Less than $10,000 | 0 (0.0%) | 52 (3.6%) |
| $10,000 to $24,999 | 0 (0.0%) | 15 (1.1%) |
| $25,000 to $34,999 | 6 (1.0%) | 0 (0.0%) |
| $35,000 to $49,999 | 115 (19.7%) | 26 (1.8%) |
| $50,000 to $74,999 | 72 (12.3%) | 47 (3.3%) |
| $75,000 to $99,999 | 53 (9.1%) | 273 (19.1%) |
| $100,000 to $149,999 | 141 (24.1%) | 97 (6.8%) |
| $150,000 or more | 198 (33.9%) | 271 (19.0%) |
| Total | 585 (100.0%) | 1,427 (100.0%) |
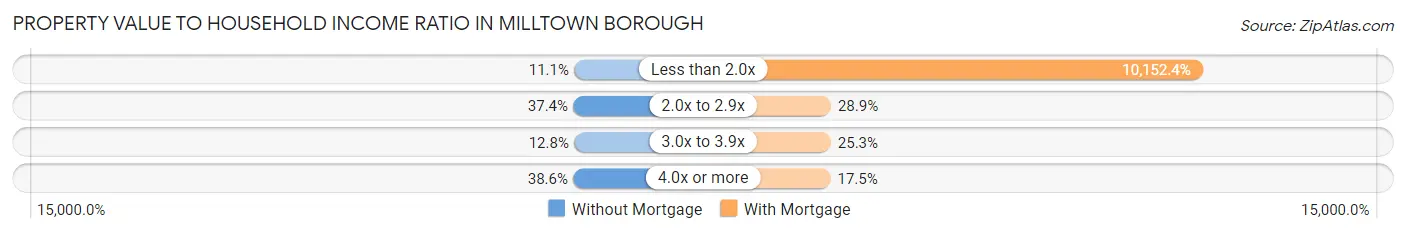
Property Value to Household Income Ratio in Milltown borough
| Value-to-Income Ratio | Without Mortgage | With Mortgage |
| Less than 2.0x | 65 (11.1%) | 144,875 (10,152.4%) |
| 2.0x to 2.9x | 219 (37.4%) | 412 (28.9%) |
| 3.0x to 3.9x | 75 (12.8%) | 361 (25.3%) |
| 4.0x or more | 226 (38.6%) | 250 (17.5%) |
| Total | 585 (100.0%) | 1,427 (100.0%) |
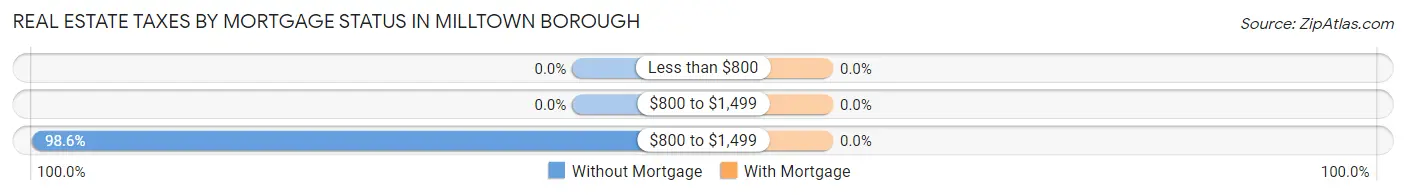
Real Estate Taxes by Mortgage Status in Milltown borough
| Property Taxes | Without Mortgage | With Mortgage |
| Less than $800 | 0 (0.0%) | 0 (0.0%) |
| $800 to $1,499 | 0 (0.0%) | 0 (0.0%) |
| $800 to $1,499 | 577 (98.6%) | 0 (0.0%) |
| Total | 585 (100.0%) | 1,427 (100.0%) |
Health & Disability in Milltown borough
Health Insurance Coverage by Age in Milltown borough
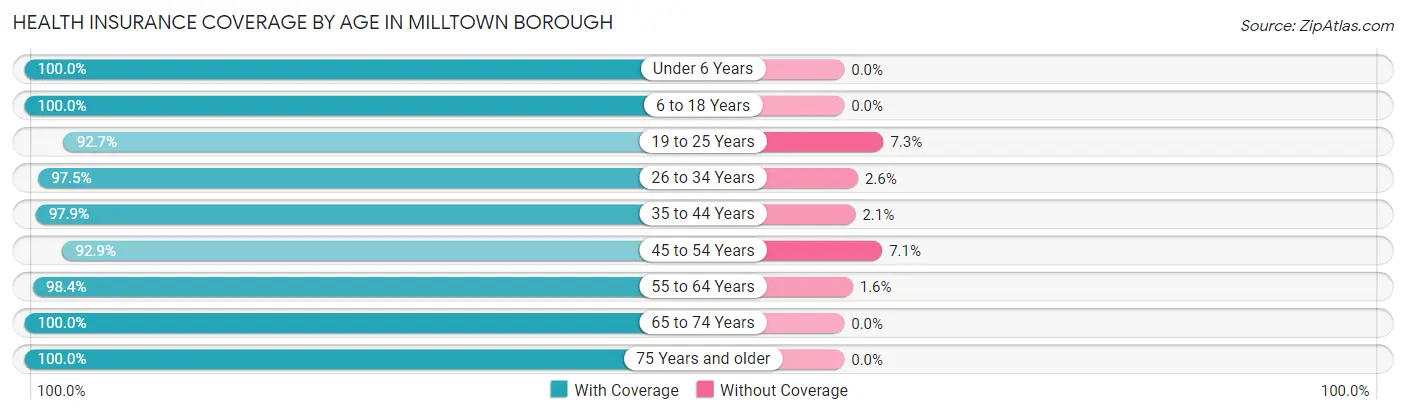
| Age Bracket | With Coverage | Without Coverage |
| Under 6 Years | 666 (100.0%) | 0 (0.0%) |
| 6 to 18 Years | 1,040 (100.0%) | 0 (0.0%) |
| 19 to 25 Years | 241 (92.7%) | 19 (7.3%) |
| 26 to 34 Years | 802 (97.5%) | 21 (2.5%) |
| 35 to 44 Years | 1,132 (97.9%) | 24 (2.1%) |
| 45 to 54 Years | 800 (92.9%) | 61 (7.1%) |
| 55 to 64 Years | 1,306 (98.4%) | 21 (1.6%) |
| 65 to 74 Years | 564 (100.0%) | 0 (0.0%) |
| 75 Years and older | 320 (100.0%) | 0 (0.0%) |
| Total | 6,871 (97.9%) | 146 (2.1%) |
Health Insurance Coverage by Citizenship Status in Milltown borough
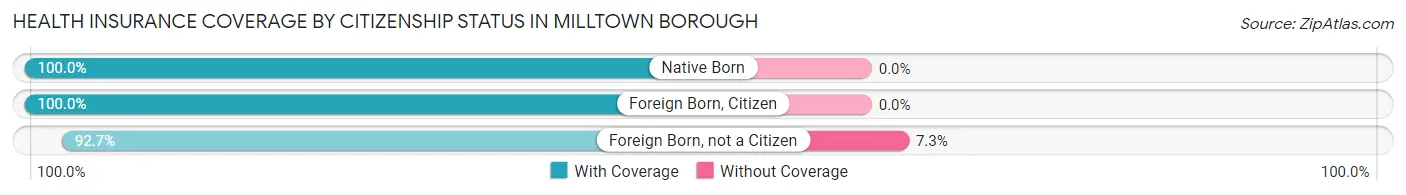
| Citizenship Status | With Coverage | Without Coverage |
| Native Born | 666 (100.0%) | 0 (0.0%) |
| Foreign Born, Citizen | 1,040 (100.0%) | 0 (0.0%) |
| Foreign Born, not a Citizen | 241 (92.7%) | 19 (7.3%) |
Health Insurance Coverage by Household Income in Milltown borough
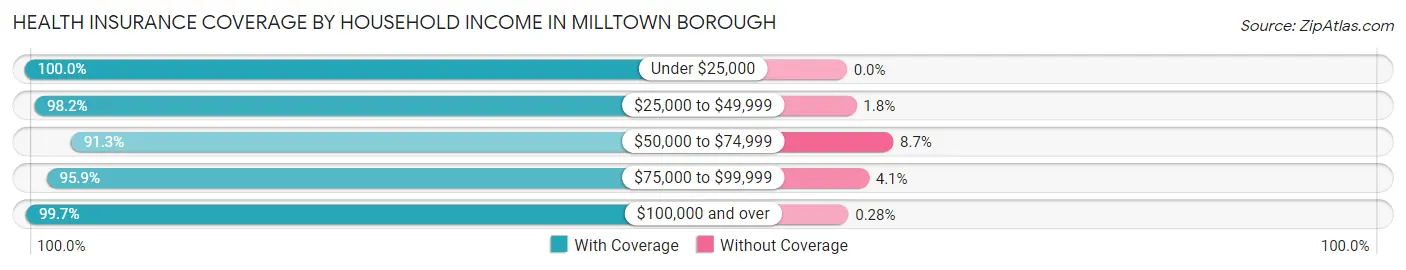
| Household Income | With Coverage | Without Coverage |
| Under $25,000 | 58 (100.0%) | 0 (0.0%) |
| $25,000 to $49,999 | 656 (98.2%) | 12 (1.8%) |
| $50,000 to $74,999 | 1,022 (91.3%) | 97 (8.7%) |
| $75,000 to $99,999 | 558 (95.9%) | 24 (4.1%) |
| $100,000 and over | 4,572 (99.7%) | 13 (0.3%) |
Public vs Private Health Insurance Coverage by Age in Milltown borough
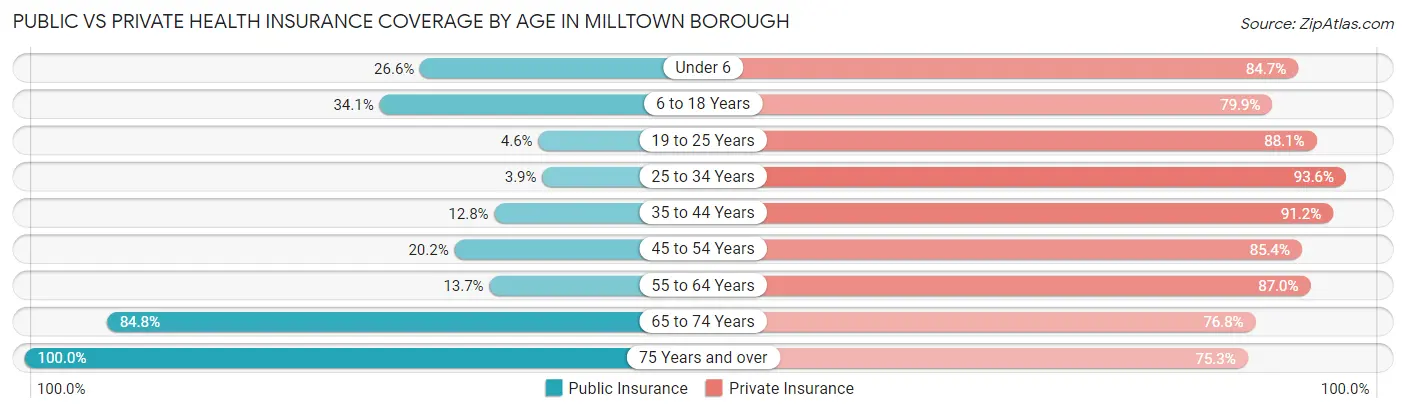
| Age Bracket | Public Insurance | Private Insurance |
| Under 6 | 177 (26.6%) | 564 (84.7%) |
| 6 to 18 Years | 355 (34.1%) | 831 (79.9%) |
| 19 to 25 Years | 12 (4.6%) | 229 (88.1%) |
| 25 to 34 Years | 32 (3.9%) | 770 (93.6%) |
| 35 to 44 Years | 148 (12.8%) | 1,054 (91.2%) |
| 45 to 54 Years | 174 (20.2%) | 735 (85.4%) |
| 55 to 64 Years | 182 (13.7%) | 1,154 (87.0%) |
| 65 to 74 Years | 478 (84.8%) | 433 (76.8%) |
| 75 Years and over | 320 (100.0%) | 241 (75.3%) |
| Total | 1,878 (26.8%) | 6,011 (85.7%) |
Disability Status by Sex by Age in Milltown borough
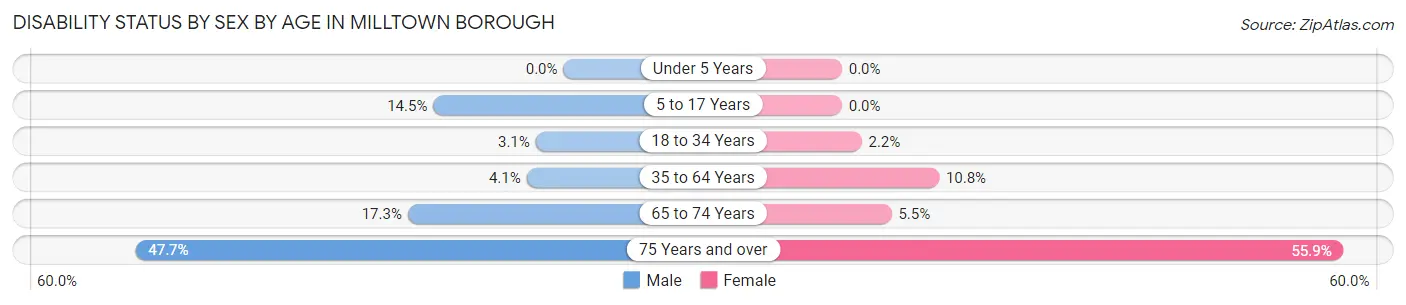
| Age Bracket | Male | Female |
| Under 5 Years | 0 (0.0%) | 0 (0.0%) |
| 5 to 17 Years | 81 (14.5%) | 0 (0.0%) |
| 18 to 34 Years | 16 (3.1%) | 13 (2.2%) |
| 35 to 64 Years | 56 (4.1%) | 214 (10.8%) |
| 65 to 74 Years | 57 (17.3%) | 13 (5.5%) |
| 75 Years and over | 51 (47.7%) | 119 (55.9%) |
Disability Class by Sex by Age in Milltown borough
Disability Class: Hearing Difficulty
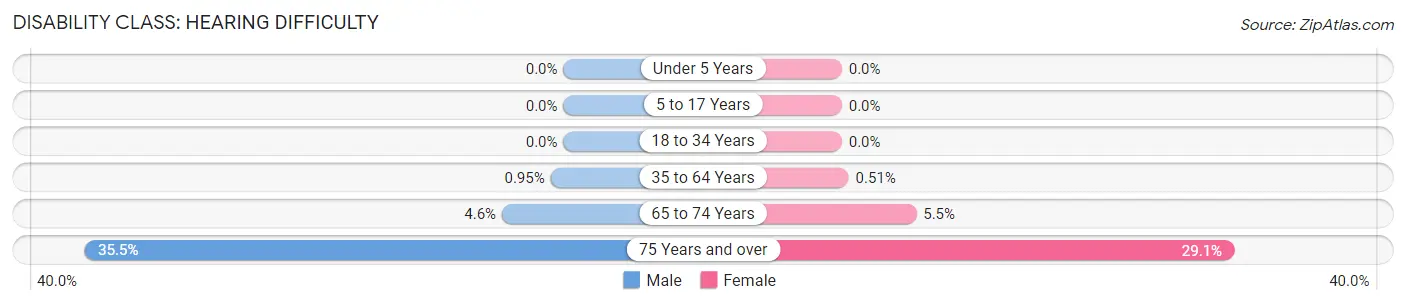
| Age Bracket | Male | Female |
| Under 5 Years | 0 (0.0%) | 0 (0.0%) |
| 5 to 17 Years | 0 (0.0%) | 0 (0.0%) |
| 18 to 34 Years | 0 (0.0%) | 0 (0.0%) |
| 35 to 64 Years | 13 (0.9%) | 10 (0.5%) |
| 65 to 74 Years | 15 (4.6%) | 13 (5.5%) |
| 75 Years and over | 38 (35.5%) | 62 (29.1%) |
Disability Class: Vision Difficulty
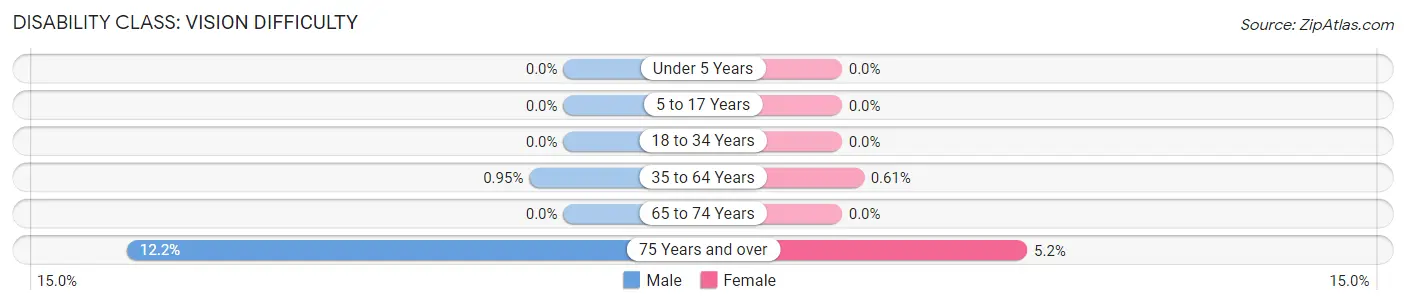
| Age Bracket | Male | Female |
| Under 5 Years | 0 (0.0%) | 0 (0.0%) |
| 5 to 17 Years | 0 (0.0%) | 0 (0.0%) |
| 18 to 34 Years | 0 (0.0%) | 0 (0.0%) |
| 35 to 64 Years | 13 (0.9%) | 12 (0.6%) |
| 65 to 74 Years | 0 (0.0%) | 0 (0.0%) |
| 75 Years and over | 13 (12.1%) | 11 (5.2%) |
Disability Class: Cognitive Difficulty
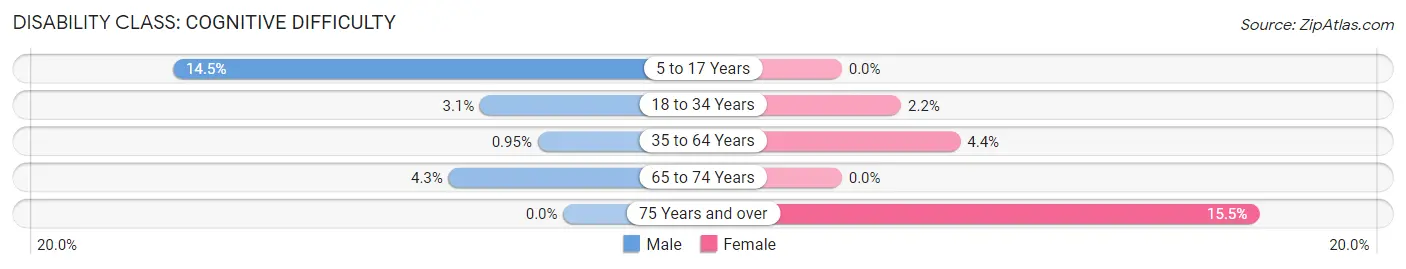
| Age Bracket | Male | Female |
| 5 to 17 Years | 81 (14.5%) | 0 (0.0%) |
| 18 to 34 Years | 16 (3.1%) | 13 (2.2%) |
| 35 to 64 Years | 13 (0.9%) | 87 (4.4%) |
| 65 to 74 Years | 14 (4.3%) | 0 (0.0%) |
| 75 Years and over | 0 (0.0%) | 33 (15.5%) |
Disability Class: Ambulatory Difficulty
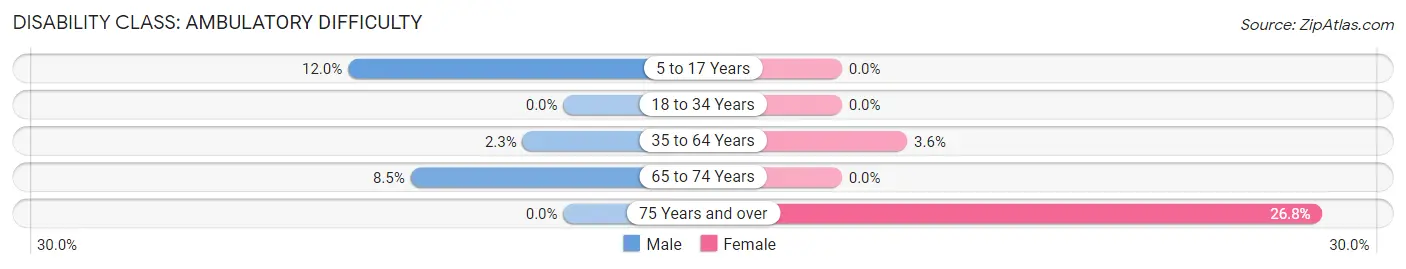
| Age Bracket | Male | Female |
| 5 to 17 Years | 67 (12.0%) | 0 (0.0%) |
| 18 to 34 Years | 0 (0.0%) | 0 (0.0%) |
| 35 to 64 Years | 31 (2.3%) | 72 (3.6%) |
| 65 to 74 Years | 28 (8.5%) | 0 (0.0%) |
| 75 Years and over | 0 (0.0%) | 57 (26.8%) |
Disability Class: Self-Care Difficulty
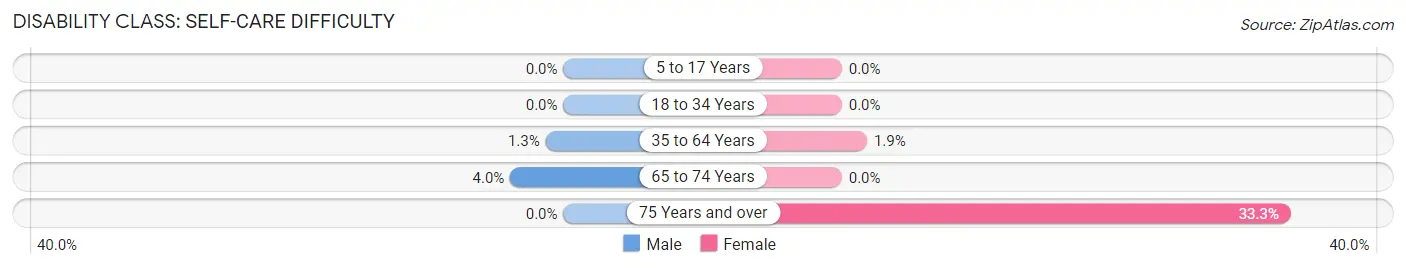
| Age Bracket | Male | Female |
| 5 to 17 Years | 0 (0.0%) | 0 (0.0%) |
| 18 to 34 Years | 0 (0.0%) | 0 (0.0%) |
| 35 to 64 Years | 18 (1.3%) | 37 (1.9%) |
| 65 to 74 Years | 13 (4.0%) | 0 (0.0%) |
| 75 Years and over | 0 (0.0%) | 71 (33.3%) |
Technology Access in Milltown borough
Computing Device Access in Milltown borough
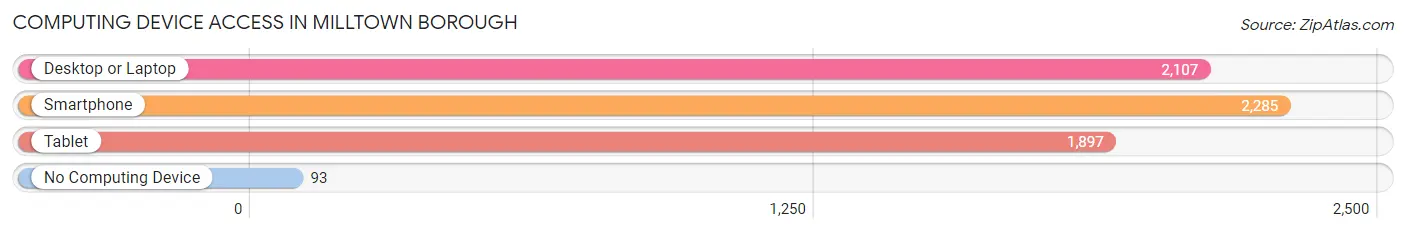
| Device Type | # Households | % Households |
| Desktop or Laptop | 2,107 | 84.4% |
| Smartphone | 2,285 | 91.5% |
| Tablet | 1,897 | 76.0% |
| No Computing Device | 93 | 3.7% |
| Total | 2,496 | 100.0% |
Internet Access in Milltown borough
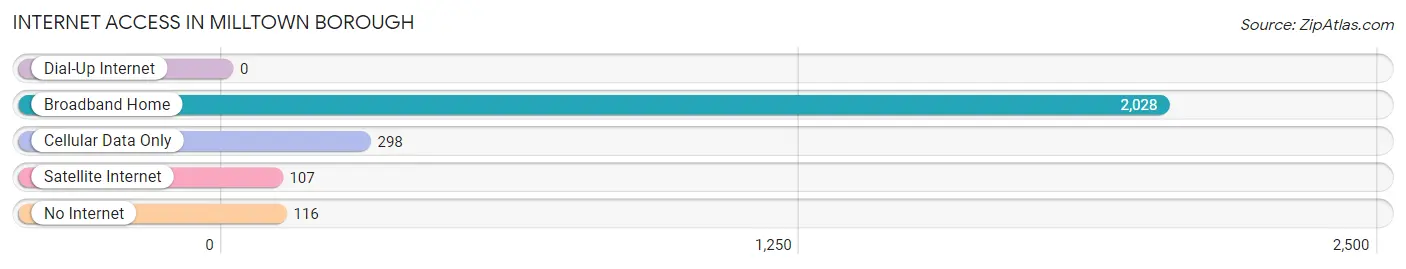
| Internet Type | # Households | % Households |
| Dial-Up Internet | 0 | 0.0% |
| Broadband Home | 2,028 | 81.2% |
| Cellular Data Only | 298 | 11.9% |
| Satellite Internet | 107 | 4.3% |
| No Internet | 116 | 4.6% |
| Total | 2,496 | 100.0% |
Milltown borough Summary
Introduction
Milltown Borough is a small borough located in Middlesex County, New Jersey. It is situated in the Raritan Valley region of Central New Jersey and is bordered by East Brunswick Township, New Brunswick, and North Brunswick Township. The borough has a population of 6,893 as of the 2010 census and is home to a diverse population of people from different backgrounds.
History
Milltown was originally part of East Brunswick Township, which was established in 1798. In 1889, the area was incorporated as a borough and named after the mill that was located in the area. The mill was owned by the Van Liew family, who were prominent in the area. The mill was used to grind grain and produce flour.
The borough was home to a variety of industries, including a brickyard, a paper mill, and a canning factory. The borough also had a thriving agricultural industry, with farms producing a variety of crops, including potatoes, corn, and tomatoes.
In the early 20th century, the borough began to experience a population boom as people moved to the area for the jobs that were available. The population peaked in the 1950s, when the borough had a population of over 10,000.
Geography
Milltown Borough is located in Central New Jersey, in the Raritan Valley region. It is bordered by East Brunswick Township, New Brunswick, and North Brunswick Township. The borough is situated on the Raritan River, which is a major tributary of the Delaware River.
The borough has a total area of 1.3 square miles, all of which is land. The borough is mostly flat, with some rolling hills in the northern part of the borough. The borough is located in the humid subtropical climate zone, with hot, humid summers and cold, wet winters.
Economy
Milltown Borough has a diverse economy, with a variety of industries located in the borough. The largest employers in the borough are the Rutgers University Medical Center, the Robert Wood Johnson University Hospital, and the Johnson & Johnson Corporation.
The borough also has a thriving retail sector, with a variety of stores located in the downtown area. The borough is home to a variety of restaurants, bars, and cafes, as well as a number of small businesses.
Demographics
As of the 2010 census, the population of Milltown Borough was 6,893. The population is diverse, with a variety of ethnic and racial backgrounds represented. The largest racial group is White (77.2%), followed by Hispanic or Latino (13.2%), Asian (4.2%), and African American (3.3%).
The median household income in the borough is $63,917, and the median family income is $76,917. The per capita income is $30,917. The poverty rate is 8.3%, which is lower than the national average.
Conclusion
Milltown Borough is a small borough located in Middlesex County, New Jersey. It is situated in the Raritan Valley region of Central New Jersey and is bordered by East Brunswick Township, New Brunswick, and North Brunswick Township. The borough has a population of 6,893 as of the 2010 census and is home to a diverse population of people from different backgrounds. The borough has a diverse economy, with a variety of industries located in the borough. The largest employers in the borough are the Rutgers University Medical Center, the Robert Wood Johnson University Hospital, and the Johnson & Johnson Corporation. The median household income in the borough is $63,917, and the median family income is $76,917. The per capita income is $30,917. The poverty rate is 8.3%, which is lower than the national average.
Common Questions
What is Per Capita Income in Milltown borough?
Per Capita income in Milltown borough is $50,395.
What is the Median Family Income in Milltown borough?
Median Family Income in Milltown borough is $137,631.
What is the Median Household income in Milltown borough?
Median Household Income in Milltown borough is $125,043.
What is Income or Wage Gap in Milltown borough?
Income or Wage Gap in Milltown borough is 27.6%.
Women in Milltown borough earn 72.4 cents for every dollar earned by a man.
What is Inequality or Gini Index in Milltown borough?
Inequality or Gini Index in Milltown borough is 0.34.
What is the Total Population of Milltown borough?
Total Population of Milltown borough is 7,017.
What is the Total Male Population of Milltown borough?
Total Male Population of Milltown borough is 3,267.
What is the Total Female Population of Milltown borough?
Total Female Population of Milltown borough is 3,750.
What is the Ratio of Males per 100 Females in Milltown borough?
There are 87.12 Males per 100 Females in Milltown borough.
What is the Ratio of Females per 100 Males in Milltown borough?
There are 114.78 Females per 100 Males in Milltown borough.
What is the Median Population Age in Milltown borough?
Median Population Age in Milltown borough is 41.5 Years.
What is the Average Family Size in Milltown borough
Average Family Size in Milltown borough is 3.2 People.
What is the Average Household Size in Milltown borough
Average Household Size in Milltown borough is 2.8 People.
How Large is the Labor Force in Milltown borough?
There are 4,159 People in the Labor Forcein in Milltown borough.
What is the Percentage of People in the Labor Force in Milltown borough?
74.7% of People are in the Labor Force in Milltown borough.
What is the Unemployment Rate in Milltown borough?
Unemployment Rate in Milltown borough is 4.9%.