Cities with the Highest Percentage of Immigrants from Malaysia in New Jersey
RELATED REPORTS & OPTIONS
Malaysia
New Jersey
Compare Cities
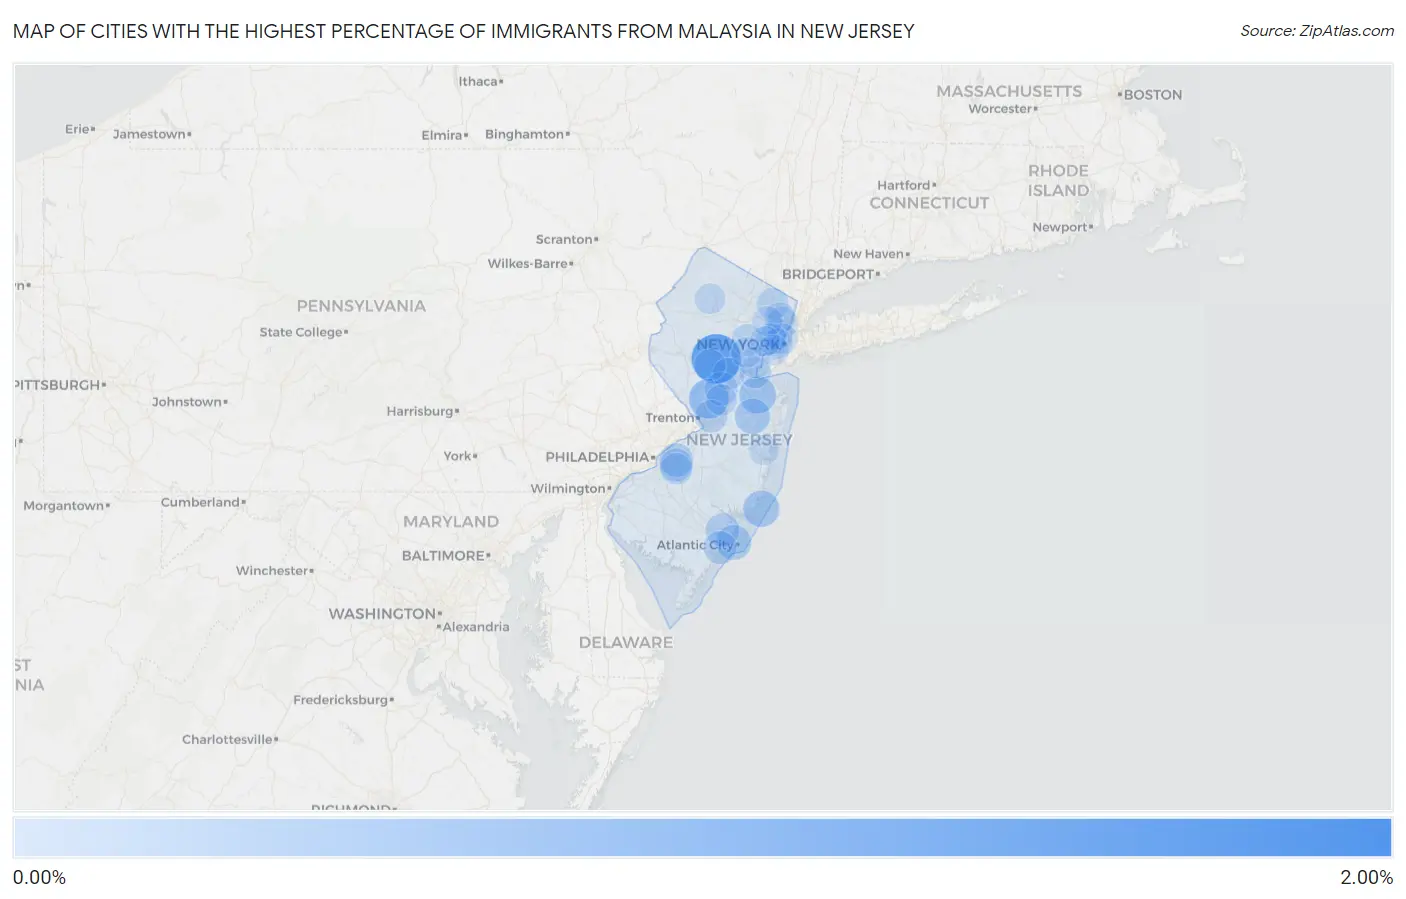
Map of Cities with the Highest Percentage of Immigrants from Malaysia in New Jersey
0.00%
2.00%
Cities with the Highest Percentage of Immigrants from Malaysia in New Jersey
| City | Malaysia | vs State | vs National | |
| 1. | Rockaway Borough | 1.52% | 0.022%(+1.50)#-1 | 0.025%(+1.49)#0 |
| 2. | Green Knoll | 1.13% | 0.022%(+1.11)#0 | 0.025%(+1.11)#1 |
| 3. | Edgewater Borough | 0.93% | 0.022%(+0.909)#1 | 0.025%(+0.906)#2 |
| 4. | Princeton | 0.54% | 0.022%(+0.517)#2 | 0.025%(+0.514)#3 |
| 5. | Cookstown | 0.49% | 0.022%(+0.471)#3 | 0.025%(+0.468)#4 |
| 6. | Lyons | 0.41% | 0.022%(+0.390)#4 | 0.025%(+0.387)#5 |
| 7. | Morganville | 0.39% | 0.022%(+0.366)#5 | 0.025%(+0.363)#6 |
| 8. | Cedar Knolls | 0.38% | 0.022%(+0.361)#6 | 0.025%(+0.358)#7 |
| 9. | North Beach Haven | 0.36% | 0.022%(+0.334)#7 | 0.025%(+0.331)#8 |
| 10. | Englewood Cliffs Borough | 0.36% | 0.022%(+0.333)#8 | 0.025%(+0.330)#9 |
| 11. | Beachwood Borough | 0.30% | 0.022%(+0.280)#9 | 0.025%(+0.277)#10 |
| 12. | West Freehold | 0.30% | 0.022%(+0.276)#10 | 0.025%(+0.273)#11 |
| 13. | Allendale Borough | 0.29% | 0.022%(+0.271)#11 | 0.025%(+0.268)#12 |
| 14. | Atlantic City | 0.29% | 0.022%(+0.264)#12 | 0.025%(+0.261)#1,503 |
| 15. | Englishtown Borough | 0.28% | 0.022%(+0.260)#13 | 0.025%(+0.257)#1,504 |
| 16. | Fairview Borough | 0.25% | 0.022%(+0.232)#14 | 0.025%(+0.229)#1,505 |
| 17. | Tenafly Borough | 0.25% | 0.022%(+0.226)#15 | 0.025%(+0.223)#1,506 |
| 18. | Fort Lee Borough | 0.24% | 0.022%(+0.222)#16 | 0.025%(+0.219)#1,507 |
| 19. | Oradell Borough | 0.24% | 0.022%(+0.222)#17 | 0.025%(+0.219)#1,508 |
| 20. | Pomona | 0.19% | 0.022%(+0.170)#18 | 0.025%(+0.167)#1,509 |
| 21. | Ramblewood | 0.19% | 0.022%(+0.168)#19 | 0.025%(+0.165)#1,510 |
| 22. | Kendall Park | 0.19% | 0.022%(+0.166)#20 | 0.025%(+0.163)#1,511 |
| 23. | Roselle Park Borough | 0.18% | 0.022%(+0.157)#21 | 0.025%(+0.154)#1,512 |
| 24. | Linwood | 0.16% | 0.022%(+0.136)#22 | 0.025%(+0.133)#1,513 |
| 25. | Greentree | 0.15% | 0.022%(+0.132)#23 | 0.025%(+0.129)#1,514 |
| 26. | Hamilton Square | 0.14% | 0.022%(+0.121)#24 | 0.025%(+0.118)#1,515 |
| 27. | Somerset | 0.10% | 0.022%(+0.081)#25 | 0.025%(+0.078)#1,516 |
| 28. | Ridgewood | 0.092% | 0.022%(+0.070)#26 | 0.025%(+0.067)#1,517 |
| 29. | Springdale | 0.092% | 0.022%(+0.070)#27 | 0.025%(+0.067)#1,518 |
| 30. | Short Hills | 0.090% | 0.022%(+0.068)#28 | 0.025%(+0.065)#1,519 |
| 31. | New Providence Borough | 0.088% | 0.022%(+0.066)#29 | 0.025%(+0.063)#1,520 |
| 32. | Perth Amboy | 0.078% | 0.022%(+0.056)#30 | 0.025%(+0.053)#1,521 |
| 33. | Bradley Gardens | 0.077% | 0.022%(+0.055)#31 | 0.025%(+0.052)#1,522 |
| 34. | Eatontown Borough | 0.074% | 0.022%(+0.052)#32 | 0.025%(+0.049)#1,523 |
| 35. | Ridgefield Park | 0.068% | 0.022%(+0.046)#33 | 0.025%(+0.043)#1,524 |
| 36. | Sayreville Borough | 0.064% | 0.022%(+0.042)#34 | 0.025%(+0.039)#1,525 |
| 37. | Avenel | 0.058% | 0.022%(+0.036)#35 | 0.025%(+0.033)#1,526 |
| 38. | Princeton Meadows | 0.051% | 0.022%(+0.029)#36 | 0.025%(+0.026)#1,527 |
| 39. | Parsippany | 0.050% | 0.022%(+0.028)#37 | 0.025%(+0.026)#1,528 |
| 40. | Bergenfield Borough | 0.046% | 0.022%(+0.024)#38 | 0.025%(+0.021)#1,529 |
| 41. | Paramus Borough | 0.038% | 0.022%(+0.016)#39 | 0.025%(+0.013)#1,530 |
| 42. | Secaucus | 0.037% | 0.022%(+0.015)#40 | 0.025%(+0.012)#1,531 |
| 43. | Lake Mohawk | 0.031% | 0.022%(+0.009)#41 | 0.025%(+0.006)#1,532 |
| 44. | Hackensack | 0.028% | 0.022%(+0.006)#42 | 0.025%(+0.003)#1,533 |
| 45. | Hoboken | 0.026% | 0.022%(+0.004)#43 | 0.025%(+0.001)#1,534 |
| 46. | Madison Borough | 0.024% | 0.022%(+0.002)#44 | 0.025%(-0.001)#1,535 |
| 47. | Jersey City | 0.023% | 0.022%(+0.001)#45 | 0.025%(-0.002)#1,536 |
| 48. | Kearny | 0.022% | 0.022%(-0.000)#46 | 0.025%(-0.003)#1,537 |
| 49. | Bayonne | 0.021% | 0.022%(-0.001)#47 | 0.025%(-0.004)#1,538 |
| 50. | Hopatcong Borough | 0.021% | 0.022%(-0.001)#48 | 0.025%(-0.004)#1,539 |
| 51. | Westfield | 0.019% | 0.022%(-0.003)#49 | 0.025%(-0.005)#1,540 |
| 52. | Clifton | 0.011% | 0.022%(-0.011)#50 | 0.025%(-0.014)#1,541 |
| 53. | Toms River | 0.0075% | 0.022%(-0.014)#51 | 0.025%(-0.017)#1,542 |
| 54. | Newark | 0.0042% | 0.022%(-0.018)#52 | 0.025%(-0.021)#1,543 |
Common Questions
What are the Top 10 Cities with the Highest Percentage of Immigrants from Malaysia in New Jersey?
Top 10 Cities with the Highest Percentage of Immigrants from Malaysia in New Jersey are:
#1
1.13%
#2
0.54%
#3
0.39%
#4
0.36%
#5
0.30%
#6
0.29%
#7
0.19%
#8
0.19%
#9
0.19%
#10
0.16%
What city has the Highest Percentage of Immigrants from Malaysia in New Jersey?
Green Knoll has the Highest Percentage of Immigrants from Malaysia in New Jersey with 1.13%.
What is the Percentage of Immigrants from Malaysia in the State of New Jersey?
Percentage of Immigrants from Malaysia in New Jersey is 0.022%.
What is the Percentage of Immigrants from Malaysia in the United States?
Percentage of Immigrants from Malaysia in the United States is 0.025%.