Mullica Hill, NJ Map & Demographics
Mullica Hill Map
Mullica Hill Overview
$47,514
PER CAPITA INCOME
$148,750
AVG FAMILY INCOME
$123,265
AVG HOUSEHOLD INCOME
36.7%
WAGE / INCOME GAP [ % ]
63.3¢/ $1
WAGE / INCOME GAP [ $ ]
$17,954
FAMILY INCOME DEFICIT
0.35
INEQUALITY / GINI INDEX
4,454
TOTAL POPULATION
2,175
MALE POPULATION
2,279
FEMALE POPULATION
95.44
MALES / 100 FEMALES
104.78
FEMALES / 100 MALES
41.0
MEDIAN AGE
3.3
AVG FAMILY SIZE
2.8
AVG HOUSEHOLD SIZE
2,162
LABOR FORCE [ PEOPLE ]
60.7%
PERCENT IN LABOR FORCE
4.9%
UNEMPLOYMENT RATE
Mullica Hill Zip Codes
Income in Mullica Hill
Income Overview in Mullica Hill
Per Capita Income in Mullica Hill is $47,514, while median incomes of families and households are $148,750 and $123,265 respectively.
| Characteristic | Number | Measure |
| Per Capita Income | 4,454 | $47,514 |
| Median Family Income | 1,196 | $148,750 |
| Mean Family Income | 1,196 | $150,366 |
| Median Household Income | 1,558 | $123,265 |
| Mean Household Income | 1,558 | $134,094 |
| Income Deficit | 1,196 | $17,954 |
| Wage / Income Gap (%) | 4,454 | 36.67% |
| Wage / Income Gap ($) | 4,454 | 63.33¢ per $1 |
| Gini / Inequality Index | 4,454 | 0.35 |
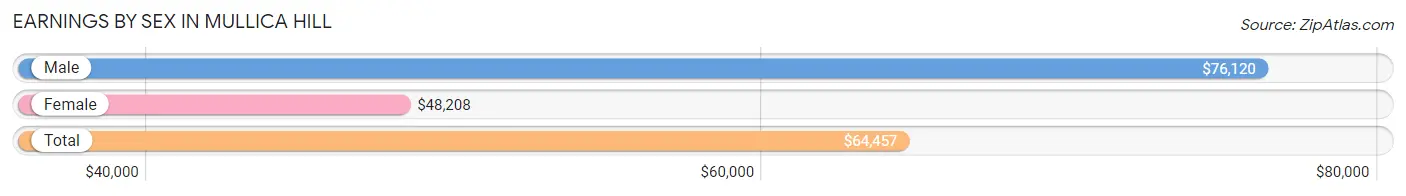
Earnings by Sex in Mullica Hill
Average Earnings in Mullica Hill are $64,457, $76,120 for men and $48,208 for women, a difference of 36.7%.
| Sex | Number | Average Earnings |
| Male | 1,213 (53.0%) | $76,120 |
| Female | 1,077 (47.0%) | $48,208 |
| Total | 2,290 (100.0%) | $64,457 |
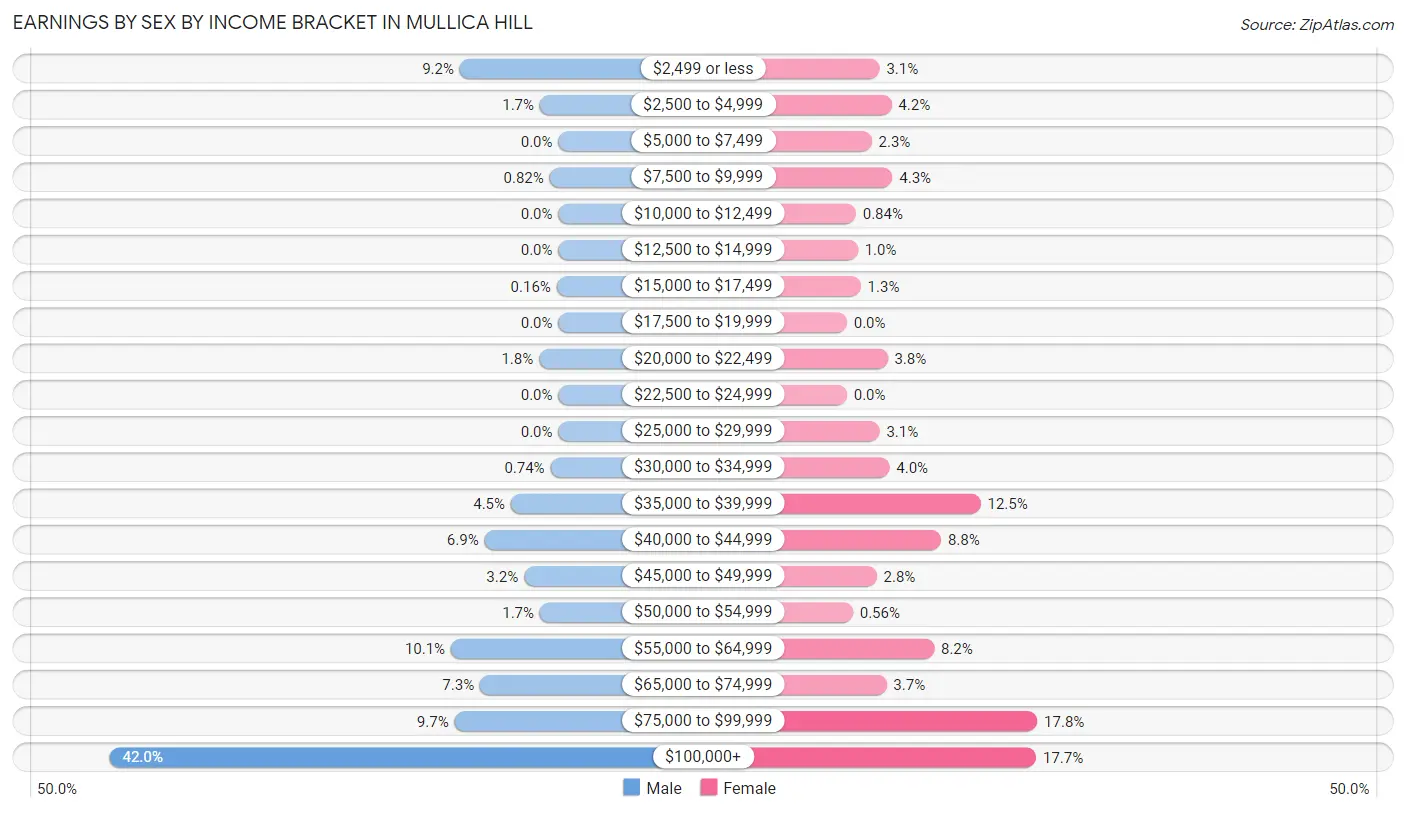
Earnings by Sex by Income Bracket in Mullica Hill
The most common earnings brackets in Mullica Hill are $100,000+ for men (510 | 42.0%) and $75,000 to $99,999 for women (192 | 17.8%).
| Income | Male | Female |
| $2,499 or less | 112 (9.2%) | 33 (3.1%) |
| $2,500 to $4,999 | 21 (1.7%) | 45 (4.2%) |
| $5,000 to $7,499 | 0 (0.0%) | 25 (2.3%) |
| $7,500 to $9,999 | 10 (0.8%) | 46 (4.3%) |
| $10,000 to $12,499 | 0 (0.0%) | 9 (0.8%) |
| $12,500 to $14,999 | 0 (0.0%) | 11 (1.0%) |
| $15,000 to $17,499 | 2 (0.2%) | 14 (1.3%) |
| $17,500 to $19,999 | 0 (0.0%) | 0 (0.0%) |
| $20,000 to $22,499 | 22 (1.8%) | 41 (3.8%) |
| $22,500 to $24,999 | 0 (0.0%) | 0 (0.0%) |
| $25,000 to $29,999 | 0 (0.0%) | 33 (3.1%) |
| $30,000 to $34,999 | 9 (0.7%) | 43 (4.0%) |
| $35,000 to $39,999 | 54 (4.4%) | 135 (12.5%) |
| $40,000 to $44,999 | 84 (6.9%) | 95 (8.8%) |
| $45,000 to $49,999 | 39 (3.2%) | 30 (2.8%) |
| $50,000 to $54,999 | 21 (1.7%) | 6 (0.6%) |
| $55,000 to $64,999 | 122 (10.1%) | 88 (8.2%) |
| $65,000 to $74,999 | 89 (7.3%) | 40 (3.7%) |
| $75,000 to $99,999 | 118 (9.7%) | 192 (17.8%) |
| $100,000+ | 510 (42.0%) | 191 (17.7%) |
| Total | 1,213 (100.0%) | 1,077 (100.0%) |
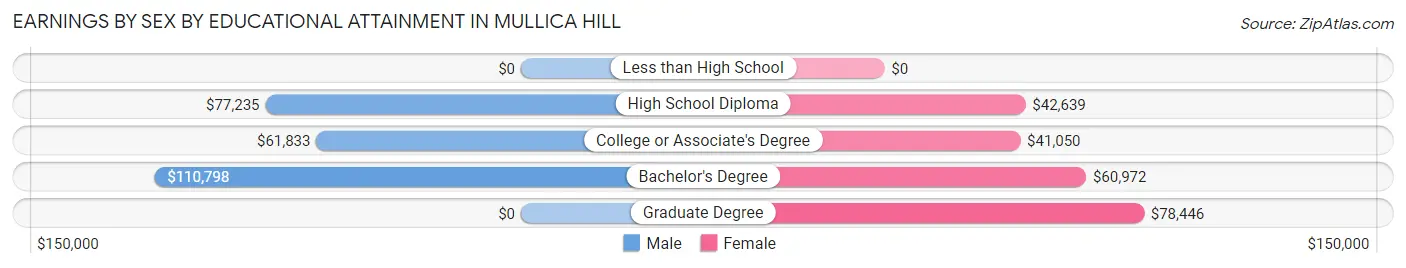
Earnings by Sex by Educational Attainment in Mullica Hill
Average earnings in Mullica Hill are $90,536 for men and $56,311 for women, a difference of 37.8%. Men with an educational attainment of bachelor's degree enjoy the highest average annual earnings of $110,798, while those with college or associate's degree education earn the least with $61,833. Women with an educational attainment of graduate degree earn the most with the average annual earnings of $78,446, while those with college or associate's degree education have the smallest earnings of $41,050.
| Educational Attainment | Male Income | Female Income |
| Less than High School | - | - |
| High School Diploma | $77,235 | $42,639 |
| College or Associate's Degree | $61,833 | $41,050 |
| Bachelor's Degree | $110,798 | $60,972 |
| Graduate Degree | - | - |
| Total | $90,536 | $56,311 |
Family Income in Mullica Hill
Family Income Brackets in Mullica Hill
According to the Mullica Hill family income data, there are 332 families falling into the $200,000+ income range, which is the most common income bracket and makes up 27.8% of all families.
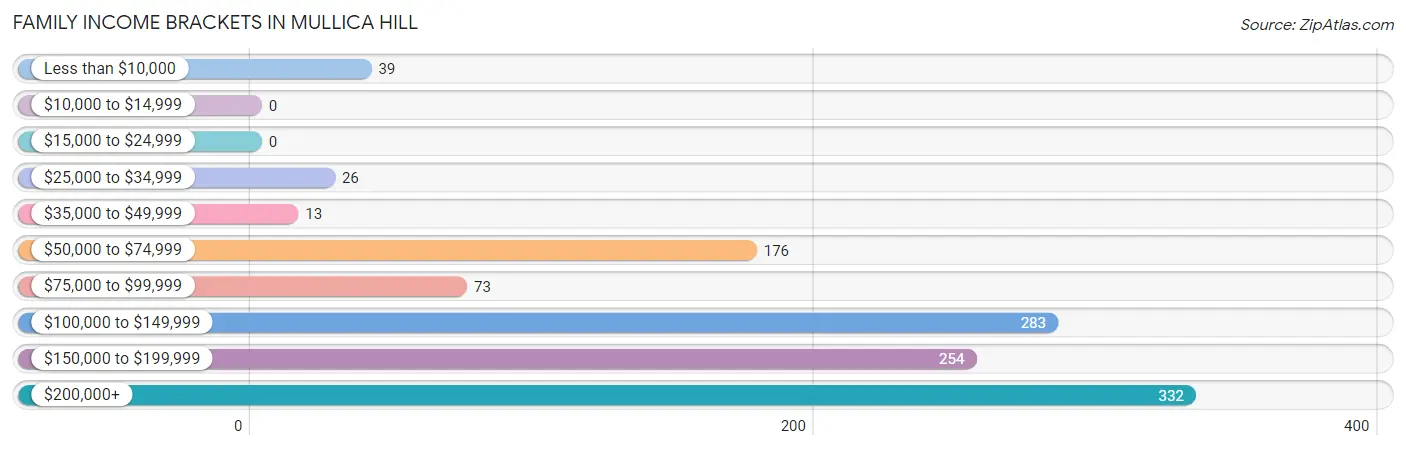
| Income Bracket | # Families | % Families |
| Less than $10,000 | 39 | 3.3% |
| $10,000 to $14,999 | 0 | 0.0% |
| $15,000 to $24,999 | 0 | 0.0% |
| $25,000 to $34,999 | 26 | 2.2% |
| $35,000 to $49,999 | 13 | 1.1% |
| $50,000 to $74,999 | 176 | 14.7% |
| $75,000 to $99,999 | 73 | 6.1% |
| $100,000 to $149,999 | 283 | 23.7% |
| $150,000 to $199,999 | 254 | 21.2% |
| $200,000+ | 332 | 27.8% |
Family Income by Famaliy Size in Mullica Hill
6-person families (47 | 3.9%) account for the highest median family income in Mullica Hill with $221,208 per family, while 3-person families (353 | 29.5%) have the highest median income of $57,102 per family member.
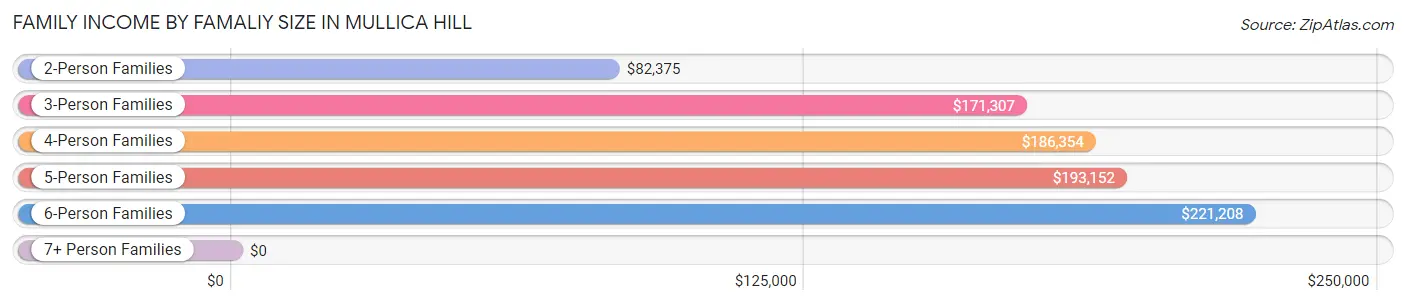
| Income Bracket | # Families | Median Income |
| 2-Person Families | 447 (37.4%) | $82,375 |
| 3-Person Families | 353 (29.5%) | $171,307 |
| 4-Person Families | 233 (19.5%) | $186,354 |
| 5-Person Families | 116 (9.7%) | $193,152 |
| 6-Person Families | 47 (3.9%) | $221,208 |
| 7+ Person Families | 0 (0.0%) | $0 |
| Total | 1,196 (100.0%) | $148,750 |
Family Income by Number of Earners in Mullica Hill
The median family income in Mullica Hill is $148,750, with families comprising 2 earners (590) having the highest median family income of $193,533, while families with no earners (206) have the lowest median family income of $73,919, accounting for 49.3% and 17.2% of families, respectively.
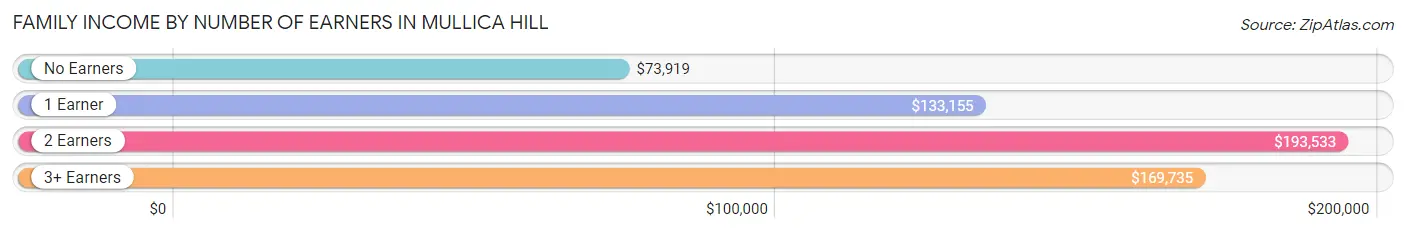
| Number of Earners | # Families | Median Income |
| No Earners | 206 (17.2%) | $73,919 |
| 1 Earner | 261 (21.8%) | $133,155 |
| 2 Earners | 590 (49.3%) | $193,533 |
| 3+ Earners | 139 (11.6%) | $169,735 |
| Total | 1,196 (100.0%) | $148,750 |
Household Income in Mullica Hill
Household Income Brackets in Mullica Hill
With 365 households falling in the category, the $100,000 to $149,999 income range is the most frequent in Mullica Hill, accounting for 23.4% of all households.
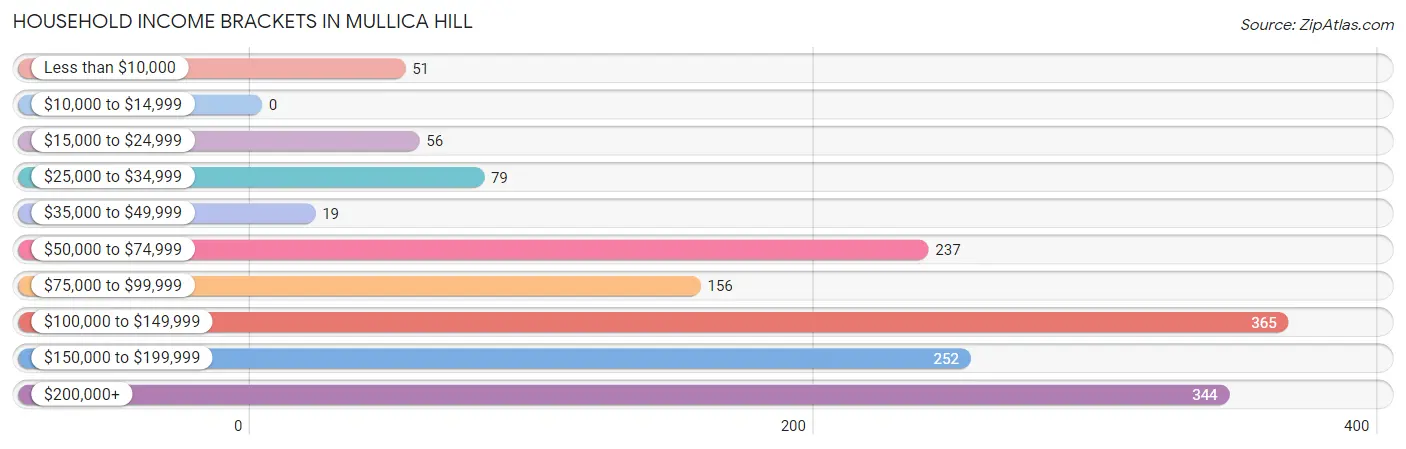
| Income Bracket | # Households | % Households |
| Less than $10,000 | 51 | 3.3% |
| $10,000 to $14,999 | 0 | 0.0% |
| $15,000 to $24,999 | 56 | 3.6% |
| $25,000 to $34,999 | 79 | 5.1% |
| $35,000 to $49,999 | 19 | 1.2% |
| $50,000 to $74,999 | 237 | 15.2% |
| $75,000 to $99,999 | 156 | 10.0% |
| $100,000 to $149,999 | 365 | 23.4% |
| $150,000 to $199,999 | 252 | 16.2% |
| $200,000+ | 344 | 22.1% |
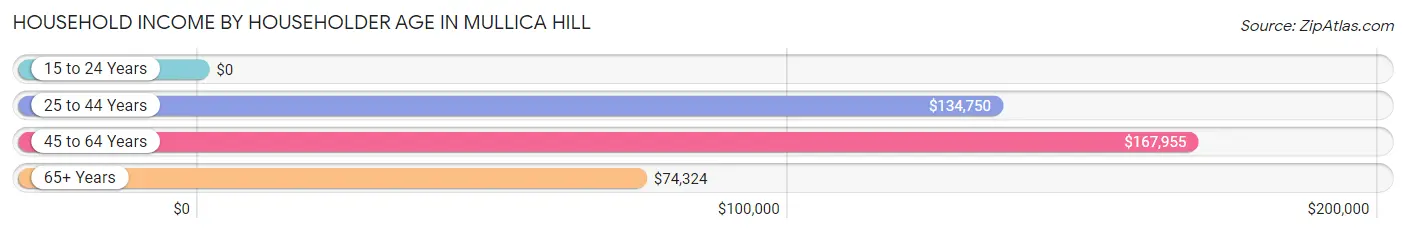
Household Income by Householder Age in Mullica Hill
The median household income in Mullica Hill is $123,265, with the highest median household income of $167,955 found in the 45 to 64 years age bracket for the primary householder. A total of 700 households (44.9%) fall into this category.
| Income Bracket | # Households | Median Income |
| 15 to 24 Years | 0 (0.0%) | $0 |
| 25 to 44 Years | 396 (25.4%) | $134,750 |
| 45 to 64 Years | 700 (44.9%) | $167,955 |
| 65+ Years | 462 (29.6%) | $74,324 |
| Total | 1,558 (100.0%) | $123,265 |
Poverty in Mullica Hill
Income Below Poverty by Sex and Age in Mullica Hill
With 6.5% poverty level for males and 6.9% for females among the residents of Mullica Hill, 6 to 11 year old males and 18 to 24 year old females are the most vulnerable to poverty, with 24 males (25.3%) and 33 females (22.0%) in their respective age groups living below the poverty level.
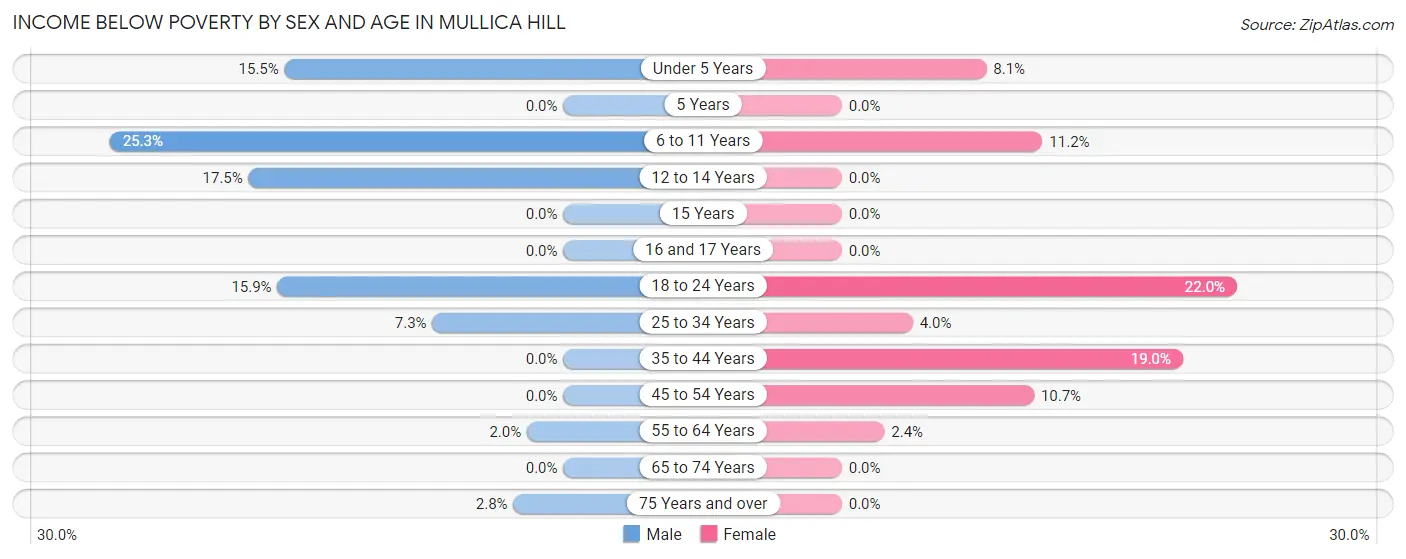
| Age Bracket | Male | Female |
| Under 5 Years | 36 (15.5%) | 14 (8.1%) |
| 5 Years | 0 (0.0%) | 0 (0.0%) |
| 6 to 11 Years | 24 (25.3%) | 20 (11.2%) |
| 12 to 14 Years | 17 (17.5%) | 0 (0.0%) |
| 15 Years | 0 (0.0%) | 0 (0.0%) |
| 16 and 17 Years | 0 (0.0%) | 0 (0.0%) |
| 18 to 24 Years | 32 (15.9%) | 33 (22.0%) |
| 25 to 34 Years | 21 (7.3%) | 12 (4.0%) |
| 35 to 44 Years | 0 (0.0%) | 34 (19.0%) |
| 45 to 54 Years | 0 (0.0%) | 32 (10.7%) |
| 55 to 64 Years | 8 (2.0%) | 11 (2.4%) |
| 65 to 74 Years | 0 (0.0%) | 0 (0.0%) |
| 75 Years and over | 3 (2.8%) | 0 (0.0%) |
| Total | 141 (6.5%) | 156 (6.9%) |
Income Above Poverty by Sex and Age in Mullica Hill
According to the poverty statistics in Mullica Hill, males aged 15 years and females aged 5 years are the age groups that are most secure financially, with 100.0% of males and 100.0% of females in these age groups living above the poverty line.
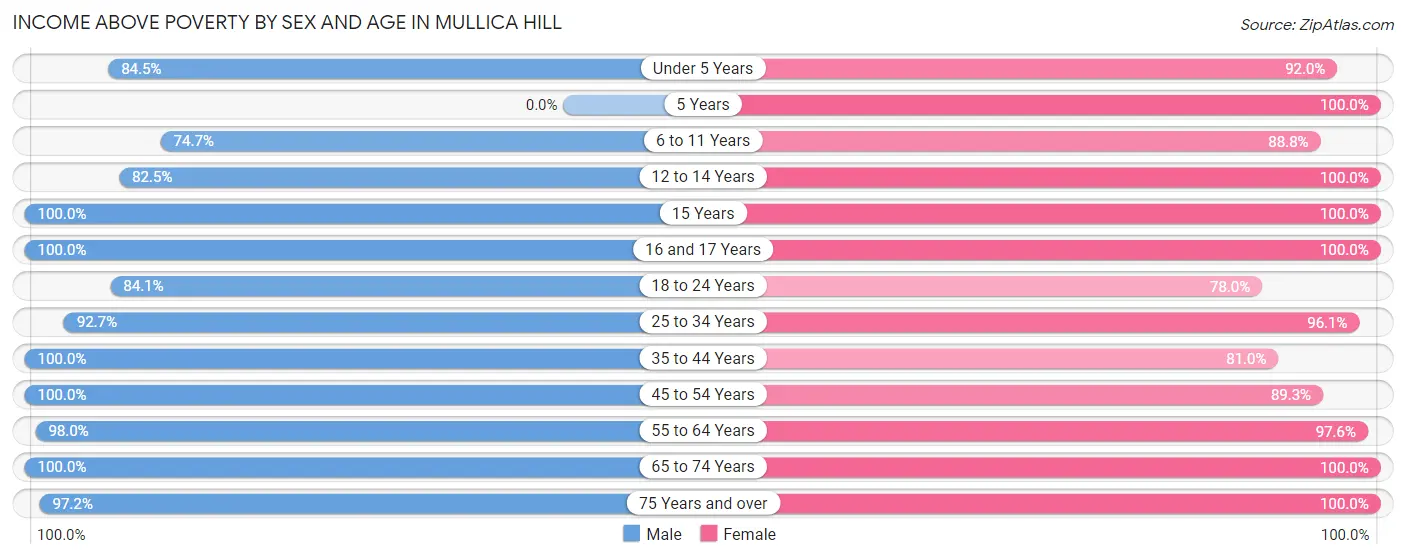
| Age Bracket | Male | Female |
| Under 5 Years | 196 (84.5%) | 160 (91.9%) |
| 5 Years | 0 (0.0%) | 12 (100.0%) |
| 6 to 11 Years | 71 (74.7%) | 159 (88.8%) |
| 12 to 14 Years | 80 (82.5%) | 30 (100.0%) |
| 15 Years | 42 (100.0%) | 31 (100.0%) |
| 16 and 17 Years | 106 (100.0%) | 67 (100.0%) |
| 18 to 24 Years | 169 (84.1%) | 117 (78.0%) |
| 25 to 34 Years | 267 (92.7%) | 292 (96.1%) |
| 35 to 44 Years | 225 (100.0%) | 145 (81.0%) |
| 45 to 54 Years | 134 (100.0%) | 267 (89.3%) |
| 55 to 64 Years | 388 (98.0%) | 453 (97.6%) |
| 65 to 74 Years | 251 (100.0%) | 279 (100.0%) |
| 75 Years and over | 105 (97.2%) | 111 (100.0%) |
| Total | 2,034 (93.5%) | 2,123 (93.1%) |
Income Below Poverty Among Married-Couple Families in Mullica Hill
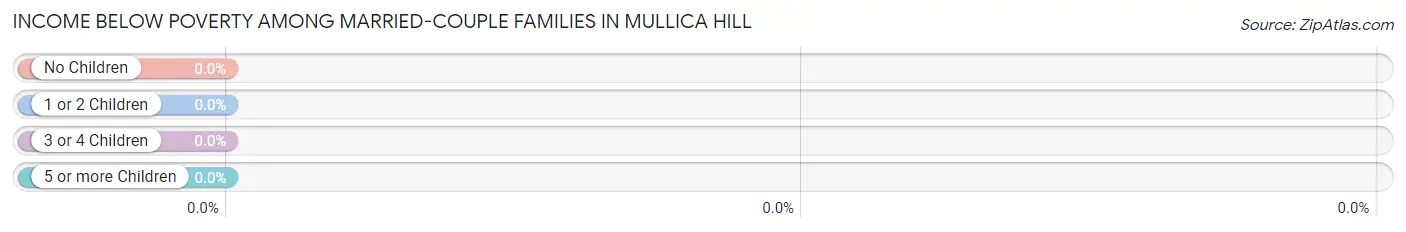
| Children | Above Poverty | Below Poverty |
| No Children | 581 (100.0%) | 0 (0.0%) |
| 1 or 2 Children | 329 (100.0%) | 0 (0.0%) |
| 3 or 4 Children | 107 (100.0%) | 0 (0.0%) |
| 5 or more Children | 0 (0.0%) | 0 (0.0%) |
| Total | 1,017 (100.0%) | 0 (0.0%) |
Income Below Poverty Among Single-Parent Households in Mullica Hill
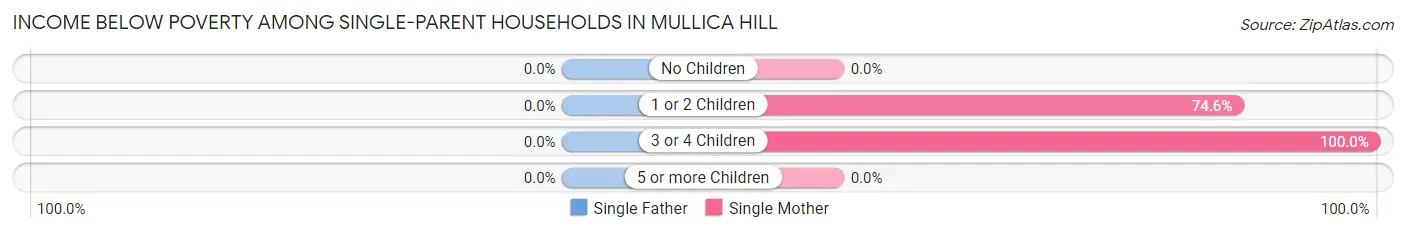
| Children | Single Father | Single Mother |
| No Children | 0 (0.0%) | 0 (0.0%) |
| 1 or 2 Children | 0 (0.0%) | 44 (74.6%) |
| 3 or 4 Children | 0 (0.0%) | 10 (100.0%) |
| 5 or more Children | 0 (0.0%) | 0 (0.0%) |
| Total | 0 (0.0%) | 54 (48.6%) |
Income Below Poverty Among Married-Couple vs Single-Parent Households in Mullica Hill
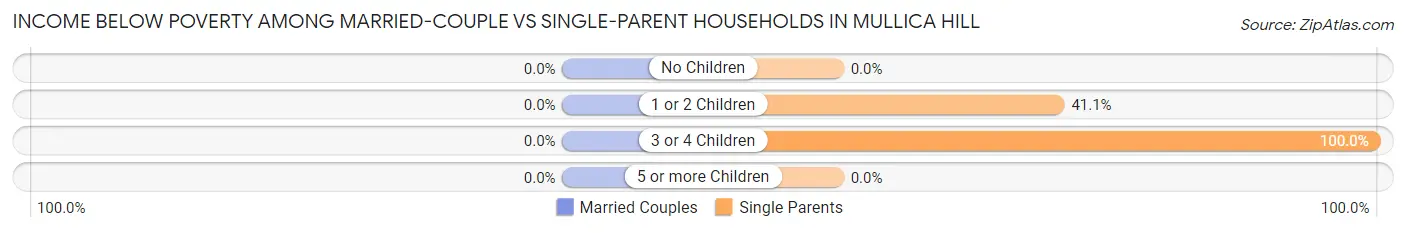
| Children | Married-Couple Families | Single-Parent Households |
| No Children | 0 (0.0%) | 0 (0.0%) |
| 1 or 2 Children | 0 (0.0%) | 44 (41.1%) |
| 3 or 4 Children | 0 (0.0%) | 10 (100.0%) |
| 5 or more Children | 0 (0.0%) | 0 (0.0%) |
| Total | 0 (0.0%) | 54 (30.2%) |
Race in Mullica Hill
The most populous races in Mullica Hill are White / Caucasian (3,461 | 77.7%), Black / African American (472 | 10.6%), and Two or more Races (292 | 6.6%).
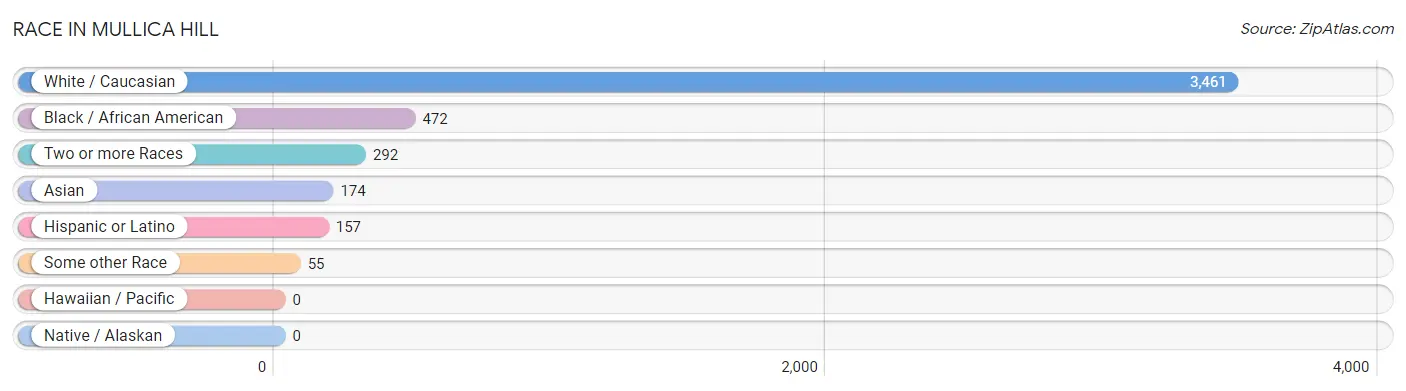
| Race | # Population | % Population |
| Asian | 174 | 3.9% |
| Black / African American | 472 | 10.6% |
| Hawaiian / Pacific | 0 | 0.0% |
| Hispanic or Latino | 157 | 3.5% |
| Native / Alaskan | 0 | 0.0% |
| White / Caucasian | 3,461 | 77.7% |
| Two or more Races | 292 | 6.6% |
| Some other Race | 55 | 1.2% |
| Total | 4,454 | 100.0% |
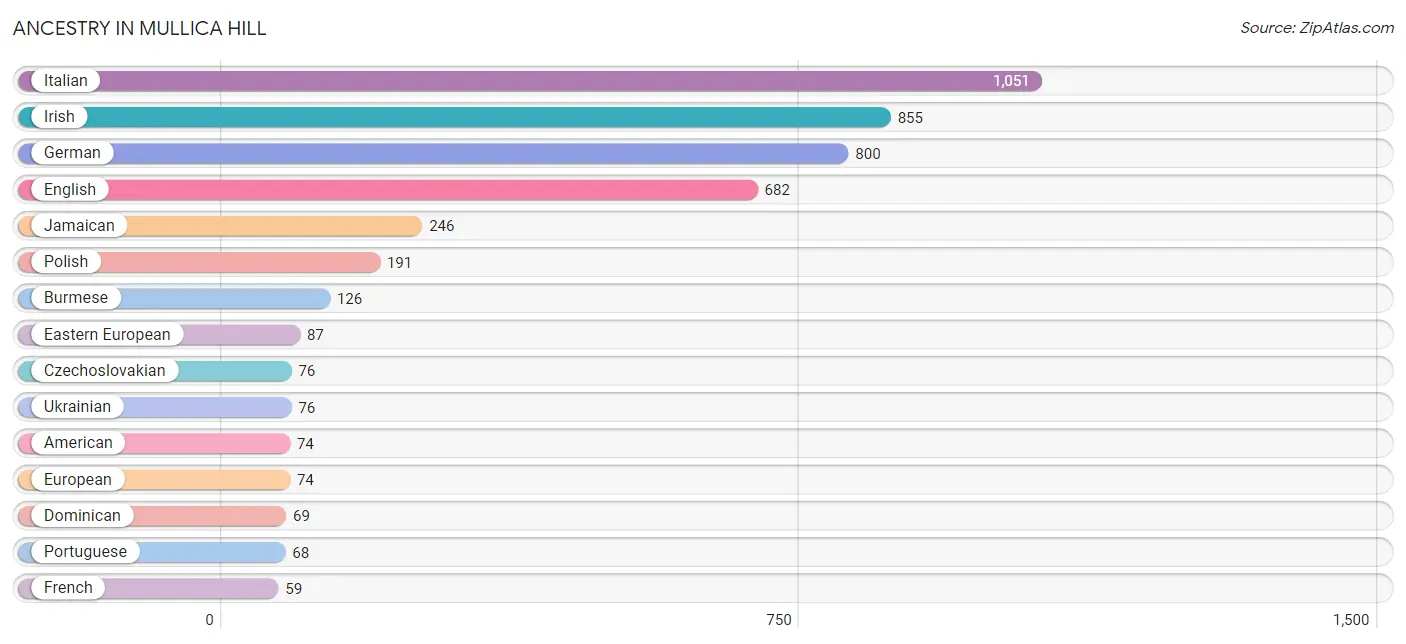
Ancestry in Mullica Hill
The most populous ancestries reported in Mullica Hill are Italian (1,051 | 23.6%), Irish (855 | 19.2%), German (800 | 18.0%), English (682 | 15.3%), and Jamaican (246 | 5.5%), together accounting for 81.6% of all Mullica Hill residents.
| Ancestry | # Population | % Population |
| American | 74 | 1.7% |
| Arab | 11 | 0.3% |
| Armenian | 9 | 0.2% |
| Bhutanese | 41 | 0.9% |
| Blackfeet | 7 | 0.2% |
| Burmese | 126 | 2.8% |
| Cherokee | 10 | 0.2% |
| Colombian | 10 | 0.2% |
| Cuban | 18 | 0.4% |
| Czech | 13 | 0.3% |
| Czechoslovakian | 76 | 1.7% |
| Danish | 34 | 0.8% |
| Dominican | 69 | 1.5% |
| Eastern European | 87 | 1.9% |
| English | 682 | 15.3% |
| European | 74 | 1.7% |
| French | 59 | 1.3% |
| French Canadian | 8 | 0.2% |
| German | 800 | 18.0% |
| Hungarian | 22 | 0.5% |
| Irish | 855 | 19.2% |
| Italian | 1,051 | 23.6% |
| Jamaican | 246 | 5.5% |
| Moroccan | 11 | 0.3% |
| Norwegian | 52 | 1.2% |
| Pennsylvania German | 6 | 0.1% |
| Polish | 191 | 4.3% |
| Portuguese | 68 | 1.5% |
| Puerto Rican | 16 | 0.4% |
| Russian | 47 | 1.1% |
| Scotch-Irish | 30 | 0.7% |
| Scottish | 47 | 1.1% |
| Slovene | 42 | 0.9% |
| South American | 10 | 0.2% |
| Spaniard | 39 | 0.9% |
| Spanish | 5 | 0.1% |
| Swedish | 44 | 1.0% |
| Turkish | 49 | 1.1% |
| Ukrainian | 76 | 1.7% |
| Welsh | 19 | 0.4% |
| Yugoslavian | 24 | 0.5% | View All 41 Rows |
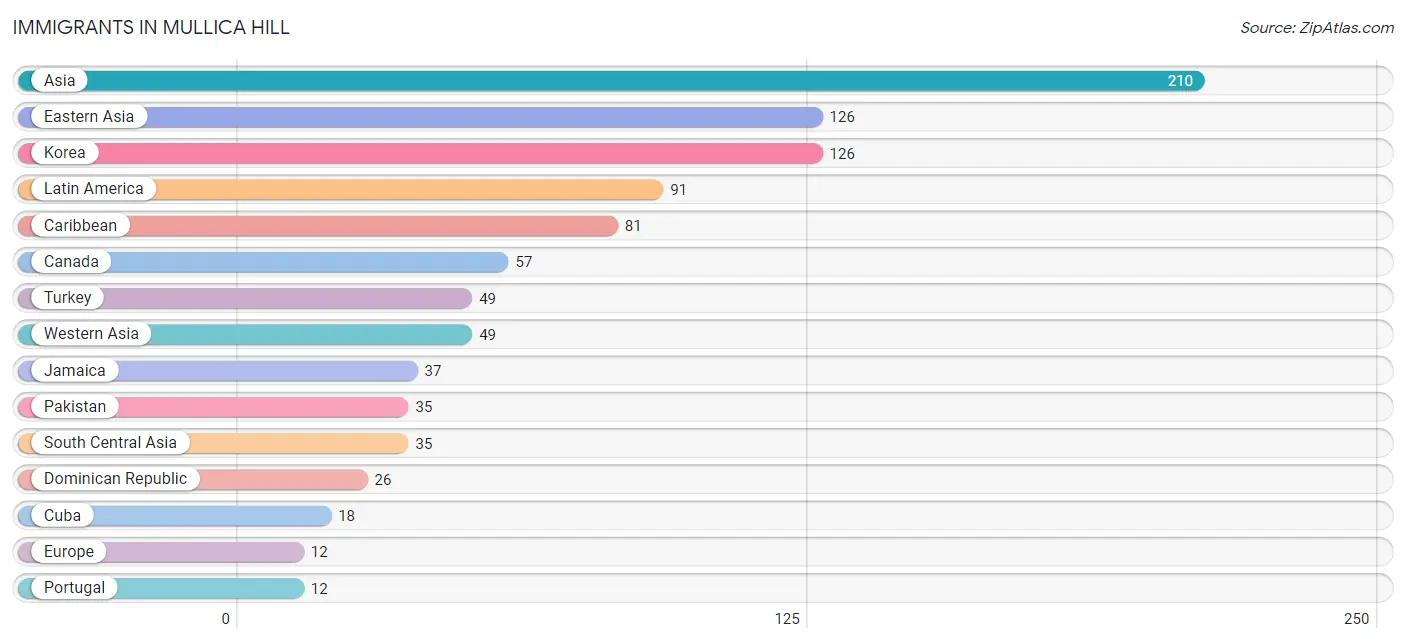
Immigrants in Mullica Hill
The most numerous immigrant groups reported in Mullica Hill came from Asia (210 | 4.7%), Eastern Asia (126 | 2.8%), Korea (126 | 2.8%), Latin America (91 | 2.0%), and Caribbean (81 | 1.8%), together accounting for 14.2% of all Mullica Hill residents.
| Immigration Origin | # Population | % Population |
| Africa | 11 | 0.3% |
| Asia | 210 | 4.7% |
| Canada | 57 | 1.3% |
| Caribbean | 81 | 1.8% |
| Colombia | 10 | 0.2% |
| Cuba | 18 | 0.4% |
| Dominican Republic | 26 | 0.6% |
| Eastern Asia | 126 | 2.8% |
| Europe | 12 | 0.3% |
| Jamaica | 37 | 0.8% |
| Korea | 126 | 2.8% |
| Latin America | 91 | 2.0% |
| Morocco | 11 | 0.3% |
| Northern Africa | 11 | 0.3% |
| Pakistan | 35 | 0.8% |
| Portugal | 12 | 0.3% |
| South America | 10 | 0.2% |
| South Central Asia | 35 | 0.8% |
| Southern Europe | 12 | 0.3% |
| Turkey | 49 | 1.1% |
| Western Asia | 49 | 1.1% | View All 21 Rows |
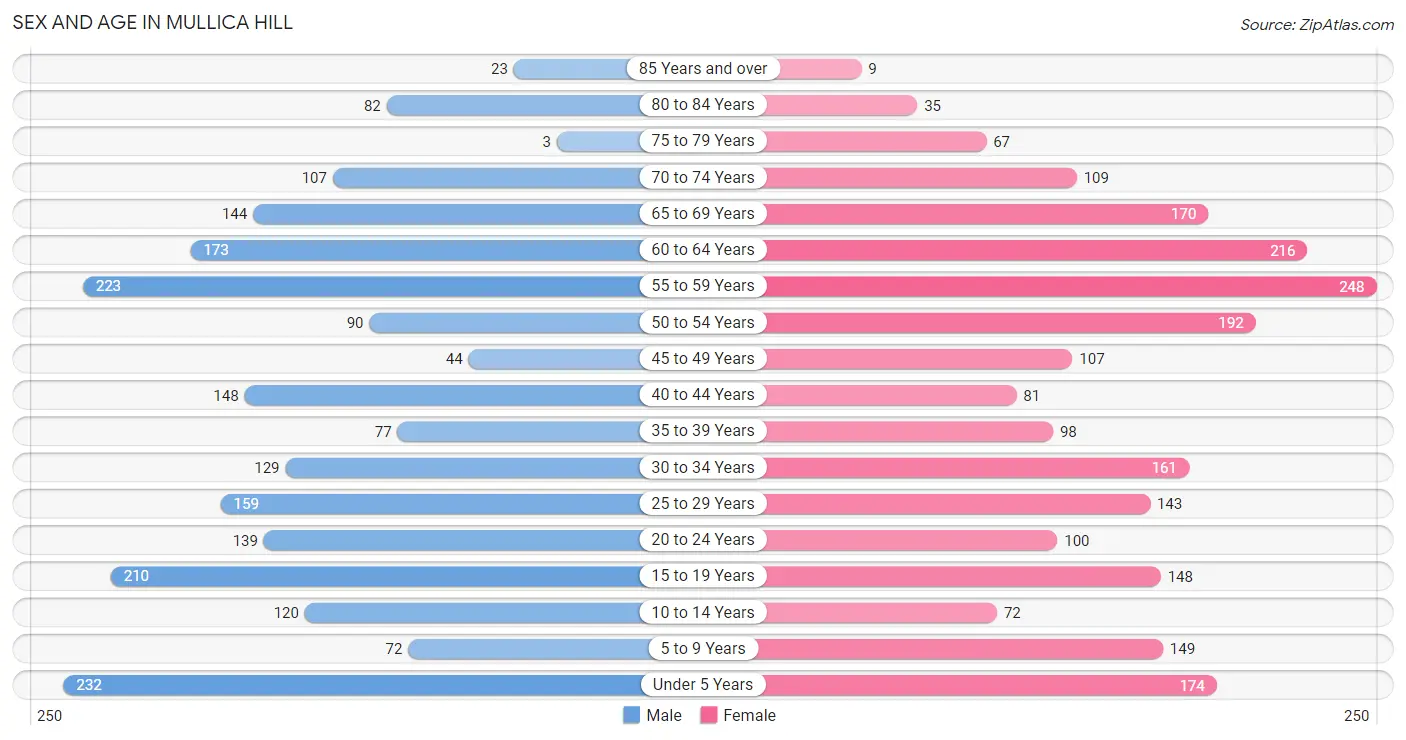
Sex and Age in Mullica Hill
Sex and Age in Mullica Hill
The most populous age groups in Mullica Hill are Under 5 Years (232 | 10.7%) for men and 55 to 59 Years (248 | 10.9%) for women.
| Age Bracket | Male | Female |
| Under 5 Years | 232 (10.7%) | 174 (7.6%) |
| 5 to 9 Years | 72 (3.3%) | 149 (6.5%) |
| 10 to 14 Years | 120 (5.5%) | 72 (3.2%) |
| 15 to 19 Years | 210 (9.7%) | 148 (6.5%) |
| 20 to 24 Years | 139 (6.4%) | 100 (4.4%) |
| 25 to 29 Years | 159 (7.3%) | 143 (6.3%) |
| 30 to 34 Years | 129 (5.9%) | 161 (7.1%) |
| 35 to 39 Years | 77 (3.5%) | 98 (4.3%) |
| 40 to 44 Years | 148 (6.8%) | 81 (3.5%) |
| 45 to 49 Years | 44 (2.0%) | 107 (4.7%) |
| 50 to 54 Years | 90 (4.1%) | 192 (8.4%) |
| 55 to 59 Years | 223 (10.2%) | 248 (10.9%) |
| 60 to 64 Years | 173 (8.0%) | 216 (9.5%) |
| 65 to 69 Years | 144 (6.6%) | 170 (7.5%) |
| 70 to 74 Years | 107 (4.9%) | 109 (4.8%) |
| 75 to 79 Years | 3 (0.1%) | 67 (2.9%) |
| 80 to 84 Years | 82 (3.8%) | 35 (1.5%) |
| 85 Years and over | 23 (1.1%) | 9 (0.4%) |
| Total | 2,175 (100.0%) | 2,279 (100.0%) |
Families and Households in Mullica Hill
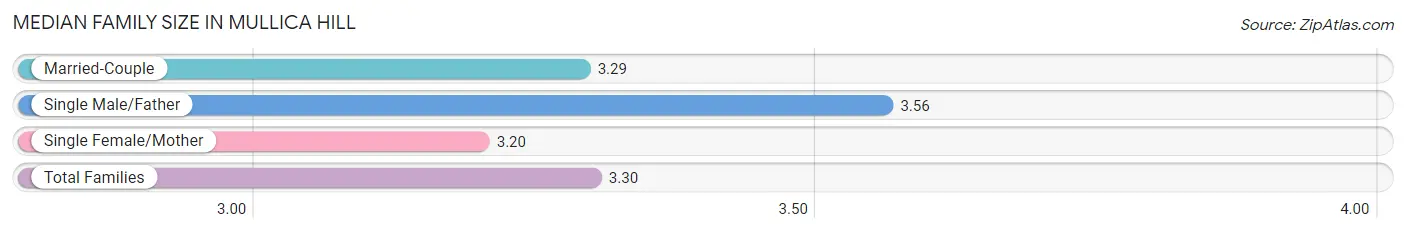
Median Family Size in Mullica Hill
The median family size in Mullica Hill is 3.30 persons per family, with single male/father families (68 | 5.7%) accounting for the largest median family size of 3.56 persons per family. On the other hand, single female/mother families (111 | 9.3%) represent the smallest median family size with 3.20 persons per family.
| Family Type | # Families | Family Size |
| Married-Couple | 1,017 (85.0%) | 3.29 |
| Single Male/Father | 68 (5.7%) | 3.56 |
| Single Female/Mother | 111 (9.3%) | 3.20 |
| Total Families | 1,196 (100.0%) | 3.30 |
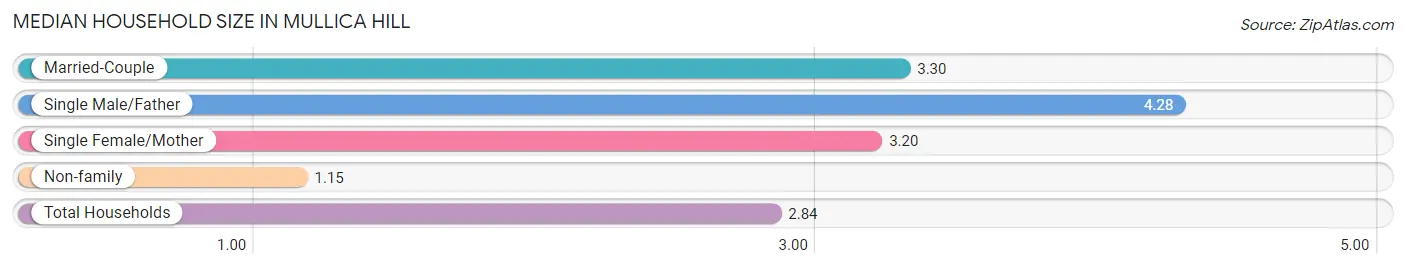
Median Household Size in Mullica Hill
The median household size in Mullica Hill is 2.84 persons per household, with single male/father households (68 | 4.4%) accounting for the largest median household size of 4.28 persons per household. non-family households (362 | 23.2%) represent the smallest median household size with 1.15 persons per household.
| Household Type | # Households | Household Size |
| Married-Couple | 1,017 (65.3%) | 3.30 |
| Single Male/Father | 68 (4.4%) | 4.28 |
| Single Female/Mother | 111 (7.1%) | 3.20 |
| Non-family | 362 (23.2%) | 1.15 |
| Total Households | 1,558 (100.0%) | 2.84 |
Household Size by Marriage Status in Mullica Hill
Out of a total of 1,558 households in Mullica Hill, 1,196 (76.8%) are family households, while 362 (23.2%) are nonfamily households. The most numerous type of family households are 2-person households, comprising 401, and the most common type of nonfamily households are 1-person households, comprising 316.
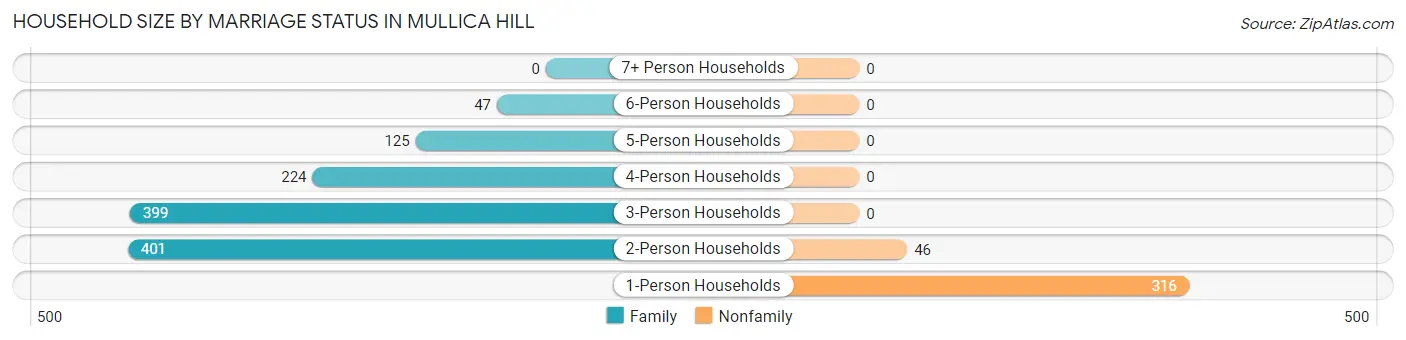
| Household Size | Family Households | Nonfamily Households |
| 1-Person Households | - | 316 (20.3%) |
| 2-Person Households | 401 (25.7%) | 46 (2.9%) |
| 3-Person Households | 399 (25.6%) | 0 (0.0%) |
| 4-Person Households | 224 (14.4%) | 0 (0.0%) |
| 5-Person Households | 125 (8.0%) | 0 (0.0%) |
| 6-Person Households | 47 (3.0%) | 0 (0.0%) |
| 7+ Person Households | 0 (0.0%) | 0 (0.0%) |
| Total | 1,196 (76.8%) | 362 (23.2%) |
Female Fertility in Mullica Hill
Fertility by Age in Mullica Hill
Average fertility rate in Mullica Hill is 112.0 births per 1,000 women. Women in the age bracket of 20 to 34 years have the highest fertility rate with 243.0 births per 1,000 women. Women in the age bracket of 20 to 34 years acount for 100.0% of all women with births.
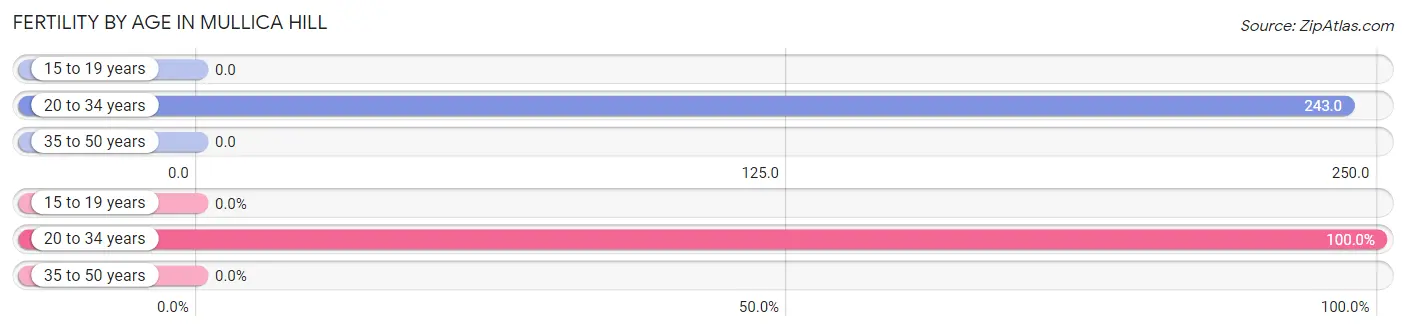
| Age Bracket | Women with Births | Births / 1,000 Women |
| 15 to 19 years | 0 (0.0%) | 0.0 |
| 20 to 34 years | 98 (100.0%) | 243.0 |
| 35 to 50 years | 0 (0.0%) | 0.0 |
| Total | 98 (100.0%) | 112.0 |
Fertility by Age by Marriage Status in Mullica Hill

| Age Bracket | Married | Unmarried |
| 15 to 19 years | 0 (0.0%) | 0 (0.0%) |
| 20 to 34 years | 98 (100.0%) | 0 (0.0%) |
| 35 to 50 years | 0 (0.0%) | 0 (0.0%) |
| Total | 98 (100.0%) | 0 (0.0%) |
Fertility by Education in Mullica Hill
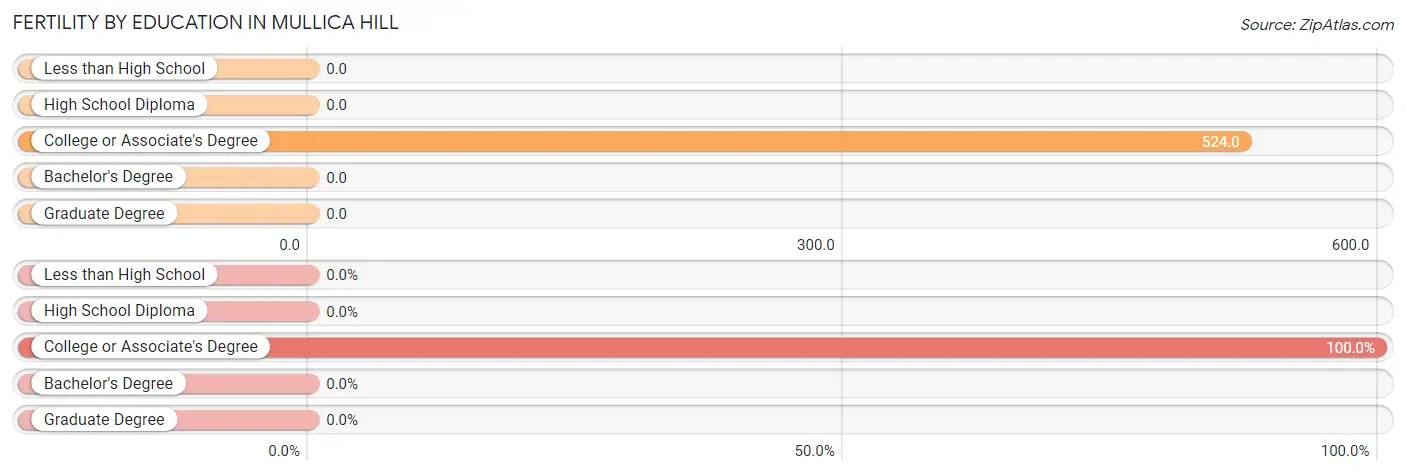
| Educational Attainment | Women with Births | Births / 1,000 Women |
| Less than High School | 0 (0.0%) | 0.0 |
| High School Diploma | 0 (0.0%) | 0.0 |
| College or Associate's Degree | 98 (100.0%) | 524.0 |
| Bachelor's Degree | 0 (0.0%) | 0.0 |
| Graduate Degree | 0 (0.0%) | 0.0 |
| Total | 98 (100.0%) | 112.0 |
Fertility by Education by Marriage Status in Mullica Hill
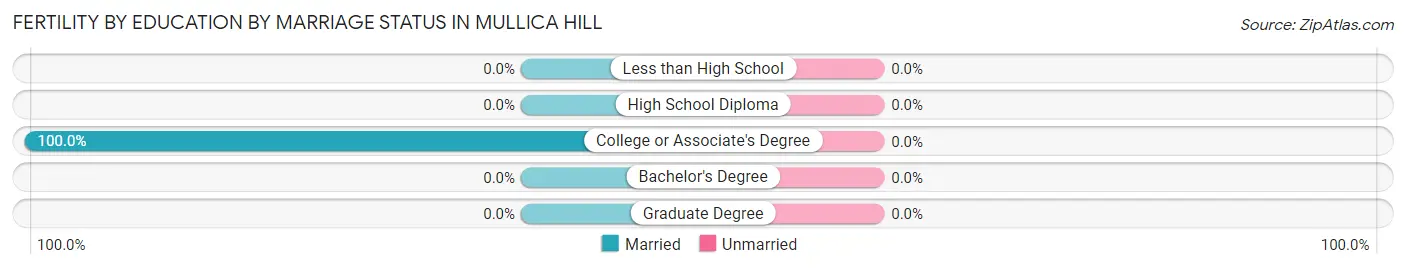
| Educational Attainment | Married | Unmarried |
| Less than High School | 0 (0.0%) | 0 (0.0%) |
| High School Diploma | 0 (0.0%) | 0 (0.0%) |
| College or Associate's Degree | 98 (100.0%) | 0 (0.0%) |
| Bachelor's Degree | 0 (0.0%) | 0 (0.0%) |
| Graduate Degree | 0 (0.0%) | 0 (0.0%) |
| Total | 98 (100.0%) | 0 (0.0%) |
Employment Characteristics in Mullica Hill
Employment by Class of Employer in Mullica Hill
Among the 2,042 employed individuals in Mullica Hill, private company employees (1,333 | 65.3%), local government employees (189 | 9.3%), and not-for-profit organizations (178 | 8.7%) make up the most common classes of employment.
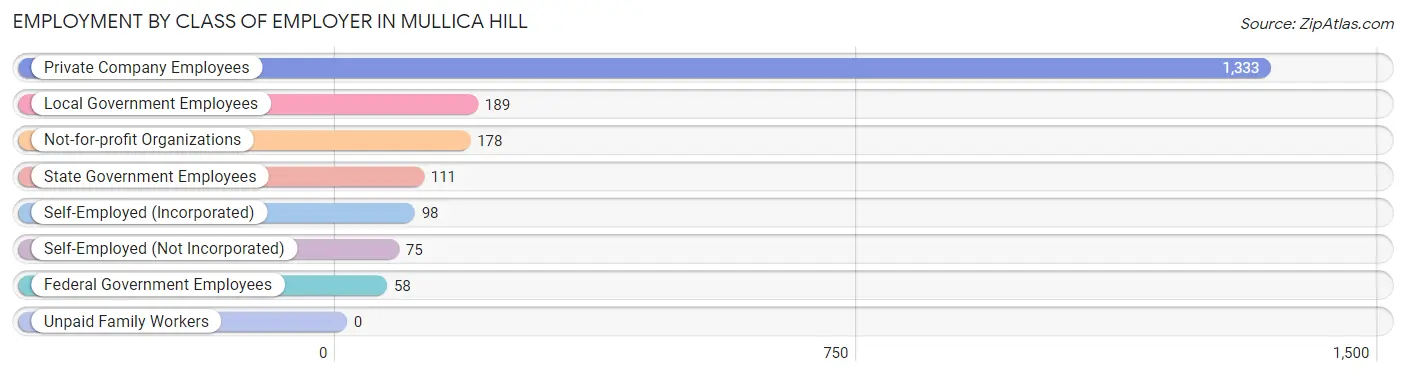
| Employer Class | # Employees | % Employees |
| Private Company Employees | 1,333 | 65.3% |
| Self-Employed (Incorporated) | 98 | 4.8% |
| Self-Employed (Not Incorporated) | 75 | 3.7% |
| Not-for-profit Organizations | 178 | 8.7% |
| Local Government Employees | 189 | 9.3% |
| State Government Employees | 111 | 5.4% |
| Federal Government Employees | 58 | 2.8% |
| Unpaid Family Workers | 0 | 0.0% |
| Total | 2,042 | 100.0% |
Employment Status by Age in Mullica Hill
According to the labor force statistics for Mullica Hill, out of the total population over 16 years of age (3,562), 60.7% or 2,162 individuals are in the labor force, with 4.9% or 106 of them unemployed. The age group with the highest labor force participation rate is 25 to 29 years, with 87.4% or 264 individuals in the labor force. Within the labor force, the 16 to 19 years age range has the highest percentage of unemployed individuals, with 66.7% or 94 of them being unemployed.
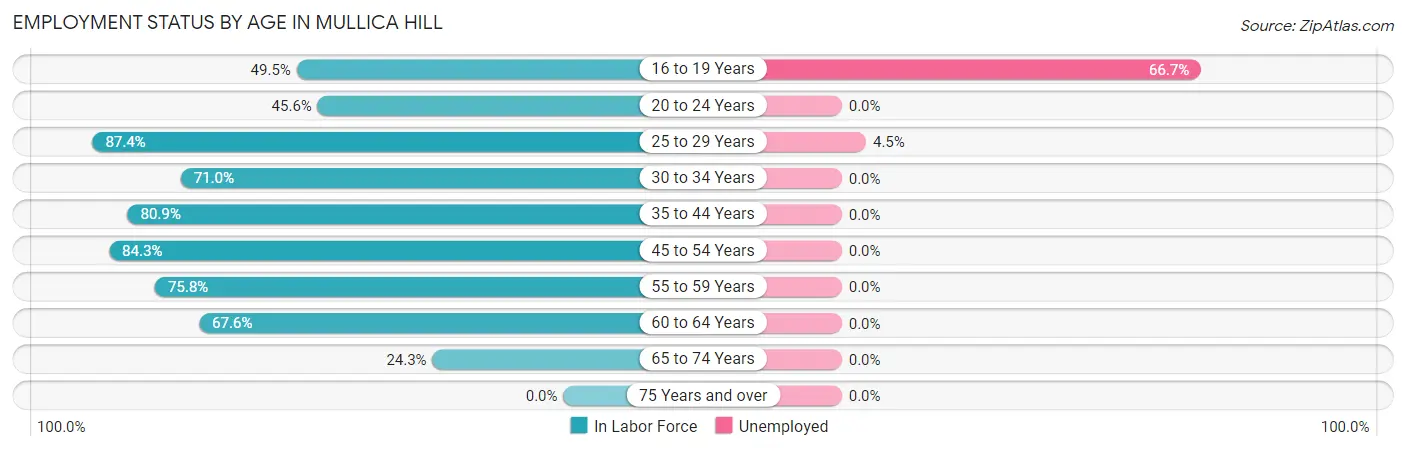
| Age Bracket | In Labor Force | Unemployed |
| 16 to 19 Years | 141 (49.5%) | 94 (66.7%) |
| 20 to 24 Years | 109 (45.6%) | 0 (0.0%) |
| 25 to 29 Years | 264 (87.4%) | 12 (4.5%) |
| 30 to 34 Years | 206 (71.0%) | 0 (0.0%) |
| 35 to 44 Years | 327 (80.9%) | 0 (0.0%) |
| 45 to 54 Years | 365 (84.3%) | 0 (0.0%) |
| 55 to 59 Years | 357 (75.8%) | 0 (0.0%) |
| 60 to 64 Years | 263 (67.6%) | 0 (0.0%) |
| 65 to 74 Years | 129 (24.3%) | 0 (0.0%) |
| 75 Years and over | 0 (0.0%) | 0 (0.0%) |
| Total | 2,162 (60.7%) | 106 (4.9%) |
Employment Status by Educational Attainment in Mullica Hill
According to labor force statistics for Mullica Hill, 77.9% of individuals (1,783) out of the total population between 25 and 64 years of age (2,289) are in the labor force, with 0.7% or 12 of them being unemployed. The group with the highest labor force participation rate are those with the educational attainment of bachelor's degree or higher, with 88.0% or 1,060 individuals in the labor force. Within the labor force, individuals with less than high school education have the highest percentage of unemployment, with 24.0% or 12 of them being unemployed.
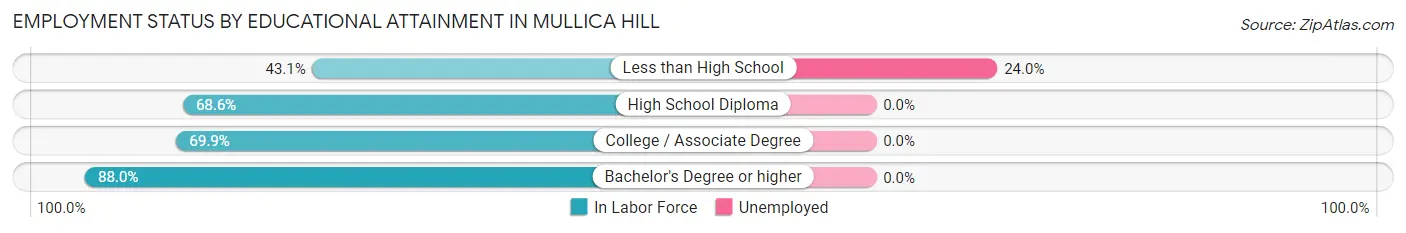
| Educational Attainment | In Labor Force | Unemployed |
| Less than High School | 50 (43.1%) | 28 (24.0%) |
| High School Diploma | 315 (68.6%) | 0 (0.0%) |
| College / Associate Degree | 356 (69.9%) | 0 (0.0%) |
| Bachelor's Degree or higher | 1,060 (88.0%) | 0 (0.0%) |
| Total | 1,783 (77.9%) | 16 (0.7%) |
Employment Occupations by Sex in Mullica Hill
Management, Business, Science and Arts Occupations
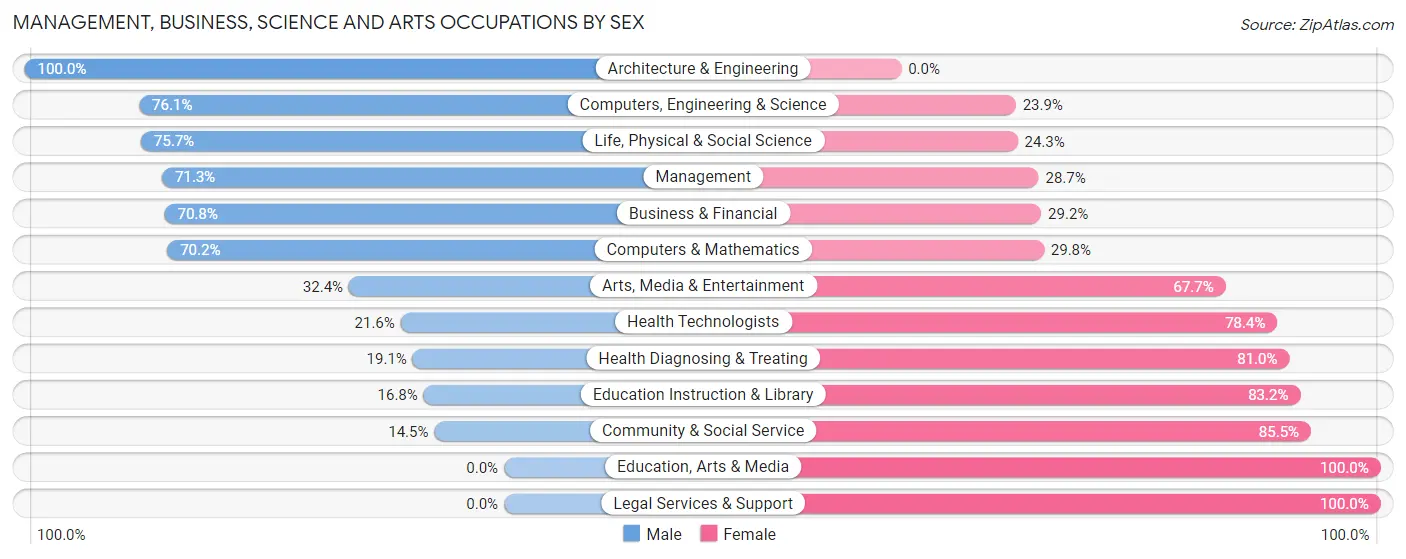
The most common Management, Business, Science and Arts occupations in Mullica Hill are Management (314 | 15.3%), Computers, Engineering & Science (314 | 15.3%), Community & Social Service (289 | 14.1%), Health Diagnosing & Treating (189 | 9.2%), and Education Instruction & Library (185 | 9.0%).
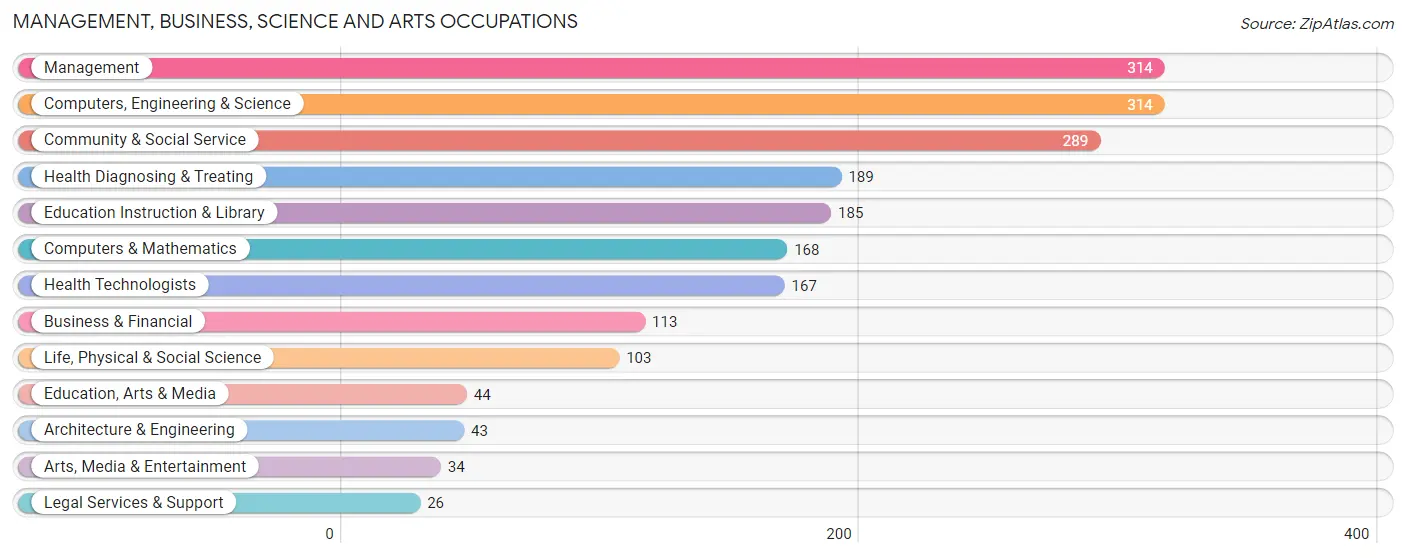
Management, Business, Science and Arts Occupations by Sex
Within the Management, Business, Science and Arts occupations in Mullica Hill, the most male-oriented occupations are Architecture & Engineering (100.0%), Computers, Engineering & Science (76.1%), and Life, Physical & Social Science (75.7%), while the most female-oriented occupations are Education, Arts & Media (100.0%), Legal Services & Support (100.0%), and Community & Social Service (85.5%).
| Occupation | Male | Female |
| Management | 224 (71.3%) | 90 (28.7%) |
| Business & Financial | 80 (70.8%) | 33 (29.2%) |
| Computers, Engineering & Science | 239 (76.1%) | 75 (23.9%) |
| Computers & Mathematics | 118 (70.2%) | 50 (29.8%) |
| Architecture & Engineering | 43 (100.0%) | 0 (0.0%) |
| Life, Physical & Social Science | 78 (75.7%) | 25 (24.3%) |
| Community & Social Service | 42 (14.5%) | 247 (85.5%) |
| Education, Arts & Media | 0 (0.0%) | 44 (100.0%) |
| Legal Services & Support | 0 (0.0%) | 26 (100.0%) |
| Education Instruction & Library | 31 (16.8%) | 154 (83.2%) |
| Arts, Media & Entertainment | 11 (32.4%) | 23 (67.6%) |
| Health Diagnosing & Treating | 36 (19.1%) | 153 (80.9%) |
| Health Technologists | 36 (21.6%) | 131 (78.4%) |
| Total (Category) | 621 (50.9%) | 598 (49.1%) |
| Total (Overall) | 1,087 (52.9%) | 968 (47.1%) |
Services Occupations
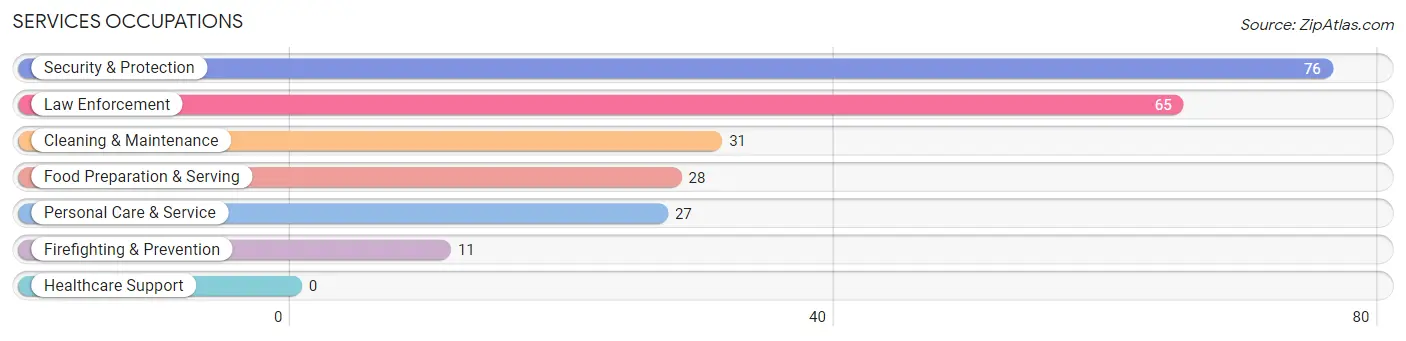
The most common Services occupations in Mullica Hill are Security & Protection (76 | 3.7%), Law Enforcement (65 | 3.2%), Cleaning & Maintenance (31 | 1.5%), Food Preparation & Serving (28 | 1.4%), and Personal Care & Service (27 | 1.3%).
Services Occupations by Sex
Within the Services occupations in Mullica Hill, the most male-oriented occupations are Security & Protection (100.0%), Firefighting & Prevention (100.0%), and Law Enforcement (100.0%), while the most female-oriented occupations are Food Preparation & Serving (100.0%), Cleaning & Maintenance (100.0%), and Personal Care & Service (100.0%).
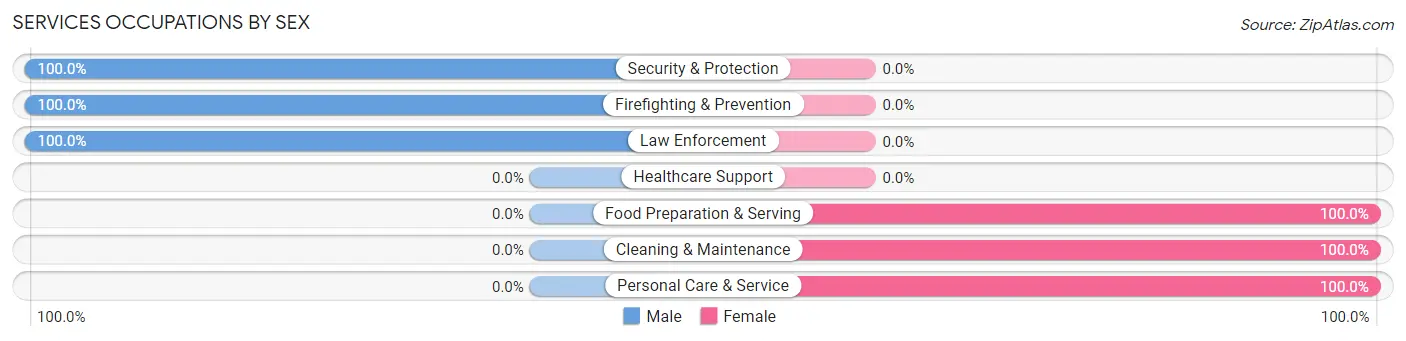
| Occupation | Male | Female |
| Healthcare Support | 0 (0.0%) | 0 (0.0%) |
| Security & Protection | 76 (100.0%) | 0 (0.0%) |
| Firefighting & Prevention | 11 (100.0%) | 0 (0.0%) |
| Law Enforcement | 65 (100.0%) | 0 (0.0%) |
| Food Preparation & Serving | 0 (0.0%) | 28 (100.0%) |
| Cleaning & Maintenance | 0 (0.0%) | 31 (100.0%) |
| Personal Care & Service | 0 (0.0%) | 27 (100.0%) |
| Total (Category) | 76 (46.9%) | 86 (53.1%) |
| Total (Overall) | 1,087 (52.9%) | 968 (47.1%) |
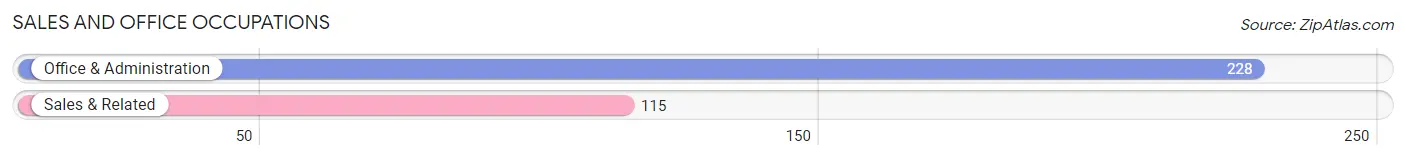
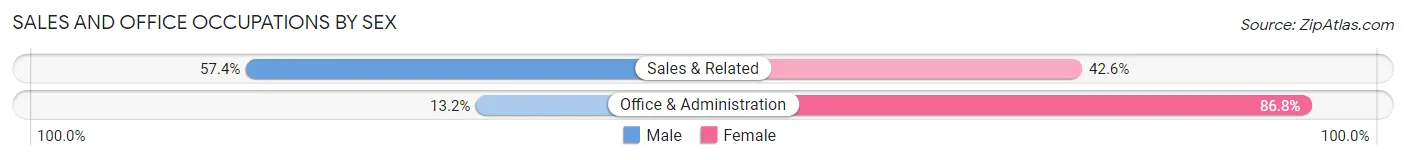
Sales and Office Occupations
The most common Sales and Office occupations in Mullica Hill are Office & Administration (228 | 11.1%), and Sales & Related (115 | 5.6%).
Sales and Office Occupations by Sex
| Occupation | Male | Female |
| Sales & Related | 66 (57.4%) | 49 (42.6%) |
| Office & Administration | 30 (13.2%) | 198 (86.8%) |
| Total (Category) | 96 (28.0%) | 247 (72.0%) |
| Total (Overall) | 1,087 (52.9%) | 968 (47.1%) |
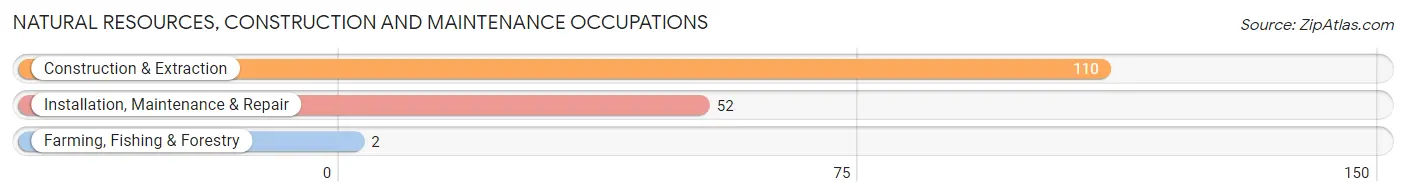
Natural Resources, Construction and Maintenance Occupations
The most common Natural Resources, Construction and Maintenance occupations in Mullica Hill are Construction & Extraction (110 | 5.3%), Installation, Maintenance & Repair (52 | 2.5%), and Farming, Fishing & Forestry (2 | 0.1%).
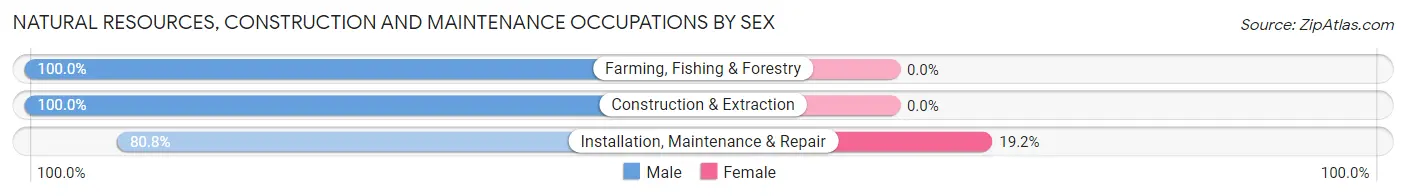
Natural Resources, Construction and Maintenance Occupations by Sex
| Occupation | Male | Female |
| Farming, Fishing & Forestry | 2 (100.0%) | 0 (0.0%) |
| Construction & Extraction | 110 (100.0%) | 0 (0.0%) |
| Installation, Maintenance & Repair | 42 (80.8%) | 10 (19.2%) |
| Total (Category) | 154 (93.9%) | 10 (6.1%) |
| Total (Overall) | 1,087 (52.9%) | 968 (47.1%) |
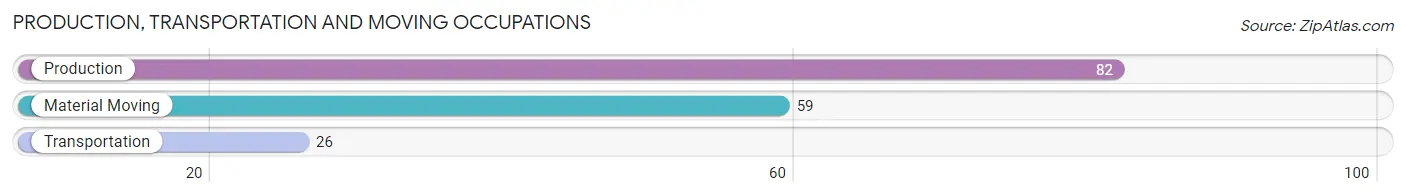
Production, Transportation and Moving Occupations
The most common Production, Transportation and Moving occupations in Mullica Hill are Production (82 | 4.0%), Material Moving (59 | 2.9%), and Transportation (26 | 1.3%).
Production, Transportation and Moving Occupations by Sex
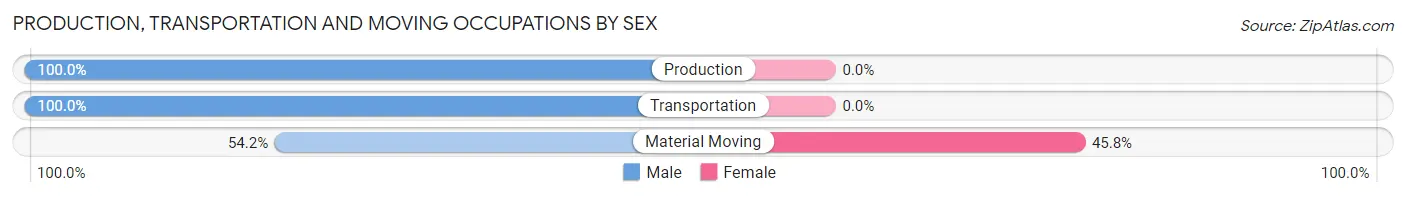
| Occupation | Male | Female |
| Production | 82 (100.0%) | 0 (0.0%) |
| Transportation | 26 (100.0%) | 0 (0.0%) |
| Material Moving | 32 (54.2%) | 27 (45.8%) |
| Total (Category) | 140 (83.8%) | 27 (16.2%) |
| Total (Overall) | 1,087 (52.9%) | 968 (47.1%) |
Employment Industries by Sex in Mullica Hill
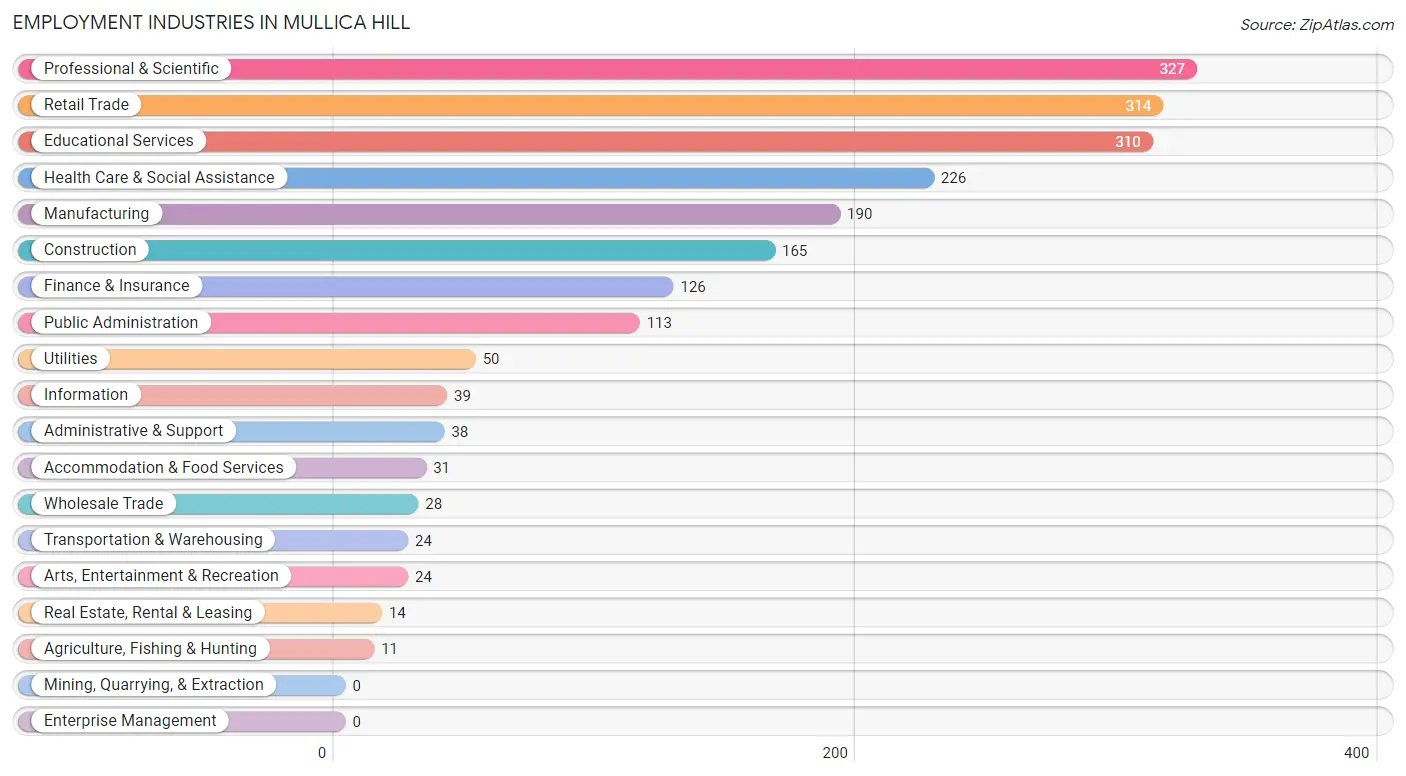
Employment Industries in Mullica Hill
The major employment industries in Mullica Hill include Professional & Scientific (327 | 15.9%), Retail Trade (314 | 15.3%), Educational Services (310 | 15.1%), Health Care & Social Assistance (226 | 11.0%), and Manufacturing (190 | 9.2%).
Employment Industries by Sex in Mullica Hill
The Mullica Hill industries that see more men than women are Agriculture, Fishing & Hunting (100.0%), Transportation & Warehousing (100.0%), and Utilities (100.0%), whereas the industries that tend to have a higher number of women are Accommodation & Food Services (100.0%), Health Care & Social Assistance (88.0%), and Educational Services (79.3%).
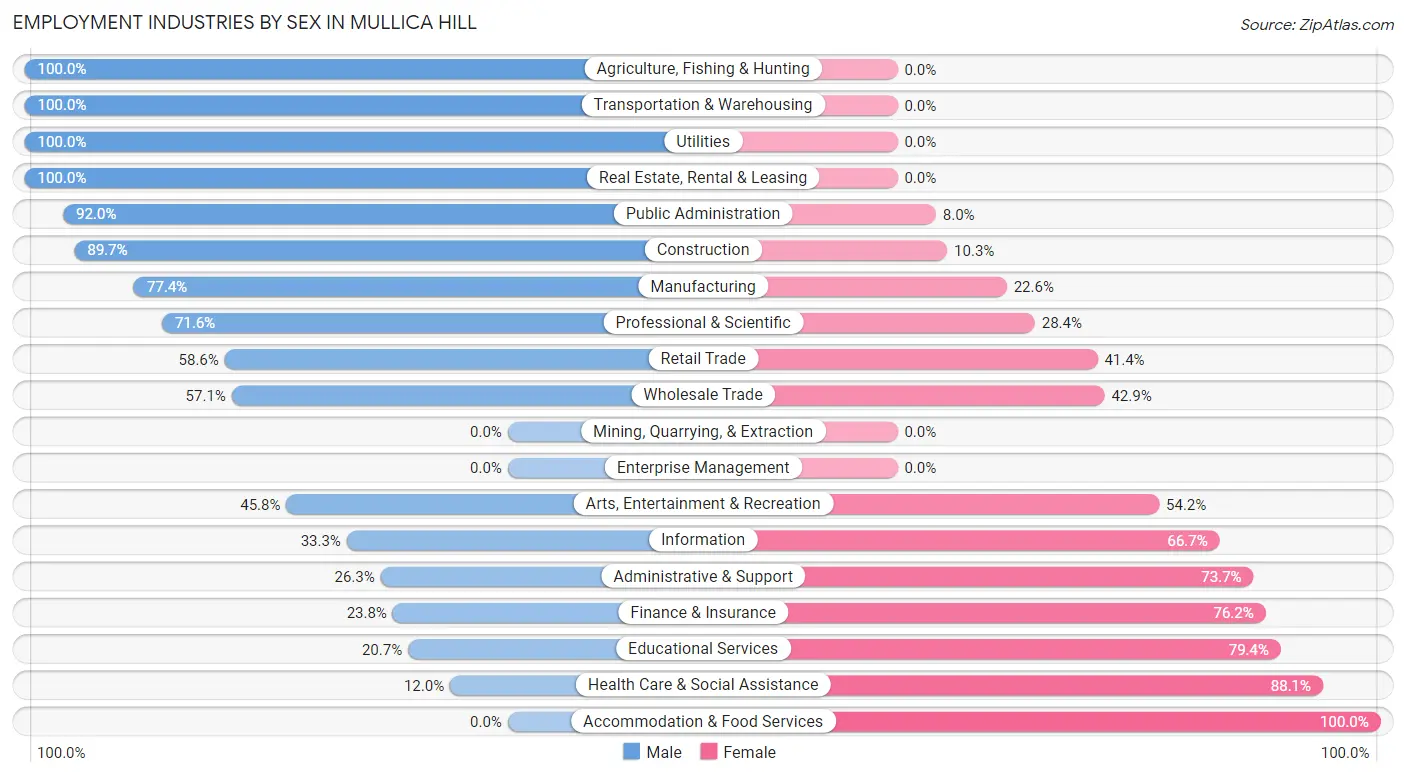
| Industry | Male | Female |
| Agriculture, Fishing & Hunting | 11 (100.0%) | 0 (0.0%) |
| Mining, Quarrying, & Extraction | 0 (0.0%) | 0 (0.0%) |
| Construction | 148 (89.7%) | 17 (10.3%) |
| Manufacturing | 147 (77.4%) | 43 (22.6%) |
| Wholesale Trade | 16 (57.1%) | 12 (42.9%) |
| Retail Trade | 184 (58.6%) | 130 (41.4%) |
| Transportation & Warehousing | 24 (100.0%) | 0 (0.0%) |
| Utilities | 50 (100.0%) | 0 (0.0%) |
| Information | 13 (33.3%) | 26 (66.7%) |
| Finance & Insurance | 30 (23.8%) | 96 (76.2%) |
| Real Estate, Rental & Leasing | 14 (100.0%) | 0 (0.0%) |
| Professional & Scientific | 234 (71.6%) | 93 (28.4%) |
| Enterprise Management | 0 (0.0%) | 0 (0.0%) |
| Administrative & Support | 10 (26.3%) | 28 (73.7%) |
| Educational Services | 64 (20.6%) | 246 (79.3%) |
| Health Care & Social Assistance | 27 (11.9%) | 199 (88.0%) |
| Arts, Entertainment & Recreation | 11 (45.8%) | 13 (54.2%) |
| Accommodation & Food Services | 0 (0.0%) | 31 (100.0%) |
| Public Administration | 104 (92.0%) | 9 (8.0%) |
| Total | 1,087 (52.9%) | 968 (47.1%) |
Education in Mullica Hill
School Enrollment in Mullica Hill
The most common levels of schooling among the 1,100 students in Mullica Hill are high school (287 | 26.1%), middle school (193 | 17.5%), and elementary school (190 | 17.3%).
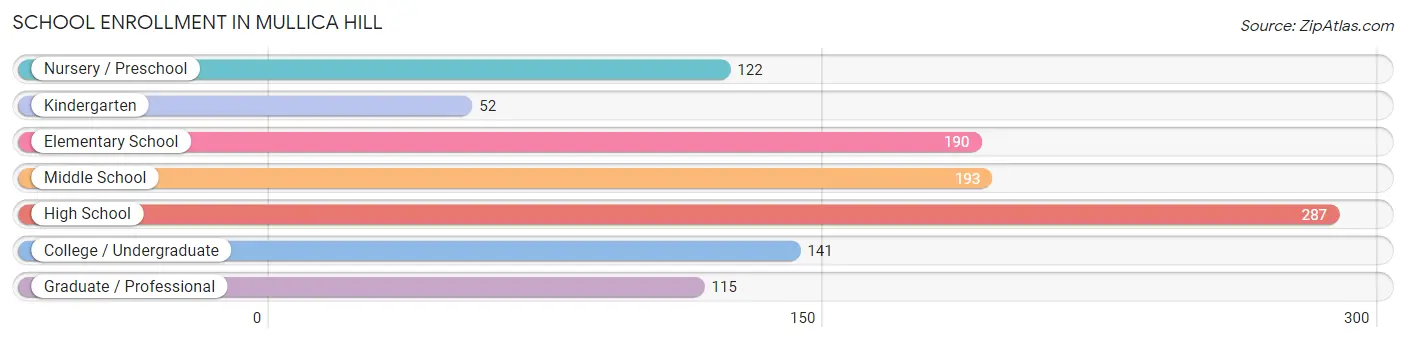
| School Level | # Students | % Students |
| Nursery / Preschool | 122 | 11.1% |
| Kindergarten | 52 | 4.7% |
| Elementary School | 190 | 17.3% |
| Middle School | 193 | 17.5% |
| High School | 287 | 26.1% |
| College / Undergraduate | 141 | 12.8% |
| Graduate / Professional | 115 | 10.4% |
| Total | 1,100 | 100.0% |
School Enrollment by Age by Funding Source in Mullica Hill
Out of a total of 1,100 students who are enrolled in schools in Mullica Hill, 340 (30.9%) attend a private institution, while the remaining 760 (69.1%) are enrolled in public schools. The age group of 20 to 24 year olds has the highest likelihood of being enrolled in private schools, with 102 (80.9% in the age bracket) enrolled. Conversely, the age group of 15 to 17 year olds has the lowest likelihood of being enrolled in a private school, with 234 (95.1% in the age bracket) attending a public institution.
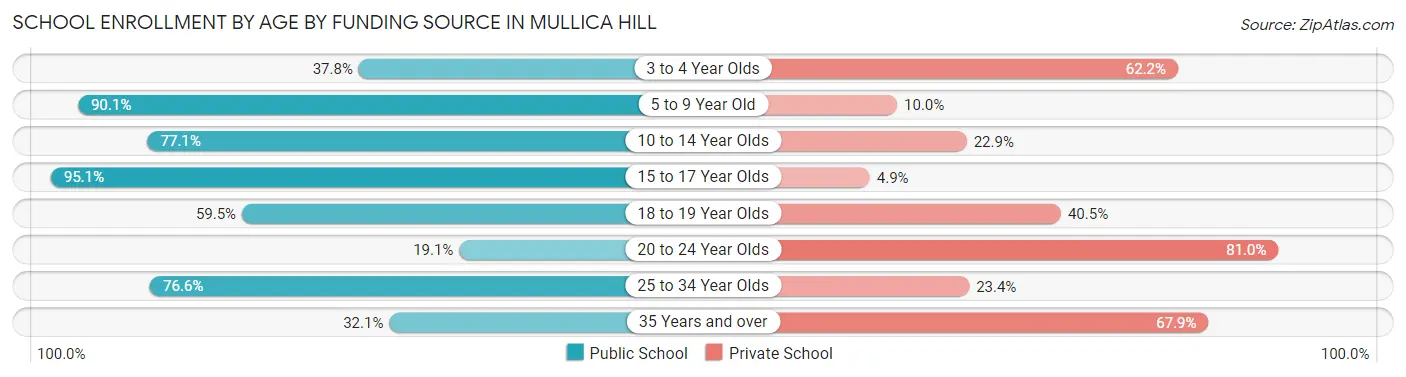
| Age Bracket | Public School | Private School |
| 3 to 4 Year Olds | 54 (37.8%) | 89 (62.2%) |
| 5 to 9 Year Old | 199 (90.0%) | 22 (10.0%) |
| 10 to 14 Year Olds | 148 (77.1%) | 44 (22.9%) |
| 15 to 17 Year Olds | 234 (95.1%) | 12 (4.9%) |
| 18 to 19 Year Olds | 25 (59.5%) | 17 (40.5%) |
| 20 to 24 Year Olds | 24 (19.1%) | 102 (80.9%) |
| 25 to 34 Year Olds | 59 (76.6%) | 18 (23.4%) |
| 35 Years and over | 17 (32.1%) | 36 (67.9%) |
| Total | 760 (69.1%) | 340 (30.9%) |
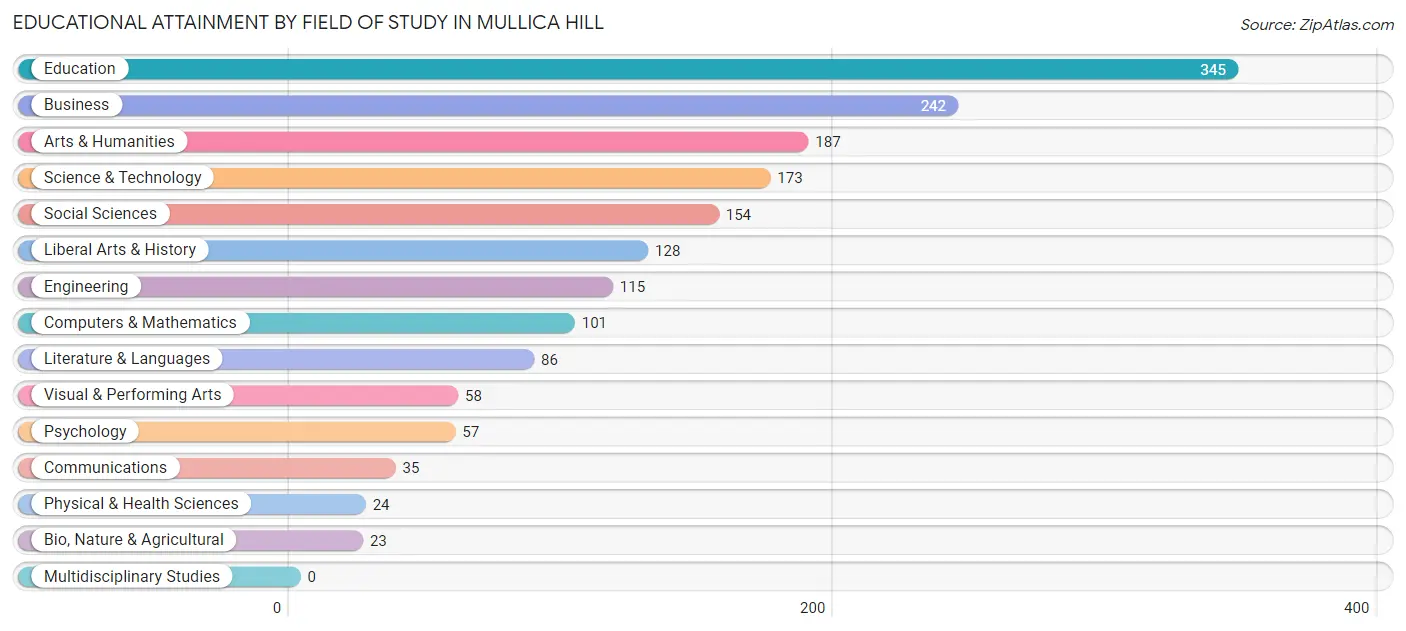
Educational Attainment by Field of Study in Mullica Hill
Education (345 | 20.0%), business (242 | 14.0%), arts & humanities (187 | 10.8%), science & technology (173 | 10.0%), and social sciences (154 | 8.9%) are the most common fields of study among 1,728 individuals in Mullica Hill who have obtained a bachelor's degree or higher.
| Field of Study | # Graduates | % Graduates |
| Computers & Mathematics | 101 | 5.8% |
| Bio, Nature & Agricultural | 23 | 1.3% |
| Physical & Health Sciences | 24 | 1.4% |
| Psychology | 57 | 3.3% |
| Social Sciences | 154 | 8.9% |
| Engineering | 115 | 6.7% |
| Multidisciplinary Studies | 0 | 0.0% |
| Science & Technology | 173 | 10.0% |
| Business | 242 | 14.0% |
| Education | 345 | 20.0% |
| Literature & Languages | 86 | 5.0% |
| Liberal Arts & History | 128 | 7.4% |
| Visual & Performing Arts | 58 | 3.4% |
| Communications | 35 | 2.0% |
| Arts & Humanities | 187 | 10.8% |
| Total | 1,728 | 100.0% |
Transportation & Commute in Mullica Hill
Vehicle Availability by Sex in Mullica Hill
The most prevalent vehicle ownership categories in Mullica Hill are males with 2 vehicles (556, accounting for 51.9%) and females with 2 vehicles (509, making up 57.6%).
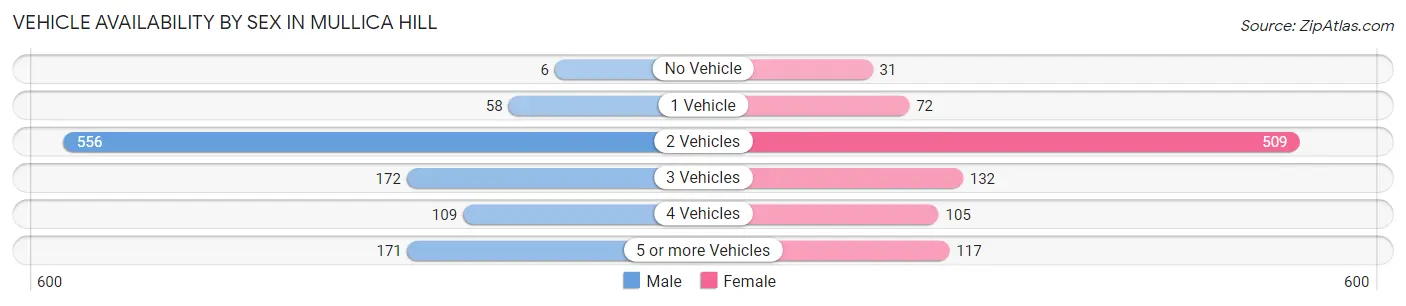
| Vehicles Available | Male | Female |
| No Vehicle | 6 (0.6%) | 31 (3.2%) |
| 1 Vehicle | 58 (5.4%) | 72 (7.4%) |
| 2 Vehicles | 556 (51.9%) | 509 (52.7%) |
| 3 Vehicles | 172 (16.0%) | 132 (13.7%) |
| 4 Vehicles | 109 (10.2%) | 105 (10.9%) |
| 5 or more Vehicles | 171 (16.0%) | 117 (12.1%) |
| Total | 1,072 (100.0%) | 966 (100.0%) |
Commute Time in Mullica Hill
The most frequently occuring commute durations in Mullica Hill are 20 to 24 minutes (282 commuters, 18.9%), 30 to 34 minutes (210 commuters, 14.1%), and 15 to 19 minutes (194 commuters, 13.0%).
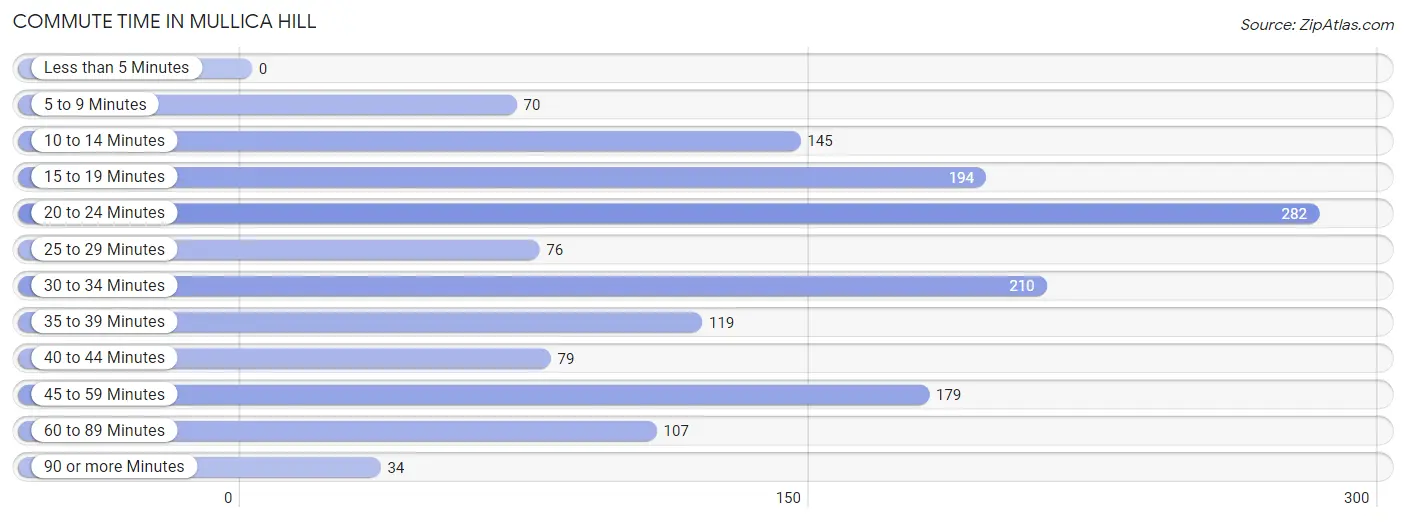
| Commute Time | # Commuters | % Commuters |
| Less than 5 Minutes | 0 | 0.0% |
| 5 to 9 Minutes | 70 | 4.7% |
| 10 to 14 Minutes | 145 | 9.7% |
| 15 to 19 Minutes | 194 | 13.0% |
| 20 to 24 Minutes | 282 | 18.9% |
| 25 to 29 Minutes | 76 | 5.1% |
| 30 to 34 Minutes | 210 | 14.1% |
| 35 to 39 Minutes | 119 | 8.0% |
| 40 to 44 Minutes | 79 | 5.3% |
| 45 to 59 Minutes | 179 | 12.0% |
| 60 to 89 Minutes | 107 | 7.2% |
| 90 or more Minutes | 34 | 2.3% |
Commute Time by Sex in Mullica Hill
The most common commute times in Mullica Hill are 20 to 24 minutes (138 commuters, 17.8%) for males and 15 to 19 minutes (154 commuters, 21.4%) for females.
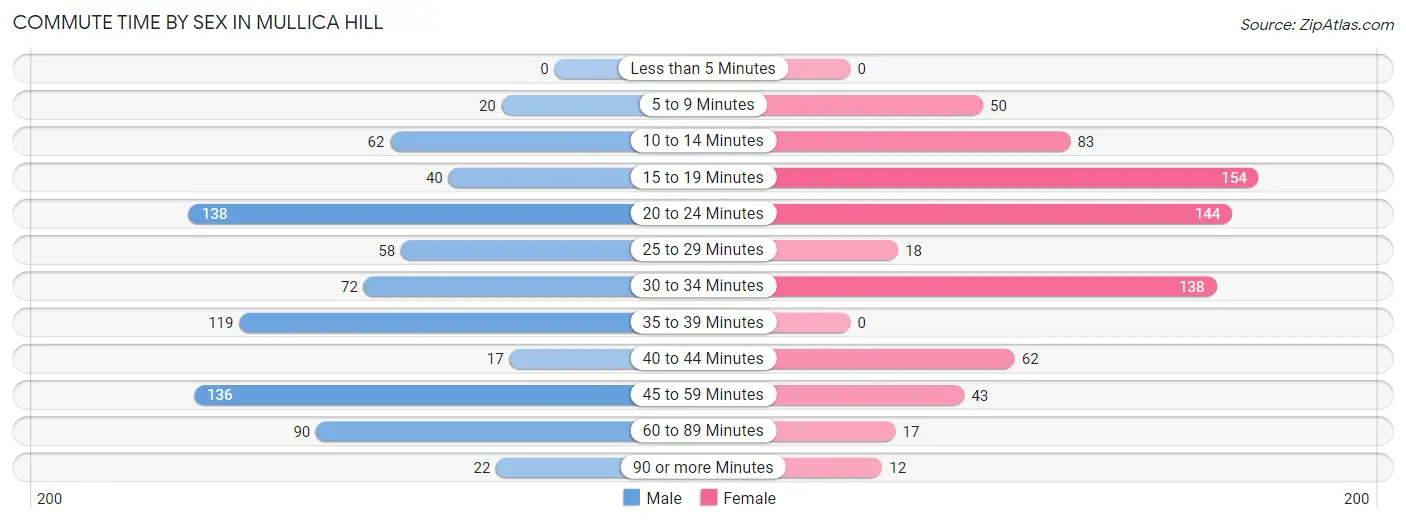
| Commute Time | Male | Female |
| Less than 5 Minutes | 0 (0.0%) | 0 (0.0%) |
| 5 to 9 Minutes | 20 (2.6%) | 50 (6.9%) |
| 10 to 14 Minutes | 62 (8.0%) | 83 (11.5%) |
| 15 to 19 Minutes | 40 (5.2%) | 154 (21.4%) |
| 20 to 24 Minutes | 138 (17.8%) | 144 (20.0%) |
| 25 to 29 Minutes | 58 (7.5%) | 18 (2.5%) |
| 30 to 34 Minutes | 72 (9.3%) | 138 (19.1%) |
| 35 to 39 Minutes | 119 (15.4%) | 0 (0.0%) |
| 40 to 44 Minutes | 17 (2.2%) | 62 (8.6%) |
| 45 to 59 Minutes | 136 (17.6%) | 43 (6.0%) |
| 60 to 89 Minutes | 90 (11.6%) | 17 (2.4%) |
| 90 or more Minutes | 22 (2.8%) | 12 (1.7%) |
Time of Departure to Work by Sex in Mullica Hill
The most frequent times of departure to work in Mullica Hill are 7:00 AM to 7:29 AM (177, 22.9%) for males and 7:00 AM to 7:29 AM (155, 21.5%) for females.
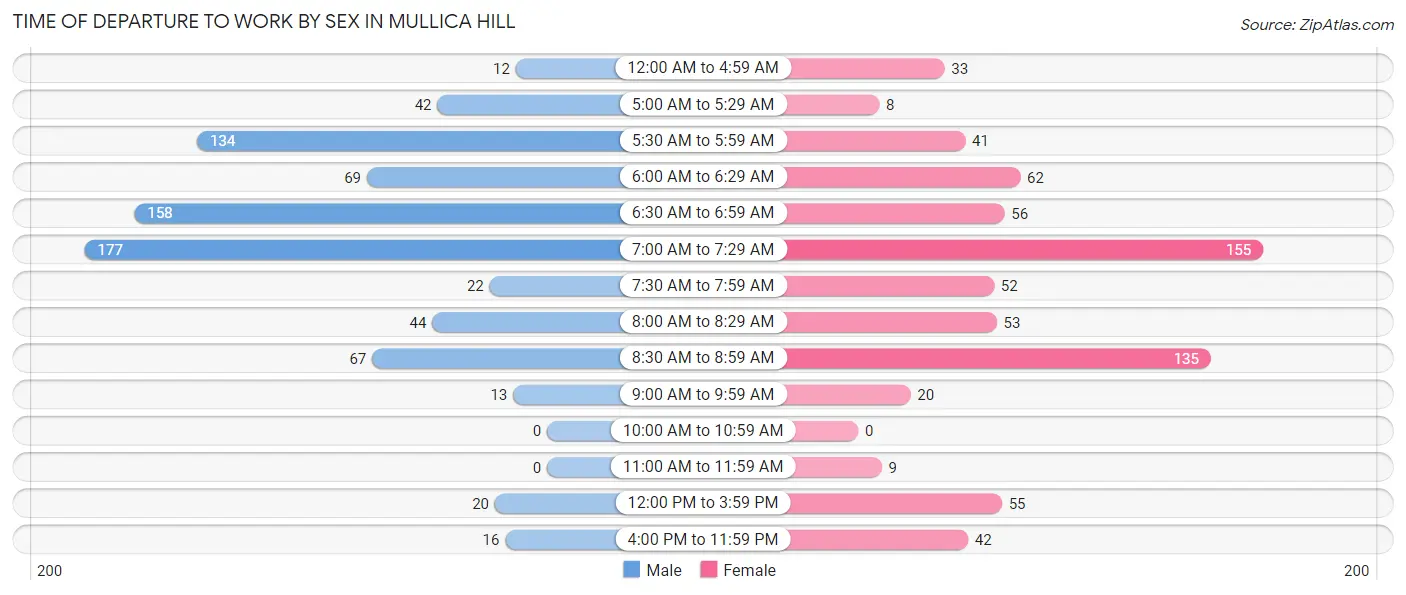
| Time of Departure | Male | Female |
| 12:00 AM to 4:59 AM | 12 (1.5%) | 33 (4.6%) |
| 5:00 AM to 5:29 AM | 42 (5.4%) | 8 (1.1%) |
| 5:30 AM to 5:59 AM | 134 (17.3%) | 41 (5.7%) |
| 6:00 AM to 6:29 AM | 69 (8.9%) | 62 (8.6%) |
| 6:30 AM to 6:59 AM | 158 (20.4%) | 56 (7.8%) |
| 7:00 AM to 7:29 AM | 177 (22.9%) | 155 (21.5%) |
| 7:30 AM to 7:59 AM | 22 (2.8%) | 52 (7.2%) |
| 8:00 AM to 8:29 AM | 44 (5.7%) | 53 (7.3%) |
| 8:30 AM to 8:59 AM | 67 (8.7%) | 135 (18.7%) |
| 9:00 AM to 9:59 AM | 13 (1.7%) | 20 (2.8%) |
| 10:00 AM to 10:59 AM | 0 (0.0%) | 0 (0.0%) |
| 11:00 AM to 11:59 AM | 0 (0.0%) | 9 (1.3%) |
| 12:00 PM to 3:59 PM | 20 (2.6%) | 55 (7.6%) |
| 4:00 PM to 11:59 PM | 16 (2.1%) | 42 (5.8%) |
| Total | 774 (100.0%) | 721 (100.0%) |
Housing Occupancy in Mullica Hill
Occupancy by Ownership in Mullica Hill
Of the total 1,558 dwellings in Mullica Hill, owner-occupied units account for 1,375 (88.2%), while renter-occupied units make up 183 (11.7%).
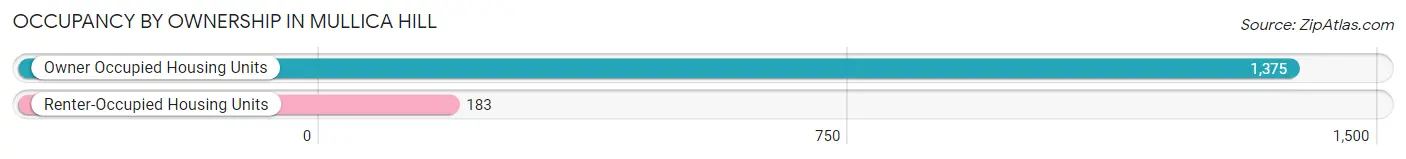
| Occupancy | # Housing Units | % Housing Units |
| Owner Occupied Housing Units | 1,375 | 88.2% |
| Renter-Occupied Housing Units | 183 | 11.7% |
| Total Occupied Housing Units | 1,558 | 100.0% |
Occupancy by Household Size in Mullica Hill
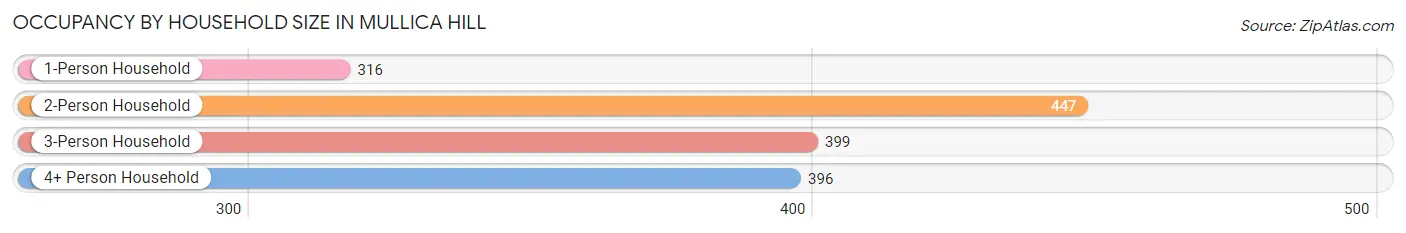
| Household Size | # Housing Units | % Housing Units |
| 1-Person Household | 316 | 20.3% |
| 2-Person Household | 447 | 28.7% |
| 3-Person Household | 399 | 25.6% |
| 4+ Person Household | 396 | 25.4% |
| Total Housing Units | 1,558 | 100.0% |
Occupancy by Ownership by Household Size in Mullica Hill
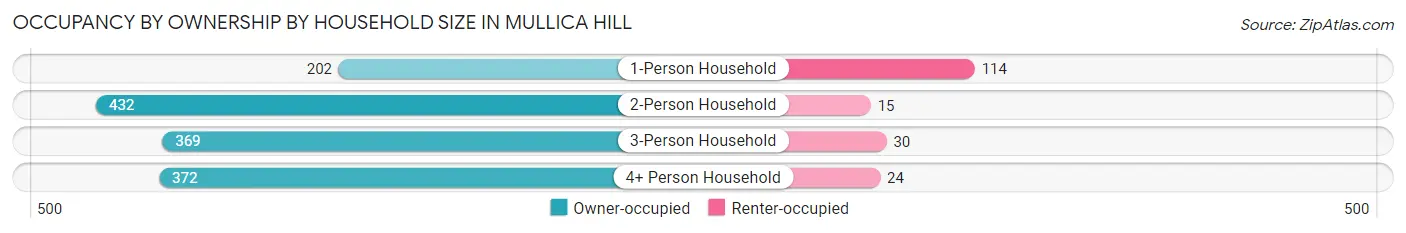
| Household Size | Owner-occupied | Renter-occupied |
| 1-Person Household | 202 (63.9%) | 114 (36.1%) |
| 2-Person Household | 432 (96.6%) | 15 (3.4%) |
| 3-Person Household | 369 (92.5%) | 30 (7.5%) |
| 4+ Person Household | 372 (93.9%) | 24 (6.1%) |
| Total Housing Units | 1,375 (88.2%) | 183 (11.7%) |
Occupancy by Educational Attainment in Mullica Hill
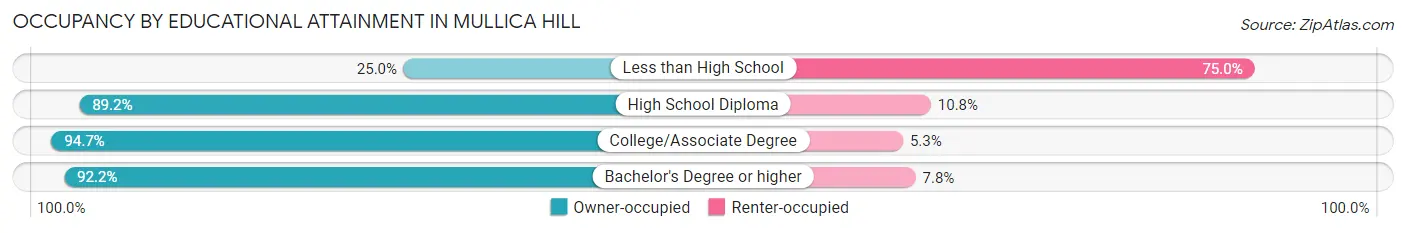
| Household Size | Owner-occupied | Renter-occupied |
| Less than High School | 22 (25.0%) | 66 (75.0%) |
| High School Diploma | 255 (89.2%) | 31 (10.8%) |
| College/Associate Degree | 249 (94.7%) | 14 (5.3%) |
| Bachelor's Degree or higher | 849 (92.2%) | 72 (7.8%) |
Occupancy by Age of Householder in Mullica Hill
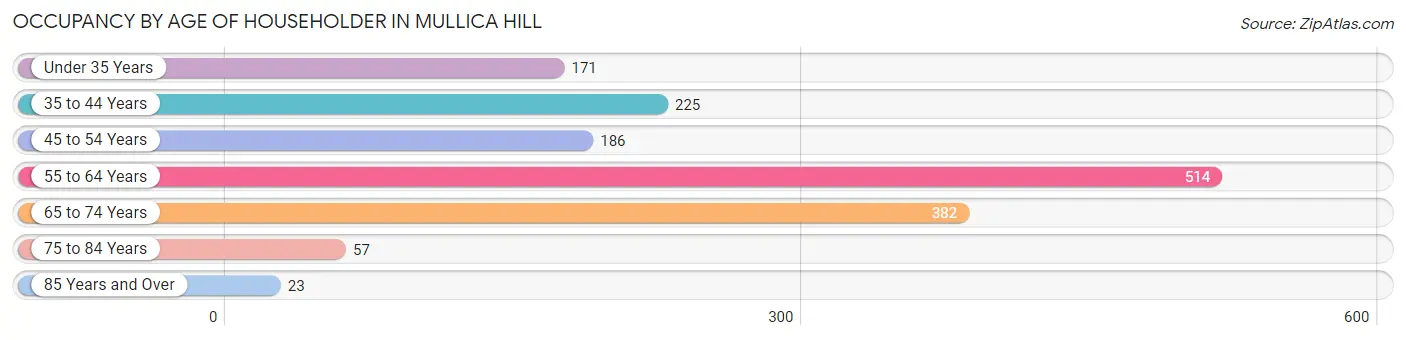
| Age Bracket | # Households | % Households |
| Under 35 Years | 171 | 11.0% |
| 35 to 44 Years | 225 | 14.4% |
| 45 to 54 Years | 186 | 11.9% |
| 55 to 64 Years | 514 | 33.0% |
| 65 to 74 Years | 382 | 24.5% |
| 75 to 84 Years | 57 | 3.7% |
| 85 Years and Over | 23 | 1.5% |
| Total | 1,558 | 100.0% |
Housing Finances in Mullica Hill
Median Income by Occupancy in Mullica Hill
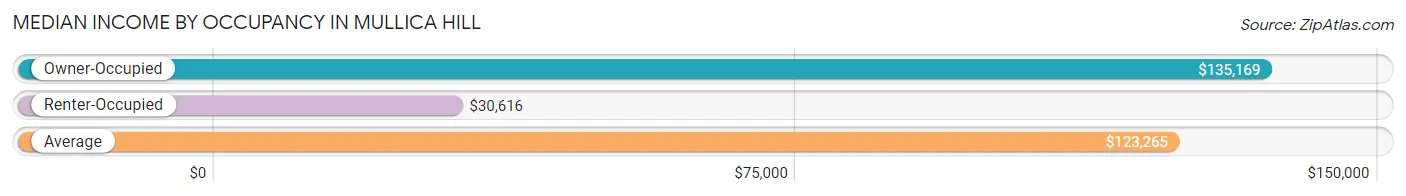
| Occupancy Type | # Households | Median Income |
| Owner-Occupied | 1,375 (88.2%) | $135,169 |
| Renter-Occupied | 183 (11.7%) | $30,616 |
| Average | 1,558 (100.0%) | $123,265 |
Occupancy by Householder Income Bracket in Mullica Hill
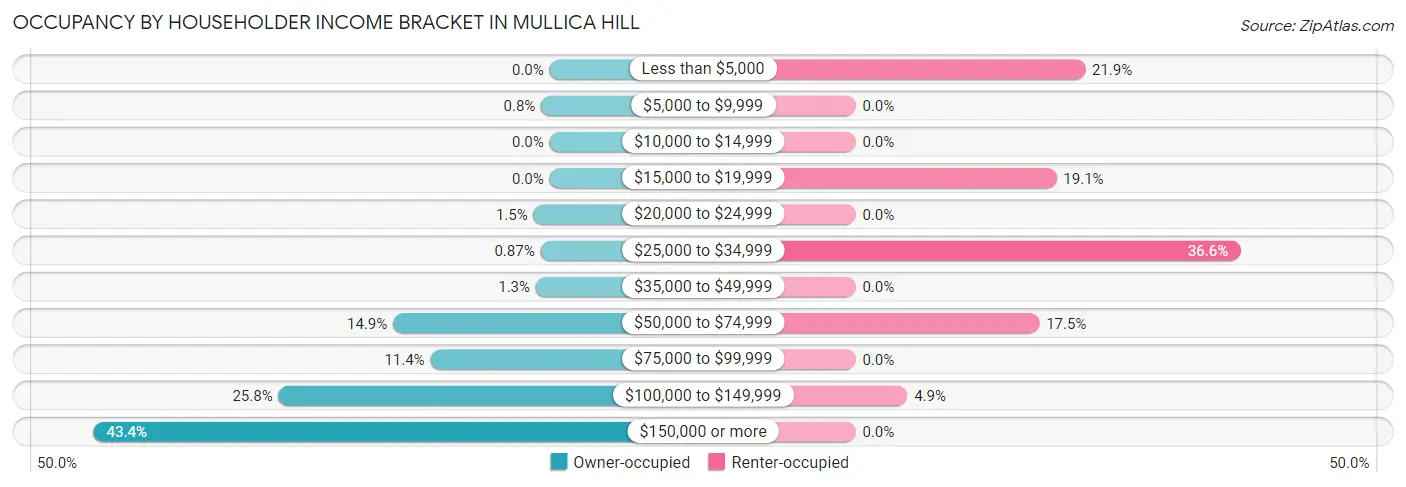
| Income Bracket | Owner-occupied | Renter-occupied |
| Less than $5,000 | 0 (0.0%) | 40 (21.9%) |
| $5,000 to $9,999 | 11 (0.8%) | 0 (0.0%) |
| $10,000 to $14,999 | 0 (0.0%) | 0 (0.0%) |
| $15,000 to $19,999 | 0 (0.0%) | 35 (19.1%) |
| $20,000 to $24,999 | 21 (1.5%) | 0 (0.0%) |
| $25,000 to $34,999 | 12 (0.9%) | 67 (36.6%) |
| $35,000 to $49,999 | 18 (1.3%) | 0 (0.0%) |
| $50,000 to $74,999 | 205 (14.9%) | 32 (17.5%) |
| $75,000 to $99,999 | 156 (11.4%) | 0 (0.0%) |
| $100,000 to $149,999 | 355 (25.8%) | 9 (4.9%) |
| $150,000 or more | 597 (43.4%) | 0 (0.0%) |
| Total | 1,375 (100.0%) | 183 (100.0%) |
Monthly Housing Cost Tiers in Mullica Hill
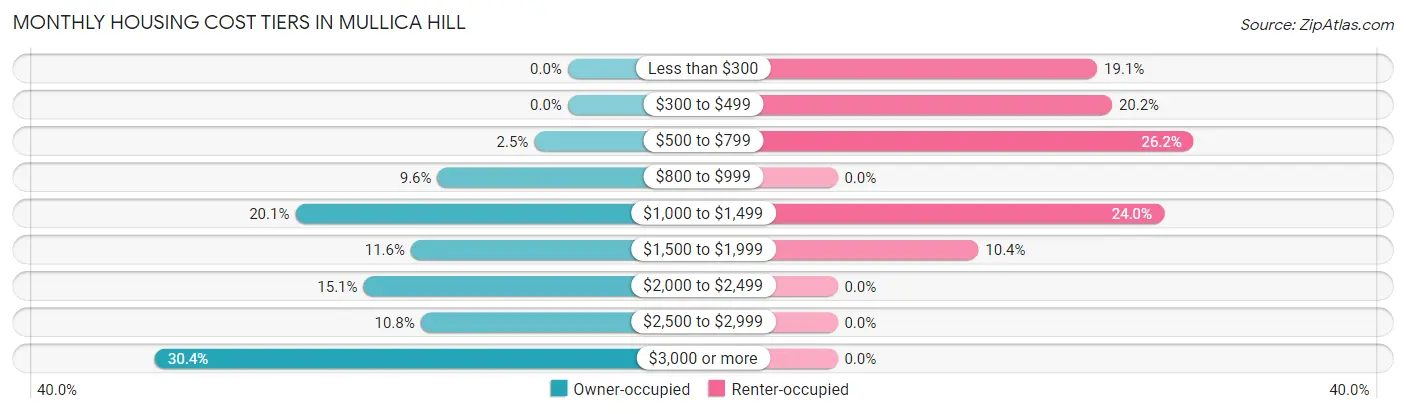
| Monthly Cost | Owner-occupied | Renter-occupied |
| Less than $300 | 0 (0.0%) | 35 (19.1%) |
| $300 to $499 | 0 (0.0%) | 37 (20.2%) |
| $500 to $799 | 34 (2.5%) | 48 (26.2%) |
| $800 to $999 | 132 (9.6%) | 0 (0.0%) |
| $1,000 to $1,499 | 276 (20.1%) | 44 (24.0%) |
| $1,500 to $1,999 | 159 (11.6%) | 19 (10.4%) |
| $2,000 to $2,499 | 207 (15.0%) | 0 (0.0%) |
| $2,500 to $2,999 | 149 (10.8%) | 0 (0.0%) |
| $3,000 or more | 418 (30.4%) | 0 (0.0%) |
| Total | 1,375 (100.0%) | 183 (100.0%) |
Physical Housing Characteristics in Mullica Hill
Housing Structures in Mullica Hill
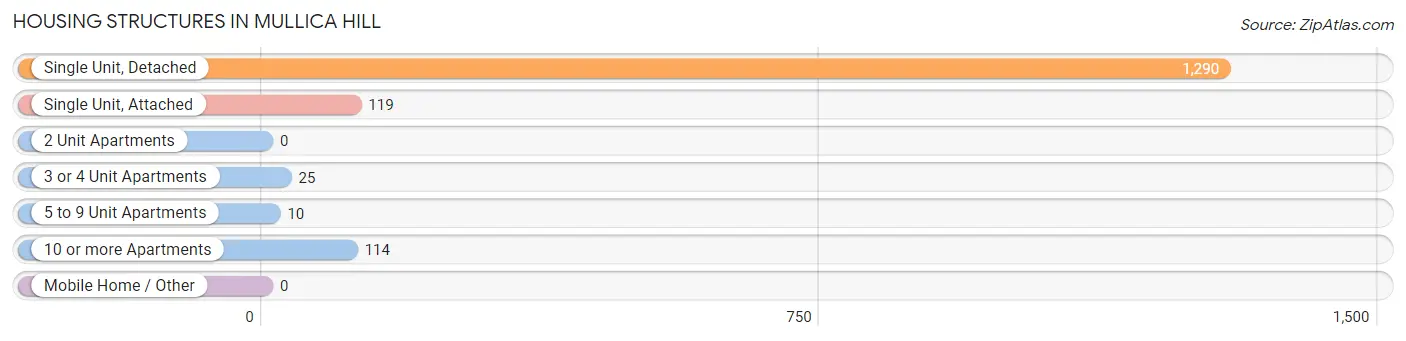
| Structure Type | # Housing Units | % Housing Units |
| Single Unit, Detached | 1,290 | 82.8% |
| Single Unit, Attached | 119 | 7.6% |
| 2 Unit Apartments | 0 | 0.0% |
| 3 or 4 Unit Apartments | 25 | 1.6% |
| 5 to 9 Unit Apartments | 10 | 0.6% |
| 10 or more Apartments | 114 | 7.3% |
| Mobile Home / Other | 0 | 0.0% |
| Total | 1,558 | 100.0% |
Housing Structures by Occupancy in Mullica Hill
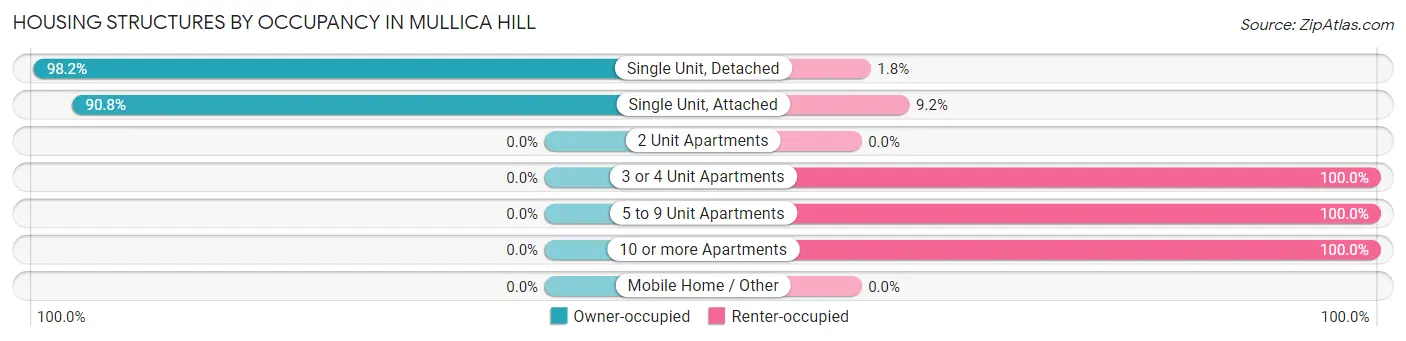
| Structure Type | Owner-occupied | Renter-occupied |
| Single Unit, Detached | 1,267 (98.2%) | 23 (1.8%) |
| Single Unit, Attached | 108 (90.8%) | 11 (9.2%) |
| 2 Unit Apartments | 0 (0.0%) | 0 (0.0%) |
| 3 or 4 Unit Apartments | 0 (0.0%) | 25 (100.0%) |
| 5 to 9 Unit Apartments | 0 (0.0%) | 10 (100.0%) |
| 10 or more Apartments | 0 (0.0%) | 114 (100.0%) |
| Mobile Home / Other | 0 (0.0%) | 0 (0.0%) |
| Total | 1,375 (88.2%) | 183 (11.7%) |
Housing Structures by Number of Rooms in Mullica Hill
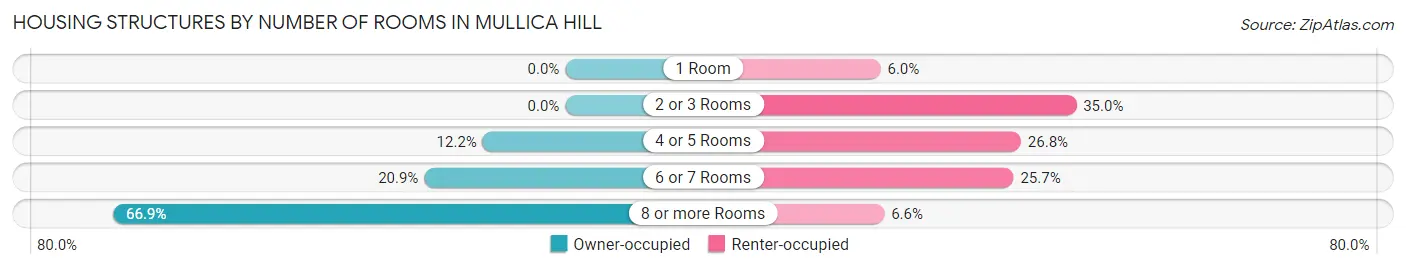
| Number of Rooms | Owner-occupied | Renter-occupied |
| 1 Room | 0 (0.0%) | 11 (6.0%) |
| 2 or 3 Rooms | 0 (0.0%) | 64 (35.0%) |
| 4 or 5 Rooms | 168 (12.2%) | 49 (26.8%) |
| 6 or 7 Rooms | 287 (20.9%) | 47 (25.7%) |
| 8 or more Rooms | 920 (66.9%) | 12 (6.6%) |
| Total | 1,375 (100.0%) | 183 (100.0%) |
Housing Structure by Heating Type in Mullica Hill
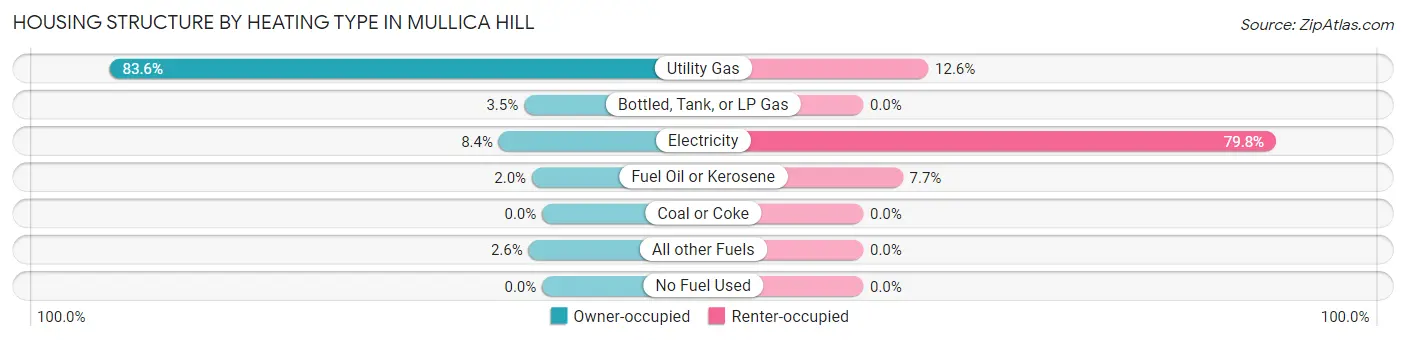
| Heating Type | Owner-occupied | Renter-occupied |
| Utility Gas | 1,149 (83.6%) | 23 (12.6%) |
| Bottled, Tank, or LP Gas | 48 (3.5%) | 0 (0.0%) |
| Electricity | 115 (8.4%) | 146 (79.8%) |
| Fuel Oil or Kerosene | 27 (2.0%) | 14 (7.6%) |
| Coal or Coke | 0 (0.0%) | 0 (0.0%) |
| All other Fuels | 36 (2.6%) | 0 (0.0%) |
| No Fuel Used | 0 (0.0%) | 0 (0.0%) |
| Total | 1,375 (100.0%) | 183 (100.0%) |
Household Vehicle Usage in Mullica Hill
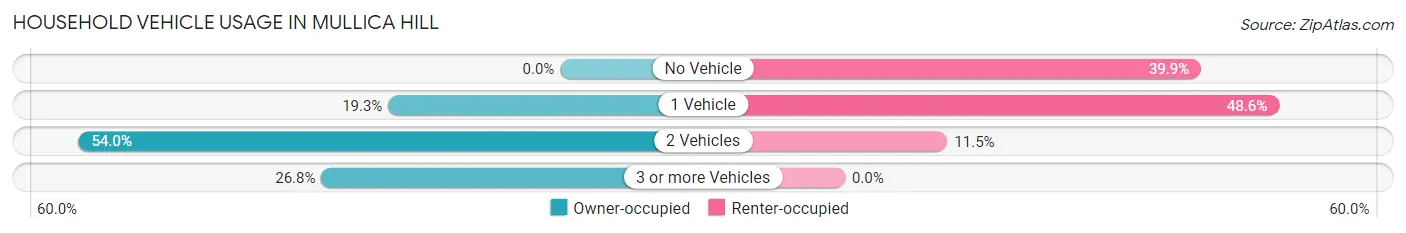
| Vehicles per Household | Owner-occupied | Renter-occupied |
| No Vehicle | 0 (0.0%) | 73 (39.9%) |
| 1 Vehicle | 265 (19.3%) | 89 (48.6%) |
| 2 Vehicles | 742 (54.0%) | 21 (11.5%) |
| 3 or more Vehicles | 368 (26.8%) | 0 (0.0%) |
| Total | 1,375 (100.0%) | 183 (100.0%) |
Real Estate & Mortgages in Mullica Hill
Real Estate and Mortgage Overview in Mullica Hill
| Characteristic | Without Mortgage | With Mortgage |
| Housing Units | 456 | 919 |
| Median Property Value | $328,800 | $418,400 |
| Median Household Income | $81,359 | $526 |
| Monthly Housing Costs | $1,123 | $418 |
| Real Estate Taxes | $8,472 | $0 |
Property Value by Mortgage Status in Mullica Hill
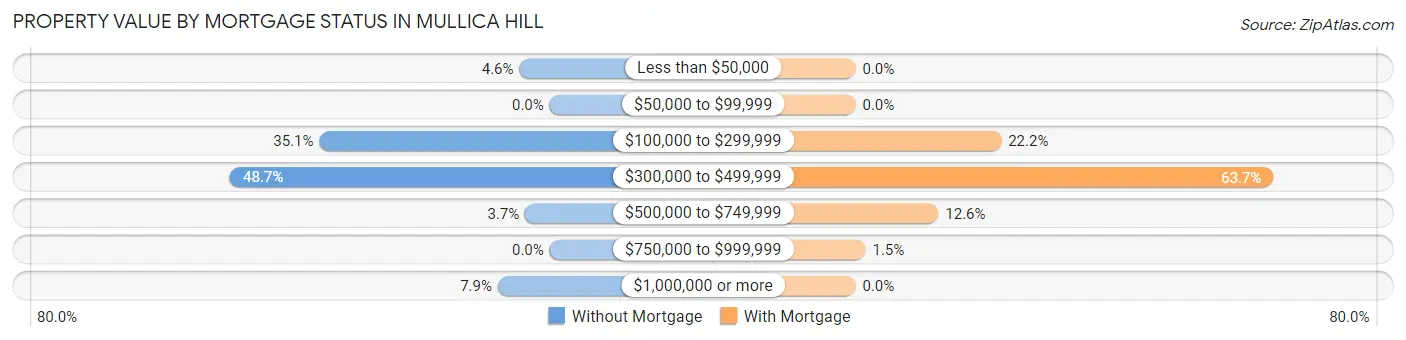
| Property Value | Without Mortgage | With Mortgage |
| Less than $50,000 | 21 (4.6%) | 0 (0.0%) |
| $50,000 to $99,999 | 0 (0.0%) | 0 (0.0%) |
| $100,000 to $299,999 | 160 (35.1%) | 204 (22.2%) |
| $300,000 to $499,999 | 222 (48.7%) | 585 (63.7%) |
| $500,000 to $749,999 | 17 (3.7%) | 116 (12.6%) |
| $750,000 to $999,999 | 0 (0.0%) | 14 (1.5%) |
| $1,000,000 or more | 36 (7.9%) | 0 (0.0%) |
| Total | 456 (100.0%) | 919 (100.0%) |
Household Income by Mortgage Status in Mullica Hill
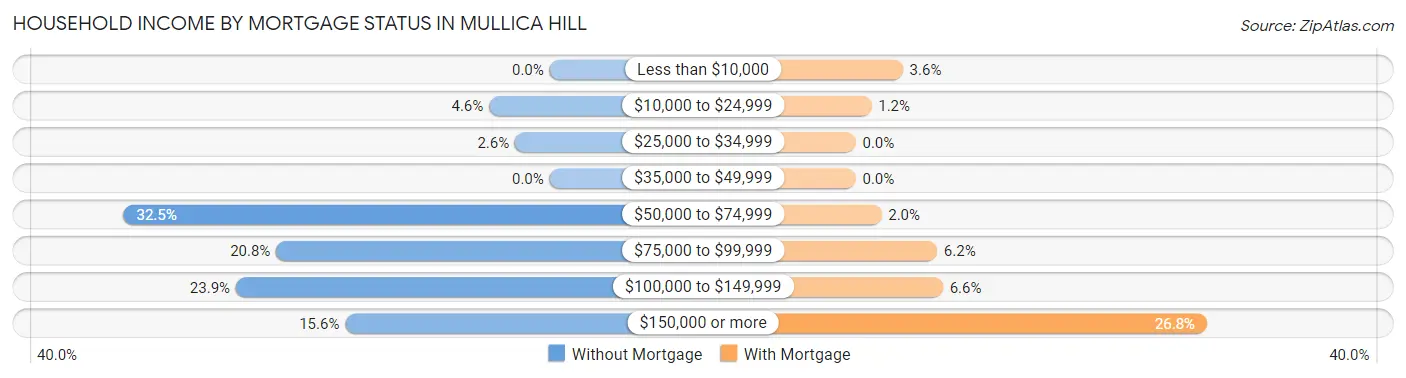
| Household Income | Without Mortgage | With Mortgage |
| Less than $10,000 | 0 (0.0%) | 33 (3.6%) |
| $10,000 to $24,999 | 21 (4.6%) | 11 (1.2%) |
| $25,000 to $34,999 | 12 (2.6%) | 0 (0.0%) |
| $35,000 to $49,999 | 0 (0.0%) | 0 (0.0%) |
| $50,000 to $74,999 | 148 (32.5%) | 18 (2.0%) |
| $75,000 to $99,999 | 95 (20.8%) | 57 (6.2%) |
| $100,000 to $149,999 | 109 (23.9%) | 61 (6.6%) |
| $150,000 or more | 71 (15.6%) | 246 (26.8%) |
| Total | 456 (100.0%) | 919 (100.0%) |
Property Value to Household Income Ratio in Mullica Hill
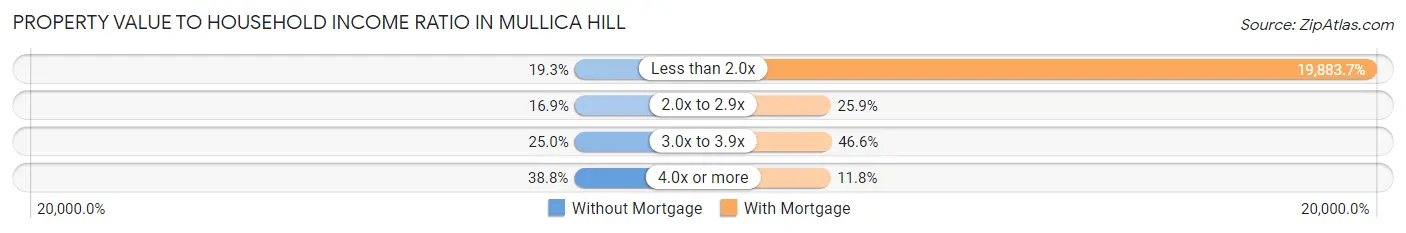
| Value-to-Income Ratio | Without Mortgage | With Mortgage |
| Less than 2.0x | 88 (19.3%) | 182,731 (19,883.7%) |
| 2.0x to 2.9x | 77 (16.9%) | 238 (25.9%) |
| 3.0x to 3.9x | 114 (25.0%) | 428 (46.6%) |
| 4.0x or more | 177 (38.8%) | 108 (11.7%) |
| Total | 456 (100.0%) | 919 (100.0%) |
Real Estate Taxes by Mortgage Status in Mullica Hill
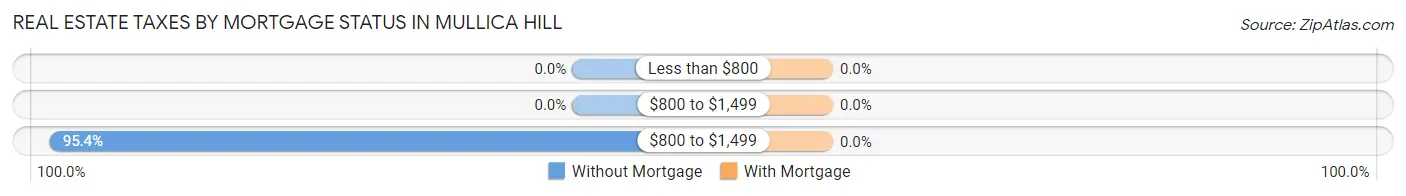
| Property Taxes | Without Mortgage | With Mortgage |
| Less than $800 | 0 (0.0%) | 0 (0.0%) |
| $800 to $1,499 | 0 (0.0%) | 0 (0.0%) |
| $800 to $1,499 | 435 (95.4%) | 0 (0.0%) |
| Total | 456 (100.0%) | 919 (100.0%) |
Health & Disability in Mullica Hill
Health Insurance Coverage by Age in Mullica Hill
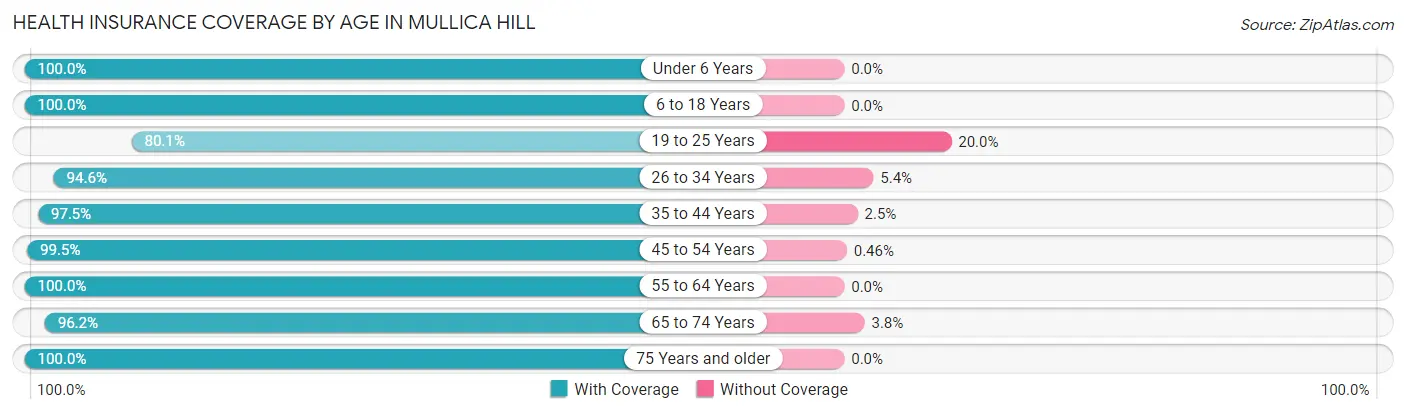
| Age Bracket | With Coverage | Without Coverage |
| Under 6 Years | 418 (100.0%) | 0 (0.0%) |
| 6 to 18 Years | 721 (100.0%) | 0 (0.0%) |
| 19 to 25 Years | 297 (80.0%) | 74 (20.0%) |
| 26 to 34 Years | 471 (94.6%) | 27 (5.4%) |
| 35 to 44 Years | 394 (97.5%) | 10 (2.5%) |
| 45 to 54 Years | 431 (99.5%) | 2 (0.5%) |
| 55 to 64 Years | 860 (100.0%) | 0 (0.0%) |
| 65 to 74 Years | 510 (96.2%) | 20 (3.8%) |
| 75 Years and older | 219 (100.0%) | 0 (0.0%) |
| Total | 4,321 (97.0%) | 133 (3.0%) |
Health Insurance Coverage by Citizenship Status in Mullica Hill
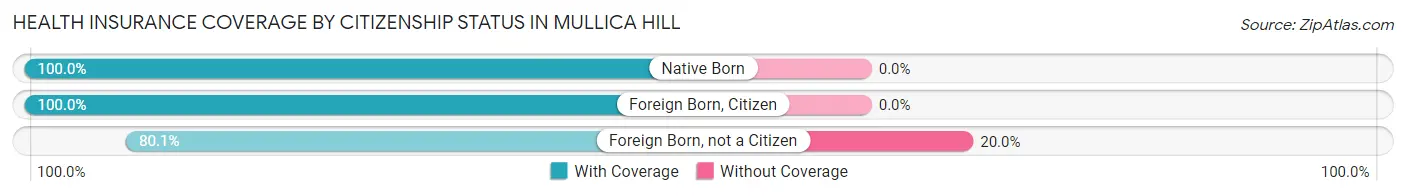
| Citizenship Status | With Coverage | Without Coverage |
| Native Born | 418 (100.0%) | 0 (0.0%) |
| Foreign Born, Citizen | 721 (100.0%) | 0 (0.0%) |
| Foreign Born, not a Citizen | 297 (80.0%) | 74 (20.0%) |
Health Insurance Coverage by Household Income in Mullica Hill
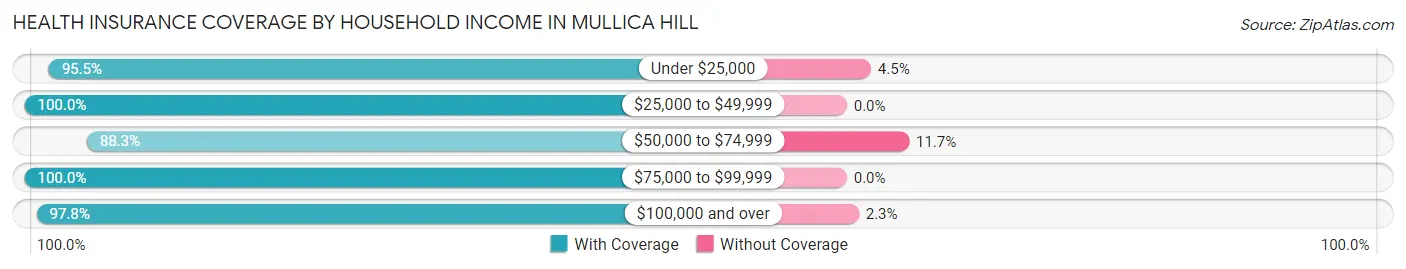
| Household Income | With Coverage | Without Coverage |
| Under $25,000 | 211 (95.5%) | 10 (4.5%) |
| $25,000 to $49,999 | 195 (100.0%) | 0 (0.0%) |
| $50,000 to $74,999 | 356 (88.3%) | 47 (11.7%) |
| $75,000 to $99,999 | 303 (100.0%) | 0 (0.0%) |
| $100,000 and over | 3,221 (97.8%) | 74 (2.2%) |
Public vs Private Health Insurance Coverage by Age in Mullica Hill
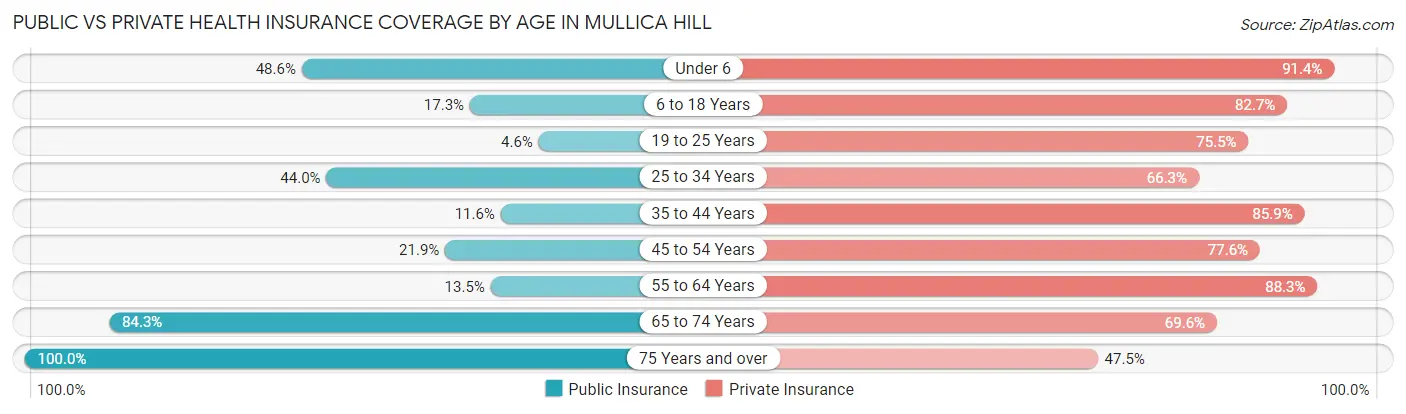
| Age Bracket | Public Insurance | Private Insurance |
| Under 6 | 203 (48.6%) | 382 (91.4%) |
| 6 to 18 Years | 125 (17.3%) | 596 (82.7%) |
| 19 to 25 Years | 17 (4.6%) | 280 (75.5%) |
| 25 to 34 Years | 219 (44.0%) | 330 (66.3%) |
| 35 to 44 Years | 47 (11.6%) | 347 (85.9%) |
| 45 to 54 Years | 95 (21.9%) | 336 (77.6%) |
| 55 to 64 Years | 116 (13.5%) | 759 (88.3%) |
| 65 to 74 Years | 447 (84.3%) | 369 (69.6%) |
| 75 Years and over | 219 (100.0%) | 104 (47.5%) |
| Total | 1,488 (33.4%) | 3,503 (78.6%) |
Disability Status by Sex by Age in Mullica Hill
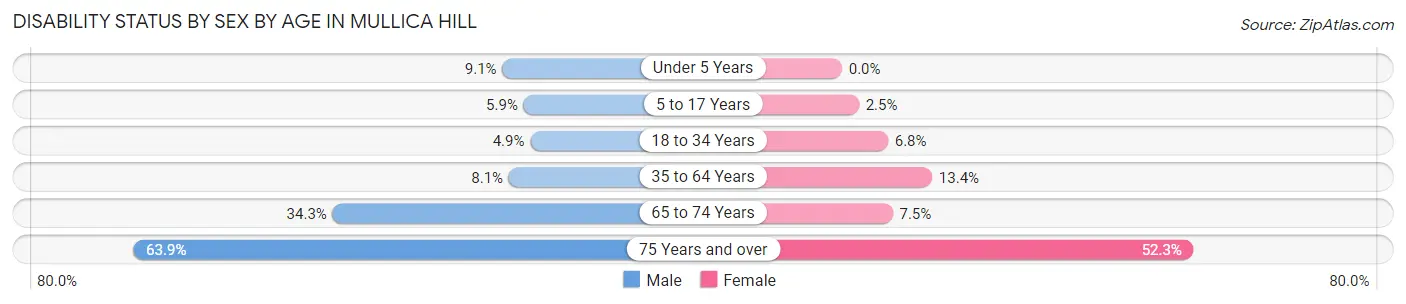
| Age Bracket | Male | Female |
| Under 5 Years | 21 (9.0%) | 0 (0.0%) |
| 5 to 17 Years | 20 (5.9%) | 8 (2.5%) |
| 18 to 34 Years | 24 (4.9%) | 31 (6.8%) |
| 35 to 64 Years | 61 (8.1%) | 126 (13.4%) |
| 65 to 74 Years | 86 (34.3%) | 21 (7.5%) |
| 75 Years and over | 69 (63.9%) | 58 (52.2%) |
Disability Class by Sex by Age in Mullica Hill
Disability Class: Hearing Difficulty
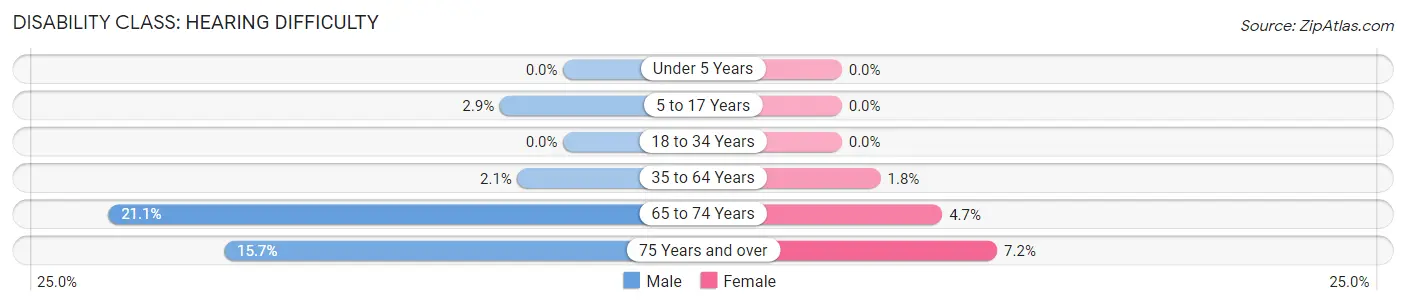
| Age Bracket | Male | Female |
| Under 5 Years | 0 (0.0%) | 0 (0.0%) |
| 5 to 17 Years | 10 (2.9%) | 0 (0.0%) |
| 18 to 34 Years | 0 (0.0%) | 0 (0.0%) |
| 35 to 64 Years | 16 (2.1%) | 17 (1.8%) |
| 65 to 74 Years | 53 (21.1%) | 13 (4.7%) |
| 75 Years and over | 17 (15.7%) | 8 (7.2%) |
Disability Class: Vision Difficulty
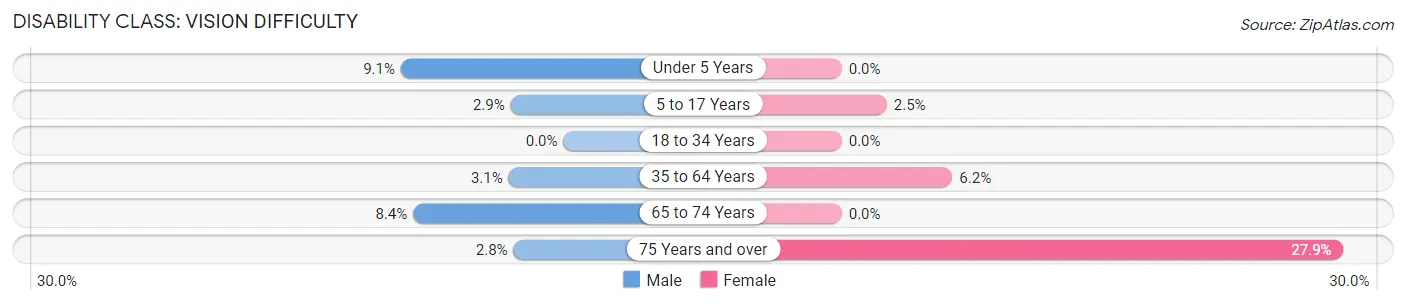
| Age Bracket | Male | Female |
| Under 5 Years | 21 (9.0%) | 0 (0.0%) |
| 5 to 17 Years | 10 (2.9%) | 8 (2.5%) |
| 18 to 34 Years | 0 (0.0%) | 0 (0.0%) |
| 35 to 64 Years | 23 (3.0%) | 58 (6.2%) |
| 65 to 74 Years | 21 (8.4%) | 0 (0.0%) |
| 75 Years and over | 3 (2.8%) | 31 (27.9%) |
Disability Class: Cognitive Difficulty
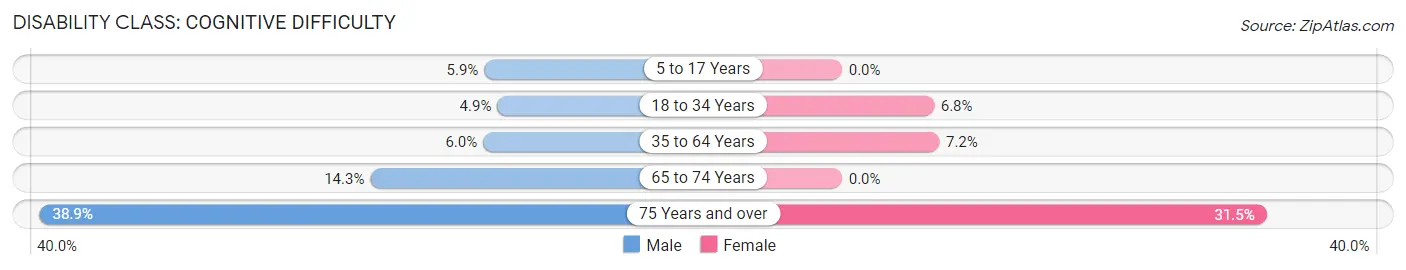
| Age Bracket | Male | Female |
| 5 to 17 Years | 20 (5.9%) | 0 (0.0%) |
| 18 to 34 Years | 24 (4.9%) | 31 (6.8%) |
| 35 to 64 Years | 45 (6.0%) | 68 (7.2%) |
| 65 to 74 Years | 36 (14.3%) | 0 (0.0%) |
| 75 Years and over | 42 (38.9%) | 35 (31.5%) |
Disability Class: Ambulatory Difficulty
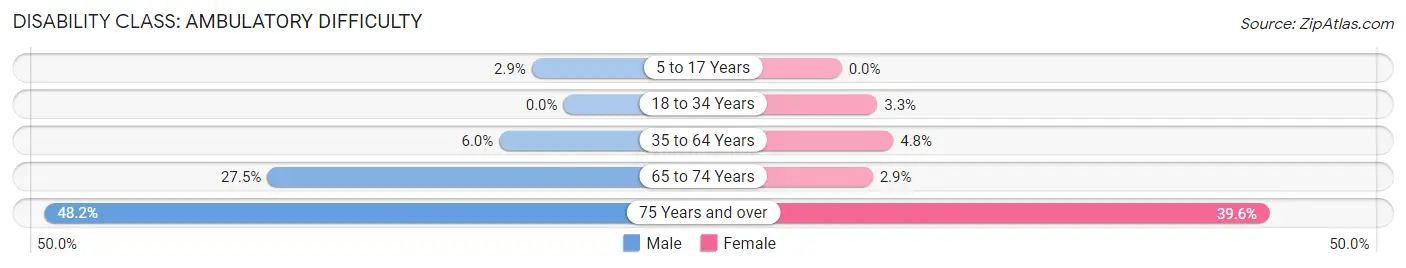
| Age Bracket | Male | Female |
| 5 to 17 Years | 10 (2.9%) | 0 (0.0%) |
| 18 to 34 Years | 0 (0.0%) | 15 (3.3%) |
| 35 to 64 Years | 45 (6.0%) | 45 (4.8%) |
| 65 to 74 Years | 69 (27.5%) | 8 (2.9%) |
| 75 Years and over | 52 (48.1%) | 44 (39.6%) |
Disability Class: Self-Care Difficulty
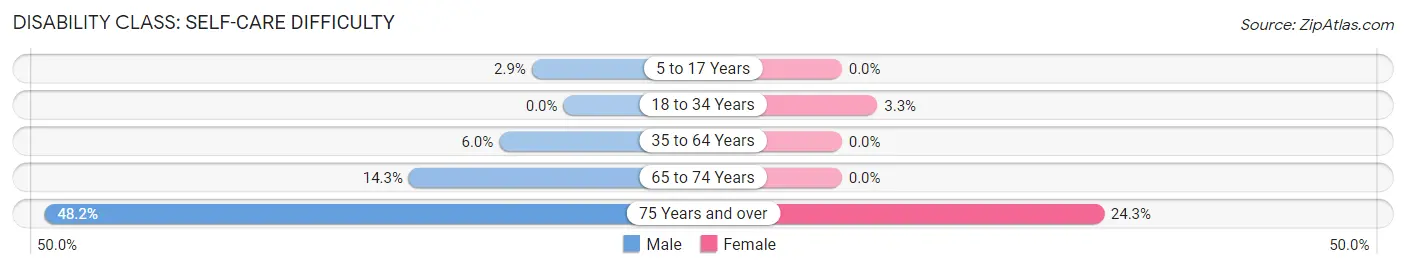
| Age Bracket | Male | Female |
| 5 to 17 Years | 10 (2.9%) | 0 (0.0%) |
| 18 to 34 Years | 0 (0.0%) | 15 (3.3%) |
| 35 to 64 Years | 45 (6.0%) | 0 (0.0%) |
| 65 to 74 Years | 36 (14.3%) | 0 (0.0%) |
| 75 Years and over | 52 (48.1%) | 27 (24.3%) |
Technology Access in Mullica Hill
Computing Device Access in Mullica Hill
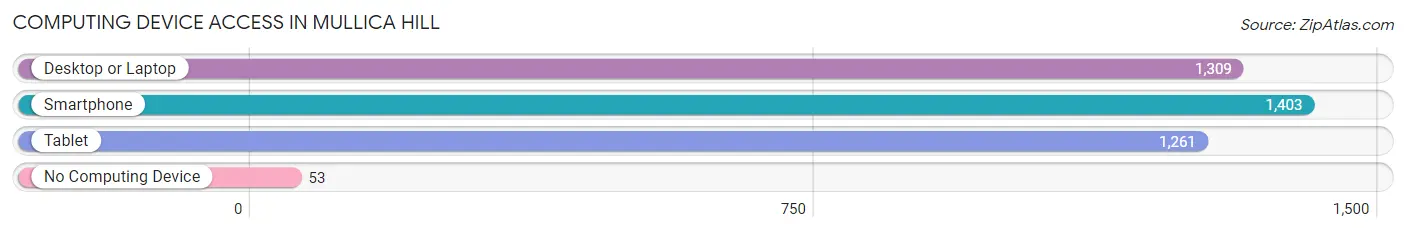
| Device Type | # Households | % Households |
| Desktop or Laptop | 1,309 | 84.0% |
| Smartphone | 1,403 | 90.0% |
| Tablet | 1,261 | 80.9% |
| No Computing Device | 53 | 3.4% |
| Total | 1,558 | 100.0% |
Internet Access in Mullica Hill
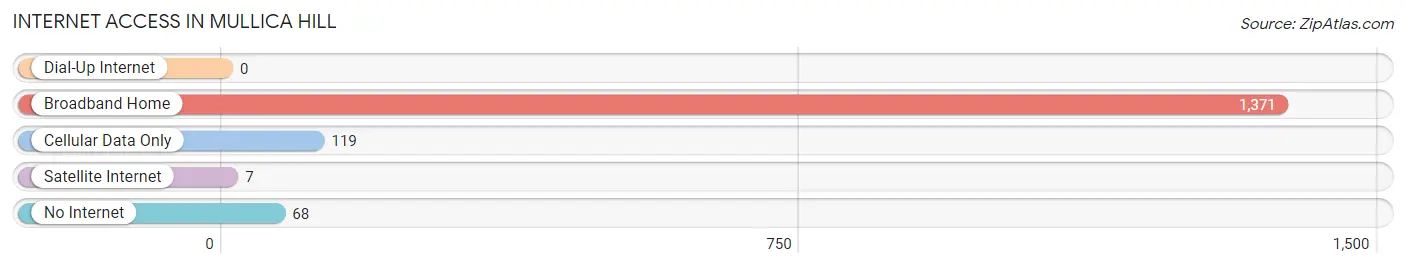
| Internet Type | # Households | % Households |
| Dial-Up Internet | 0 | 0.0% |
| Broadband Home | 1,371 | 88.0% |
| Cellular Data Only | 119 | 7.6% |
| Satellite Internet | 7 | 0.4% |
| No Internet | 68 | 4.4% |
| Total | 1,558 | 100.0% |
Mullica Hill Summary
Mullica Hill is an unincorporated community located in Harrison Township, Gloucester County, New Jersey. It is situated along the banks of the Mullica River, approximately 10 miles south of Philadelphia. The area was first settled in the early 1700s by Swedish and Dutch immigrants, and the town was officially established in 1844. The town is known for its historic buildings, quaint shops, and picturesque scenery.
History
Mullica Hill was first settled in the early 1700s by Swedish and Dutch immigrants. The area was originally known as “Mullica’s Hill” after the Swedish settler, John Mullica, who purchased the land in 1703. The town was officially established in 1844 and was named after the Mullica family.
The town was an important stop on the Underground Railroad, with many of the local Quaker families providing shelter and assistance to escaped slaves. The town was also home to several prominent abolitionists, including Thomas Garrett and William Still.
In the late 19th century, Mullica Hill became a popular summer resort destination for wealthy Philadelphians. The town was home to several large resorts, including the Mullica Hill Hotel, which was built in 1876.
Geography
Mullica Hill is located in Harrison Township, Gloucester County, New Jersey. It is situated along the banks of the Mullica River, approximately 10 miles south of Philadelphia. The town is bordered by Mantua Township to the north, Woolwich Township to the east, and Elk Township to the south.
The town has a total area of 4.2 square miles, all of which is land. The terrain is mostly flat, with some rolling hills. The town is located in the Atlantic Coastal Plain, and is part of the Pine Barrens region.
Economy
Mullica Hill is a primarily residential community, with a small commercial district. The town is home to several small businesses, including restaurants, shops, and professional services. The town is also home to several wineries, including the Heritage Vineyards and the Amalthea Cellars.
The town is also home to several large employers, including the Inspira Health Network, which operates a hospital and several medical centers in the area. The town is also home to several educational institutions, including Rowan University and Gloucester County College.
Demographics
As of the 2010 census, Mullica Hill had a population of 2,541. The racial makeup of the town was 94.3% White, 2.2% African American, 0.3% Native American, 0.9% Asian, 0.1% Pacific Islander, and 1.2% from other races. Hispanic or Latino of any race were 3.2% of the population.
The median household income in Mullica Hill was $87,917, and the median family income was $97,917. The per capita income was $37,917. About 4.2% of families and 5.2% of the population were below the poverty line.
Common Questions
What is Per Capita Income in Mullica Hill?
Per Capita income in Mullica Hill is $47,514.
What is the Median Family Income in Mullica Hill?
Median Family Income in Mullica Hill is $148,750.
What is the Median Household income in Mullica Hill?
Median Household Income in Mullica Hill is $123,265.
What is Income or Wage Gap in Mullica Hill?
Income or Wage Gap in Mullica Hill is 36.7%.
Women in Mullica Hill earn 63.3 cents for every dollar earned by a man.
What is Family Income Deficit in Mullica Hill?
Family Income Deficit in Mullica Hill is $17,954.
Families that are below poverty line in Mullica Hill earn $17,954 less on average than the poverty threshold level.
What is Inequality or Gini Index in Mullica Hill?
Inequality or Gini Index in Mullica Hill is 0.35.
What is the Total Population of Mullica Hill?
Total Population of Mullica Hill is 4,454.
What is the Total Male Population of Mullica Hill?
Total Male Population of Mullica Hill is 2,175.
What is the Total Female Population of Mullica Hill?
Total Female Population of Mullica Hill is 2,279.
What is the Ratio of Males per 100 Females in Mullica Hill?
There are 95.44 Males per 100 Females in Mullica Hill.
What is the Ratio of Females per 100 Males in Mullica Hill?
There are 104.78 Females per 100 Males in Mullica Hill.
What is the Median Population Age in Mullica Hill?
Median Population Age in Mullica Hill is 41.0 Years.
What is the Average Family Size in Mullica Hill
Average Family Size in Mullica Hill is 3.3 People.
What is the Average Household Size in Mullica Hill
Average Household Size in Mullica Hill is 2.8 People.
How Large is the Labor Force in Mullica Hill?
There are 2,162 People in the Labor Forcein in Mullica Hill.
What is the Percentage of People in the Labor Force in Mullica Hill?
60.7% of People are in the Labor Force in Mullica Hill.
What is the Unemployment Rate in Mullica Hill?
Unemployment Rate in Mullica Hill is 4.9%.