Cities with the Most Immigrants from Belarus in New Jersey
RELATED REPORTS & OPTIONS
Belarus
New Jersey
Compare Cities
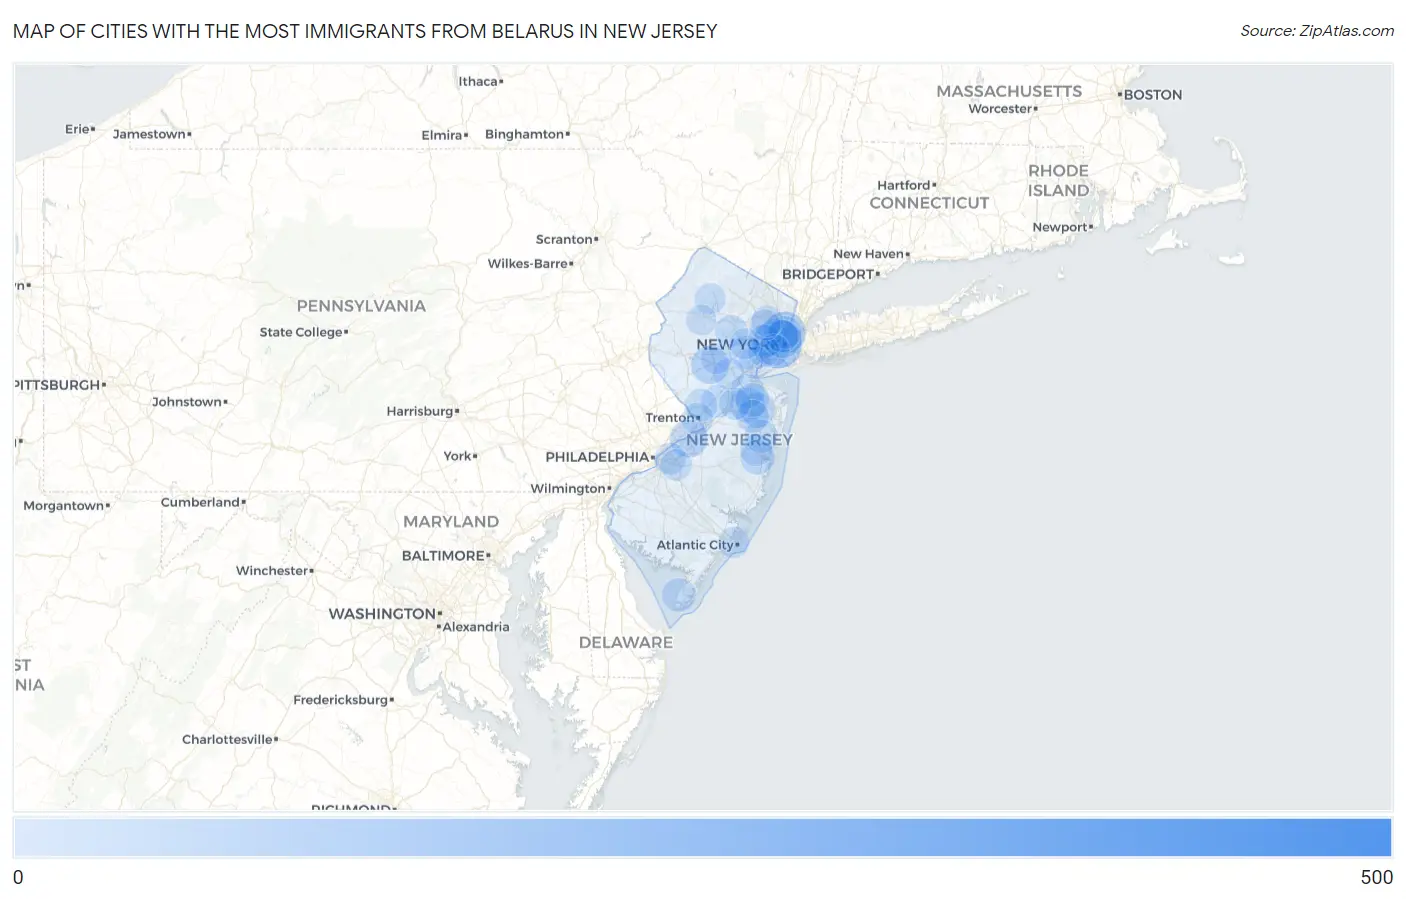
Map of Cities with the Most Immigrants from Belarus in New Jersey
0
500
Cities with the Most Immigrants from Belarus in New Jersey
| City | Belarus | vs State | vs National | |
| 1. | Fair Lawn Borough | 457 | 4,579(9.98%)#1 | 71,687(0.64%)#11 |
| 2. | Wallington Borough | 207 | 4,579(4.52%)#2 | 71,687(0.29%)#37 |
| 3. | Hillsborough | 206 | 4,579(4.50%)#3 | 71,687(0.29%)#38 |
| 4. | Jersey City | 171 | 4,579(3.73%)#4 | 71,687(0.24%)#49 |
| 5. | Riverdale Borough | 116 | 4,579(2.53%)#5 | 71,687(0.16%)#78 |
| 6. | Fort Lee Borough | 105 | 4,579(2.29%)#6 | 71,687(0.15%)#94 |
| 7. | West New York | 104 | 4,579(2.27%)#7 | 71,687(0.15%)#95 |
| 8. | Little Ferry Borough | 95 | 4,579(2.07%)#8 | 71,687(0.13%)#113 |
| 9. | Edgewater Borough | 76 | 4,579(1.66%)#9 | 71,687(0.11%)#144 |
| 10. | Hoboken | 73 | 4,579(1.59%)#10 | 71,687(0.10%)#155 |
| 11. | Bradley Gardens | 68 | 4,579(1.49%)#11 | 71,687(0.09%)#170 |
| 12. | Burlington | 67 | 4,579(1.46%)#12 | 71,687(0.09%)#172 |
| 13. | Cliffside Park Borough | 53 | 4,579(1.16%)#13 | 71,687(0.07%)#226 |
| 14. | Gillette | 51 | 4,579(1.11%)#14 | 71,687(0.07%)#234 |
| 15. | Yorketown | 43 | 4,579(0.94%)#15 | 71,687(0.06%)#278 |
| 16. | East Freehold | 43 | 4,579(0.94%)#16 | 71,687(0.06%)#281 |
| 17. | Paramus Borough | 42 | 4,579(0.92%)#17 | 71,687(0.06%)#288 |
| 18. | Closter Borough | 41 | 4,579(0.90%)#18 | 71,687(0.06%)#297 |
| 19. | Hillsdale Borough | 39 | 4,579(0.85%)#19 | 71,687(0.05%)#311 |
| 20. | Old Bridge | 36 | 4,579(0.79%)#20 | 71,687(0.05%)#326 |
| 21. | Holiday City South | 36 | 4,579(0.79%)#21 | 71,687(0.05%)#328 |
| 22. | Elmwood Park Borough | 35 | 4,579(0.76%)#22 | 71,687(0.05%)#333 |
| 23. | Oradell Borough | 34 | 4,579(0.74%)#23 | 71,687(0.05%)#347 |
| 24. | Robertsville | 32 | 4,579(0.70%)#24 | 71,687(0.04%)#369 |
| 25. | Villas | 31 | 4,579(0.68%)#25 | 71,687(0.04%)#374 |
| 26. | Montvale Borough | 31 | 4,579(0.68%)#26 | 71,687(0.04%)#376 |
| 27. | Newark | 30 | 4,579(0.66%)#27 | 71,687(0.04%)#380 |
| 28. | Westfield | 29 | 4,579(0.63%)#28 | 71,687(0.04%)#398 |
| 29. | Parsippany | 29 | 4,579(0.63%)#29 | 71,687(0.04%)#402 |
| 30. | Lakewood | 25 | 4,579(0.55%)#30 | 71,687(0.03%)#448 |
| 31. | Plainsboro Center | 25 | 4,579(0.55%)#31 | 71,687(0.03%)#455 |
| 32. | Lincoln Park Borough | 24 | 4,579(0.52%)#32 | 71,687(0.03%)#471 |
| 33. | North Arlington Borough | 23 | 4,579(0.50%)#33 | 71,687(0.03%)#484 |
| 34. | West Freehold | 23 | 4,579(0.50%)#34 | 71,687(0.03%)#485 |
| 35. | Freehold Borough | 23 | 4,579(0.50%)#35 | 71,687(0.03%)#487 |
| 36. | Guttenberg | 23 | 4,579(0.50%)#36 | 71,687(0.03%)#488 |
| 37. | Runnemede Borough | 23 | 4,579(0.50%)#37 | 71,687(0.03%)#490 |
| 38. | Mount Arlington Borough | 23 | 4,579(0.50%)#38 | 71,687(0.03%)#491 |
| 39. | Garwood Borough | 23 | 4,579(0.50%)#39 | 71,687(0.03%)#492 |
| 40. | Morristown | 22 | 4,579(0.48%)#40 | 71,687(0.03%)#504 |
| 41. | Lawrenceville | 21 | 4,579(0.46%)#41 | 71,687(0.03%)#526 |
| 42. | Sea Bright Borough | 21 | 4,579(0.46%)#42 | 71,687(0.03%)#527 |
| 43. | Brielle Borough | 20 | 4,579(0.44%)#43 | 71,687(0.03%)#547 |
| 44. | Avenel | 19 | 4,579(0.41%)#44 | 71,687(0.03%)#557 |
| 45. | Pine Lake Park | 18 | 4,579(0.39%)#45 | 71,687(0.03%)#574 |
| 46. | Union City | 17 | 4,579(0.37%)#46 | 71,687(0.02%)#582 |
| 47. | New Providence Borough | 17 | 4,579(0.37%)#47 | 71,687(0.02%)#595 |
| 48. | Cresskill Borough | 17 | 4,579(0.37%)#48 | 71,687(0.02%)#596 |
| 49. | Caldwell Borough | 17 | 4,579(0.37%)#49 | 71,687(0.02%)#597 |
| 50. | Concordia | 16 | 4,579(0.35%)#50 | 71,687(0.02%)#622 |
| 51. | Elizabeth | 15 | 4,579(0.33%)#51 | 71,687(0.02%)#628 |
| 52. | Sayreville Borough | 15 | 4,579(0.33%)#52 | 71,687(0.02%)#632 |
| 53. | North Haledon Borough | 15 | 4,579(0.33%)#53 | 71,687(0.02%)#639 |
| 54. | Fanwood Borough | 15 | 4,579(0.33%)#54 | 71,687(0.02%)#641 |
| 55. | Trenton | 14 | 4,579(0.31%)#55 | 71,687(0.02%)#651 |
| 56. | Cherry Hill Mall | 14 | 4,579(0.31%)#56 | 71,687(0.02%)#661 |
| 57. | Bayonne | 13 | 4,579(0.28%)#57 | 71,687(0.02%)#675 |
| 58. | South River Borough | 13 | 4,579(0.28%)#58 | 71,687(0.02%)#686 |
| 59. | Spotswood Borough | 13 | 4,579(0.28%)#59 | 71,687(0.02%)#694 |
| 60. | Clifton | 12 | 4,579(0.26%)#60 | 71,687(0.02%)#703 |
| 61. | Somerset | 12 | 4,579(0.26%)#61 | 71,687(0.02%)#715 |
| 62. | Greentree | 12 | 4,579(0.26%)#62 | 71,687(0.02%)#721 |
| 63. | South Bound Brook Borough | 12 | 4,579(0.26%)#63 | 71,687(0.02%)#725 |
| 64. | Shrewsbury Borough | 12 | 4,579(0.26%)#64 | 71,687(0.02%)#727 |
| 65. | Lake Como Borough | 12 | 4,579(0.26%)#65 | 71,687(0.02%)#730 |
| 66. | Bellmawr Borough | 10 | 4,579(0.22%)#66 | 71,687(0.01%)#766 |
| 67. | Lake Mohawk | 10 | 4,579(0.22%)#67 | 71,687(0.01%)#767 |
| 68. | Englishtown Borough | 10 | 4,579(0.22%)#68 | 71,687(0.01%)#772 |
| 69. | Atlantic City | 9 | 4,579(0.20%)#69 | 71,687(0.01%)#786 |
| 70. | Summit | 9 | 4,579(0.20%)#70 | 71,687(0.01%)#793 |
| 71. | Lindenwold Borough | 8 | 4,579(0.17%)#71 | 71,687(0.01%)#818 |
| 72. | Brookdale | 7 | 4,579(0.15%)#72 | 71,687(0.01%)#857 |
| 73. | Green Knoll | 7 | 4,579(0.15%)#73 | 71,687(0.01%)#862 |
| 74. | Demarest Borough | 7 | 4,579(0.15%)#74 | 71,687(0.01%)#865 |
| 75. | Franklin Lakes Borough | 6 | 4,579(0.13%)#75 | 71,687(0.01%)#885 |
| 76. | Stockton Borough | 6 | 4,579(0.13%)#76 | 71,687(0.01%)#897 |
| 77. | Budd Lake | 5 | 4,579(0.11%)#77 | 71,687(0.01%)#910 |
| 78. | South Plainfield Borough | 4 | 4,579(0.09%)#78 | 71,687(0.01%)#925 |
| 79. | Menlo Park Terrace | 4 | 4,579(0.09%)#79 | 71,687(0.01%)#930 |
| 80. | Millington | 4 | 4,579(0.09%)#80 | 71,687(0.01%)#931 |
Common Questions
What are the Top 10 Cities with the Most Immigrants from Belarus in New Jersey?
Top 10 Cities with the Most Immigrants from Belarus in New Jersey are:
#1
171
#2
104
#3
73
#4
68
#5
67
#6
43
#7
43
#8
36
#9
36
#10
32
What city has the Most Immigrants from Belarus in New Jersey?
Jersey City has the Most Immigrants from Belarus in New Jersey with 171.
What is the Total Immigrants from Belarus in the State of New Jersey?
Total Immigrants from Belarus in New Jersey is 4,579.
What is the Total Immigrants from Belarus in the United States?
Total Immigrants from Belarus in the United States is 71,687.