Cities with the Most Immigrants from Sri Lanka in New Jersey
RELATED REPORTS & OPTIONS
Sri Lanka
New Jersey
Compare Cities
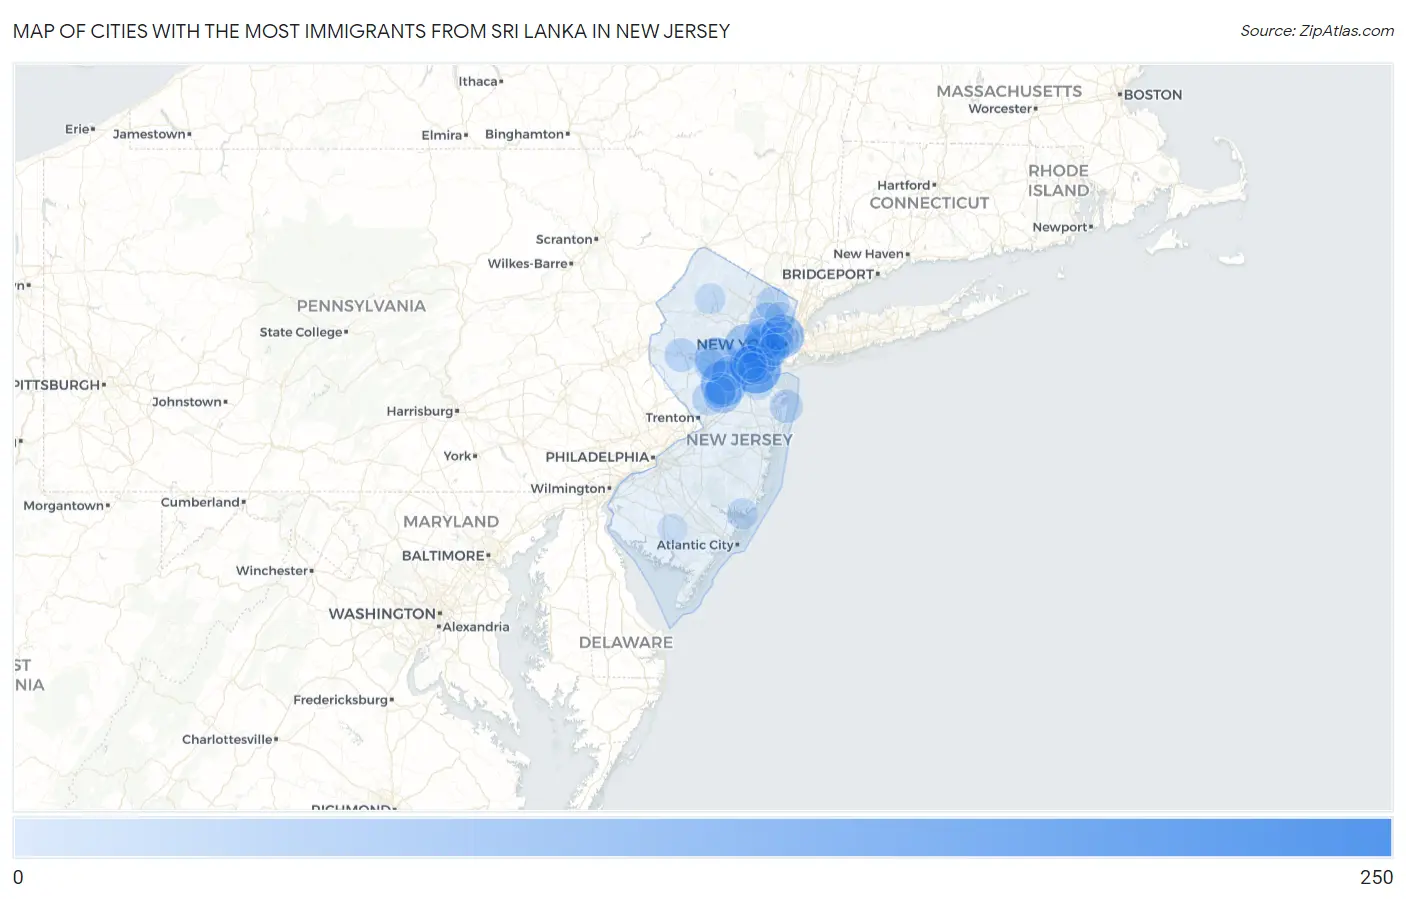
Map of Cities with the Most Immigrants from Sri Lanka in New Jersey
0
250
Cities with the Most Immigrants from Sri Lanka in New Jersey
| City | Sri Lanka | vs State | vs National | |
| 1. | South Plainfield Borough | 226 | 3,488(6.48%)#1 | 56,619(0.40%)#26 |
| 2. | Sewaren | 136 | 3,488(3.90%)#2 | 56,619(0.24%)#55 |
| 3. | Fairview Borough | 117 | 3,488(3.35%)#3 | 56,619(0.21%)#76 |
| 4. | Franklin Park | 110 | 3,488(3.15%)#4 | 56,619(0.19%)#85 |
| 5. | Hillsborough | 103 | 3,488(2.95%)#5 | 56,619(0.18%)#92 |
| 6. | Elizabeth | 92 | 3,488(2.64%)#6 | 56,619(0.16%)#108 |
| 7. | Union City | 91 | 3,488(2.61%)#7 | 56,619(0.16%)#112 |
| 8. | Green Knoll | 88 | 3,488(2.52%)#8 | 56,619(0.16%)#117 |
| 9. | Iselin | 78 | 3,488(2.24%)#9 | 56,619(0.14%)#137 |
| 10. | Mckee | 67 | 3,488(1.92%)#10 | 56,619(0.12%)#166 |
| 11. | Summit | 64 | 3,488(1.83%)#11 | 56,619(0.11%)#177 |
| 12. | Monmouth Junction | 59 | 3,488(1.69%)#12 | 56,619(0.10%)#200 |
| 13. | Cresskill Borough | 55 | 3,488(1.58%)#13 | 56,619(0.10%)#217 |
| 14. | Newark | 52 | 3,488(1.49%)#14 | 56,619(0.09%)#228 |
| 15. | Clifton | 47 | 3,488(1.35%)#15 | 56,619(0.08%)#257 |
| 16. | Port Reading | 46 | 3,488(1.32%)#16 | 56,619(0.08%)#265 |
| 17. | Bogota Borough | 44 | 3,488(1.26%)#17 | 56,619(0.08%)#279 |
| 18. | Mountain Lakes Borough | 43 | 3,488(1.23%)#18 | 56,619(0.08%)#291 |
| 19. | Sayreville Borough | 39 | 3,488(1.12%)#19 | 56,619(0.07%)#313 |
| 20. | Somerset | 34 | 3,488(0.97%)#20 | 56,619(0.06%)#353 |
| 21. | East Orange | 33 | 3,488(0.95%)#21 | 56,619(0.06%)#364 |
| 22. | Fair Lawn Borough | 29 | 3,488(0.83%)#22 | 56,619(0.05%)#403 |
| 23. | Tenafly Borough | 29 | 3,488(0.83%)#23 | 56,619(0.05%)#407 |
| 24. | New Milford Borough | 27 | 3,488(0.77%)#24 | 56,619(0.05%)#429 |
| 25. | Troy Hills | 27 | 3,488(0.77%)#25 | 56,619(0.05%)#430 |
| 26. | Hoboken | 26 | 3,488(0.75%)#26 | 56,619(0.05%)#437 |
| 27. | Ridgewood | 26 | 3,488(0.75%)#27 | 56,619(0.05%)#442 |
| 28. | Cliffside Park Borough | 26 | 3,488(0.75%)#28 | 56,619(0.05%)#443 |
| 29. | Clinton | 25 | 3,488(0.72%)#29 | 56,619(0.04%)#457 |
| 30. | Princeton | 23 | 3,488(0.66%)#30 | 56,619(0.04%)#468 |
| 31. | Long Branch | 22 | 3,488(0.63%)#31 | 56,619(0.04%)#485 |
| 32. | Colonia | 22 | 3,488(0.63%)#32 | 56,619(0.04%)#489 |
| 33. | Raritan Borough | 22 | 3,488(0.63%)#33 | 56,619(0.04%)#491 |
| 34. | Secaucus | 20 | 3,488(0.57%)#34 | 56,619(0.04%)#510 |
| 35. | Jersey City | 18 | 3,488(0.52%)#35 | 56,619(0.03%)#529 |
| 36. | The College Of New Jersey | 18 | 3,488(0.52%)#36 | 56,619(0.03%)#546 |
| 37. | Rutherford Borough | 17 | 3,488(0.49%)#37 | 56,619(0.03%)#562 |
| 38. | Laurence Harbor | 14 | 3,488(0.40%)#38 | 56,619(0.02%)#630 |
| 39. | Bayonne | 13 | 3,488(0.37%)#39 | 56,619(0.02%)#636 |
| 40. | Harrington Park Borough | 13 | 3,488(0.37%)#40 | 56,619(0.02%)#649 |
| 41. | Kendall Park | 12 | 3,488(0.34%)#41 | 56,619(0.02%)#666 |
| 42. | Heathcote | 12 | 3,488(0.34%)#42 | 56,619(0.02%)#670 |
| 43. | Bradley Gardens | 10 | 3,488(0.29%)#43 | 56,619(0.02%)#722 |
| 44. | Chatham Borough | 10 | 3,488(0.29%)#44 | 56,619(0.02%)#723 |
| 45. | New Providence Borough | 9 | 3,488(0.26%)#45 | 56,619(0.02%)#742 |
| 46. | Mystic Island | 8 | 3,488(0.23%)#46 | 56,619(0.01%)#767 |
| 47. | Rockaway Borough | 8 | 3,488(0.23%)#47 | 56,619(0.01%)#768 |
| 48. | Eatontown Borough | 7 | 3,488(0.20%)#48 | 56,619(0.01%)#781 |
| 49. | Hackensack | 6 | 3,488(0.17%)#49 | 56,619(0.01%)#792 |
| 50. | Lake Mohawk | 6 | 3,488(0.17%)#50 | 56,619(0.01%)#795 |
| 51. | Hampton Borough | 2 | 3,488(0.06%)#51 | 56,619(0.00%)#853 |
| 52. | Vineland | 1 | 3,488(0.03%)#52 | 56,619(0.00%)#859 |
| 53. | Woodbridge | 1 | 3,488(0.03%)#53 | 56,619(0.00%)#862 |
| 54. | Metuchen Borough | 1 | 3,488(0.03%)#54 | 56,619(0.00%)#868 |
| 55. | Woodland Park Borough | 1 | 3,488(0.03%)#55 | 56,619(0.00%)#869 |
| 56. | Caldwell Borough | 1 | 3,488(0.03%)#56 | 56,619(0.00%)#871 |
| 57. | Othello | 1 | 3,488(0.03%)#57 | 56,619(0.00%)#881 |
Common Questions
What are the Top 10 Cities with the Most Immigrants from Sri Lanka in New Jersey?
Top 10 Cities with the Most Immigrants from Sri Lanka in New Jersey are:
#1
136
#2
110
#3
92
#4
91
#5
88
#6
78
#7
64
#8
59
#9
52
#10
47
What city has the Most Immigrants from Sri Lanka in New Jersey?
Sewaren has the Most Immigrants from Sri Lanka in New Jersey with 136.
What is the Total Immigrants from Sri Lanka in the State of New Jersey?
Total Immigrants from Sri Lanka in New Jersey is 3,488.
What is the Total Immigrants from Sri Lanka in the United States?
Total Immigrants from Sri Lanka in the United States is 56,619.