Cities with the Highest Percentage of Immigrants from Honduras in New Jersey
RELATED REPORTS & OPTIONS
Honduras
New Jersey
Compare Cities
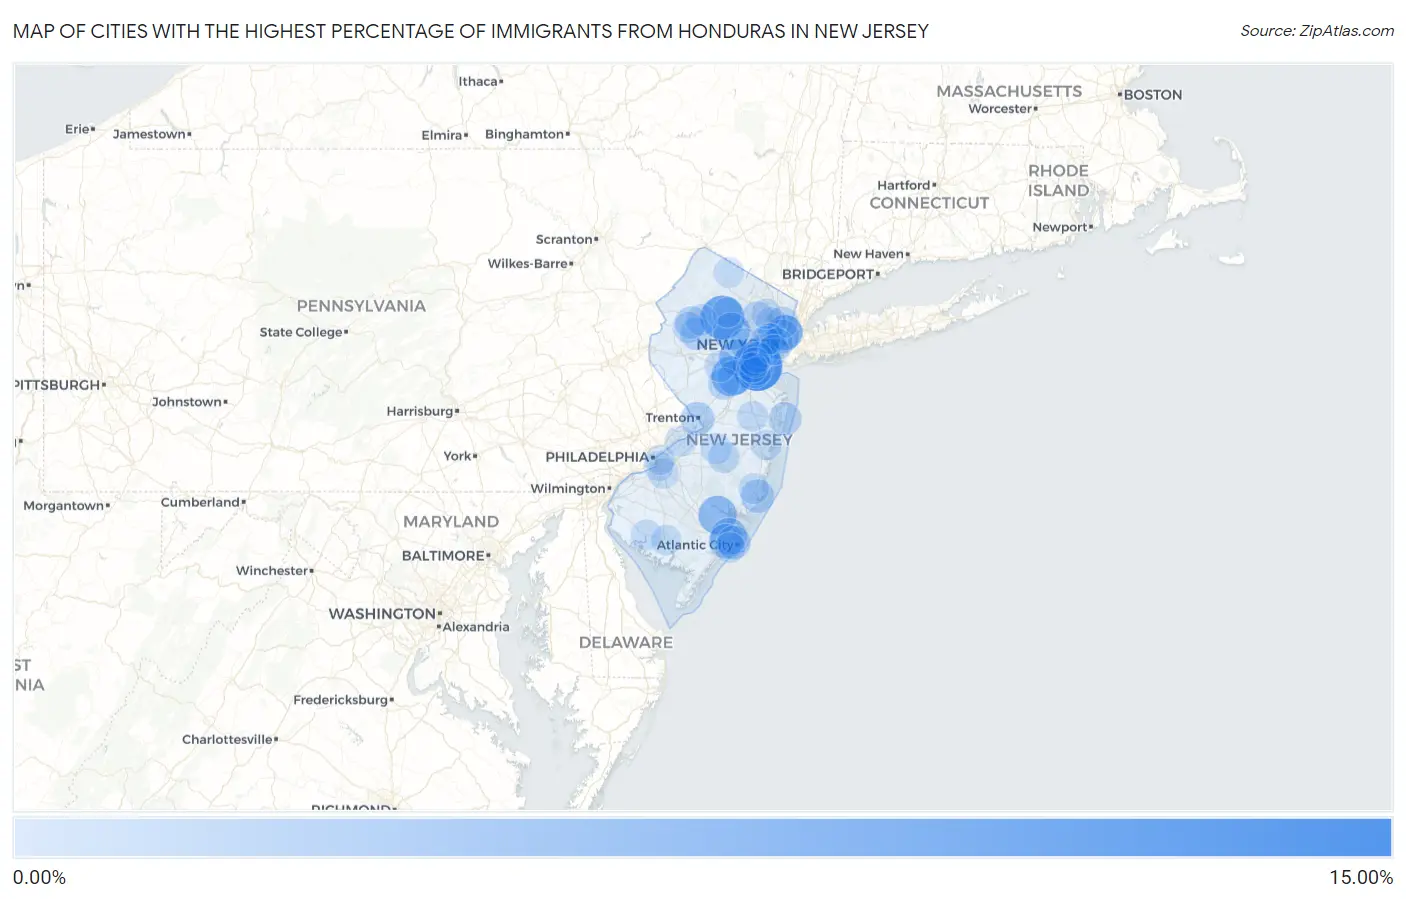
Map of Cities with the Highest Percentage of Immigrants from Honduras in New Jersey
0.00%
15.00%
Cities with the Highest Percentage of Immigrants from Honduras in New Jersey
| City | Honduras | vs State | vs National | |
| 1. | Port Reading | 10.27% | 0.40%(+9.87)#-1 | 0.22%(+10.1)#0 |
| 2. | Dover | 7.26% | 0.40%(+6.85)#0 | 0.22%(+7.04)#1 |
| 3. | Victory Gardens Borough | 6.93% | 0.40%(+6.52)#1 | 0.22%(+6.71)#2 |
| 4. | East Franklin | 5.21% | 0.40%(+4.81)#2 | 0.22%(+4.99)#3 |
| 5. | Cedar Knolls | 4.81% | 0.40%(+4.40)#3 | 0.22%(+4.59)#4 |
| 6. | Egg Harbor City | 4.46% | 0.40%(+4.05)#4 | 0.22%(+4.24)#5 |
| 7. | Morristown | 3.87% | 0.40%(+3.47)#5 | 0.22%(+3.65)#6 |
| 8. | Plainfield | 3.54% | 0.40%(+3.14)#6 | 0.22%(+3.32)#46 |
| 9. | Absecon | 3.53% | 0.40%(+3.13)#7 | 0.22%(+3.31)#47 |
| 10. | Lindenwold Borough | 2.99% | 0.40%(+2.59)#8 | 0.22%(+2.77)#48 |
| 11. | Guttenberg | 2.86% | 0.40%(+2.45)#9 | 0.22%(+2.64)#49 |
| 12. | South River Borough | 2.85% | 0.40%(+2.44)#10 | 0.22%(+2.63)#50 |
| 13. | West New York | 2.70% | 0.40%(+2.30)#11 | 0.22%(+2.48)#51 |
| 14. | Pleasantville | 2.64% | 0.40%(+2.23)#12 | 0.22%(+2.42)#52 |
| 15. | New Brunswick | 2.58% | 0.40%(+2.18)#13 | 0.22%(+2.36)#175 |
| 16. | Netcong Borough | 2.24% | 0.40%(+1.84)#14 | 0.22%(+2.02)#176 |
| 17. | Atlantic City | 2.05% | 0.40%(+1.65)#15 | 0.22%(+1.83)#177 |
| 18. | Manahawkin | 2.00% | 0.40%(+1.60)#16 | 0.22%(+1.78)#178 |
| 19. | Trenton | 2.00% | 0.40%(+1.59)#17 | 0.22%(+1.78)#179 |
| 20. | Union City | 1.90% | 0.40%(+1.49)#18 | 0.22%(+1.68)#180 |
| 21. | Lodi Borough | 1.86% | 0.40%(+1.46)#19 | 0.22%(+1.64)#181 |
| 22. | Sewaren | 1.86% | 0.40%(+1.45)#20 | 0.22%(+1.64)#182 |
| 23. | Elizabeth | 1.74% | 0.40%(+1.34)#21 | 0.22%(+1.52)#183 |
| 24. | Ocean Grove | 1.69% | 0.40%(+1.29)#22 | 0.22%(+1.47)#184 |
| 25. | Rockaway Borough | 1.55% | 0.40%(+1.14)#23 | 0.22%(+1.33)#185 |
| 26. | Long Valley | 1.52% | 0.40%(+1.11)#24 | 0.22%(+1.30)#186 |
| 27. | Little Ferry Borough | 1.46% | 0.40%(+1.06)#25 | 0.22%(+1.24)#187 |
| 28. | Lakehurst Borough | 1.43% | 0.40%(+1.03)#26 | 0.22%(+1.21)#188 |
| 29. | Hackettstown | 1.30% | 0.40%(+0.892)#27 | 0.22%(+1.08)#189 |
| 30. | Singac | 1.29% | 0.40%(+0.890)#28 | 0.22%(+1.07)#190 |
| 31. | North Plainfield Borough | 1.24% | 0.40%(+0.839)#29 | 0.22%(+1.02)#191 |
| 32. | Carteret Borough | 1.19% | 0.40%(+0.785)#30 | 0.22%(+0.969)#192 |
| 33. | Flanders | 1.15% | 0.40%(+0.742)#31 | 0.22%(+0.926)#193 |
| 34. | Franklin Park | 1.13% | 0.40%(+0.729)#32 | 0.22%(+0.913)#194 |
| 35. | Ridgefield Park | 1.12% | 0.40%(+0.713)#33 | 0.22%(+0.897)#195 |
| 36. | Brookside | 1.08% | 0.40%(+0.672)#34 | 0.22%(+0.856)#196 |
| 37. | Rahway | 0.98% | 0.40%(+0.581)#35 | 0.22%(+0.765)#197 |
| 38. | Roosevelt Borough | 0.96% | 0.40%(+0.561)#36 | 0.22%(+0.745)#198 |
| 39. | Stratford Borough | 0.92% | 0.40%(+0.516)#37 | 0.22%(+0.700)#199 |
| 40. | Landing | 0.90% | 0.40%(+0.492)#38 | 0.22%(+0.676)#200 |
| 41. | Budd Lake | 0.88% | 0.40%(+0.478)#39 | 0.22%(+0.662)#201 |
| 42. | Milltown Borough | 0.87% | 0.40%(+0.466)#40 | 0.22%(+0.650)#202 |
| 43. | Manville Borough | 0.86% | 0.40%(+0.459)#41 | 0.22%(+0.643)#203 |
| 44. | Beattystown | 0.83% | 0.40%(+0.430)#42 | 0.22%(+0.614)#204 |
| 45. | Alpine Borough | 0.83% | 0.40%(+0.424)#43 | 0.22%(+0.608)#205 |
| 46. | Country Lake Estates | 0.81% | 0.40%(+0.410)#44 | 0.22%(+0.594)#206 |
| 47. | Helmetta Borough | 0.78% | 0.40%(+0.378)#45 | 0.22%(+0.562)#207 |
| 48. | Jersey City | 0.77% | 0.40%(+0.366)#46 | 0.22%(+0.550)#208 |
| 49. | Perth Amboy | 0.75% | 0.40%(+0.348)#47 | 0.22%(+0.532)#209 |
| 50. | Finderne | 0.75% | 0.40%(+0.345)#48 | 0.22%(+0.529)#210 |
| 51. | Bound Brook Borough | 0.72% | 0.40%(+0.319)#49 | 0.22%(+0.503)#211 |
| 52. | Fort Dix | 0.72% | 0.40%(+0.316)#50 | 0.22%(+0.500)#212 |
| 53. | Englishtown Borough | 0.70% | 0.40%(+0.301)#51 | 0.22%(+0.485)#213 |
| 54. | Lake Como Borough | 0.70% | 0.40%(+0.298)#52 | 0.22%(+0.482)#214 |
| 55. | Sayreville Borough | 0.70% | 0.40%(+0.296)#53 | 0.22%(+0.480)#215 |
| 56. | Prospect Park Borough | 0.70% | 0.40%(+0.295)#54 | 0.22%(+0.479)#216 |
| 57. | Fairview Borough | 0.69% | 0.40%(+0.286)#55 | 0.22%(+0.470)#217 |
| 58. | Spotswood Borough | 0.69% | 0.40%(+0.285)#56 | 0.22%(+0.469)#218 |
| 59. | Clementon Borough | 0.68% | 0.40%(+0.274)#57 | 0.22%(+0.458)#219 |
| 60. | Passaic | 0.68% | 0.40%(+0.272)#58 | 0.22%(+0.456)#220 |
| 61. | Harrison | 0.66% | 0.40%(+0.257)#59 | 0.22%(+0.441)#221 |
| 62. | Kearny | 0.65% | 0.40%(+0.250)#60 | 0.22%(+0.434)#222 |
| 63. | West Freehold | 0.64% | 0.40%(+0.240)#61 | 0.22%(+0.424)#223 |
| 64. | Beverly | 0.64% | 0.40%(+0.236)#62 | 0.22%(+0.420)#224 |
| 65. | Ocean Acres | 0.58% | 0.40%(+0.172)#63 | 0.22%(+0.356)#225 |
| 66. | Newark | 0.52% | 0.40%(+0.120)#64 | 0.22%(+0.304)#238 |
| 67. | Paramus Borough | 0.52% | 0.40%(+0.112)#65 | 0.22%(+0.296)#239 |
| 68. | Totowa Borough | 0.50% | 0.40%(+0.097)#66 | 0.22%(+0.281)#240 |
| 69. | Morris Plains Borough | 0.49% | 0.40%(+0.088)#67 | 0.22%(+0.272)#241 |
| 70. | Bridgeton | 0.48% | 0.40%(+0.076)#68 | 0.22%(+0.260)#242 |
| 71. | Linden | 0.48% | 0.40%(+0.075)#69 | 0.22%(+0.259)#243 |
| 72. | Ventnor City | 0.47% | 0.40%(+0.070)#70 | 0.22%(+0.254)#244 |
| 73. | Millville | 0.47% | 0.40%(+0.069)#71 | 0.22%(+0.253)#245 |
| 74. | Dumont Borough | 0.47% | 0.40%(+0.063)#72 | 0.22%(+0.247)#246 |
| 75. | Summit | 0.47% | 0.40%(+0.062)#73 | 0.22%(+0.246)#247 |
| 76. | Bayonne | 0.46% | 0.40%(+0.056)#74 | 0.22%(+0.240)#248 |
| 77. | Moonachie Borough | 0.45% | 0.40%(+0.049)#75 | 0.22%(+0.233)#249 |
| 78. | Leisure Village East | 0.45% | 0.40%(+0.048)#76 | 0.22%(+0.232)#250 |
| 79. | Hasbrouck Heights Borough | 0.45% | 0.40%(+0.043)#77 | 0.22%(+0.227)#251 |
| 80. | Bergenfield Borough | 0.42% | 0.40%(+0.018)#78 | 0.22%(+0.202)#252 |
| 81. | Chatham Borough | 0.41% | 0.40%(+0.009)#79 | 0.22%(+0.193)#253 |
| 82. | Glendora | 0.41% | 0.40%(+0.009)#80 | 0.22%(+0.193)#254 |
| 83. | Waldwick Borough | 0.41% | 0.40%(+0.004)#81 | 0.22%(+0.188)#255 |
| 84. | Vernon Center | 0.40% | 0.40%(-0.002)#82 | 0.22%(+0.182)#256 |
| 85. | Middlesex Borough | 0.39% | 0.40%(-0.011)#83 | 0.22%(+0.173)#257 |
| 86. | Hawthorne Borough | 0.39% | 0.40%(-0.018)#84 | 0.22%(+0.166)#258 |
| 87. | Paterson | 0.37% | 0.40%(-0.036)#85 | 0.22%(+0.148)#259 |
| 88. | Ridgefield Borough | 0.36% | 0.40%(-0.046)#86 | 0.22%(+0.138)#260 |
| 89. | Gloucester City | 0.34% | 0.40%(-0.063)#87 | 0.22%(+0.121)#261 |
| 90. | Ampere North | 0.33% | 0.40%(-0.074)#88 | 0.22%(+0.110)#262 |
| 91. | Lincoln Park Borough | 0.32% | 0.40%(-0.082)#89 | 0.22%(+0.102)#263 |
| 92. | Camden | 0.31% | 0.40%(-0.092)#90 | 0.22%(+0.092)#264 |
| 93. | Avenel | 0.31% | 0.40%(-0.096)#91 | 0.22%(+0.088)#265 |
| 94. | Caldwell Borough | 0.30% | 0.40%(-0.100)#92 | 0.22%(+0.084)#266 |
| 95. | Flemington Borough | 0.29% | 0.40%(-0.116)#93 | 0.22%(+0.068)#267 |
| 96. | Madison Borough | 0.28% | 0.40%(-0.119)#94 | 0.22%(+0.065)#268 |
| 97. | Roselle Park Borough | 0.27% | 0.40%(-0.132)#95 | 0.22%(+0.052)#269 |
| 98. | Alpha Borough | 0.27% | 0.40%(-0.134)#96 | 0.22%(+0.050)#270 |
| 99. | Woodbridge | 0.27% | 0.40%(-0.136)#97 | 0.22%(+0.048)#271 |
| 100. | White Meadow Lake | 0.26% | 0.40%(-0.143)#98 | 0.22%(+0.041)#272 |
Common Questions
What are the Top 10 Cities with the Highest Percentage of Immigrants from Honduras in New Jersey?
Top 10 Cities with the Highest Percentage of Immigrants from Honduras in New Jersey are:
#1
10.27%
#2
7.26%
#3
5.21%
#4
4.46%
#5
3.87%
#6
3.54%
#7
3.53%
#8
2.86%
#9
2.70%
#10
2.64%
What city has the Highest Percentage of Immigrants from Honduras in New Jersey?
Port Reading has the Highest Percentage of Immigrants from Honduras in New Jersey with 10.27%.
What is the Percentage of Immigrants from Honduras in the State of New Jersey?
Percentage of Immigrants from Honduras in New Jersey is 0.40%.
What is the Percentage of Immigrants from Honduras in the United States?
Percentage of Immigrants from Honduras in the United States is 0.22%.