Cities with the Highest Percentage of Immigrants from Ireland in New Jersey
RELATED REPORTS & OPTIONS
Ireland
New Jersey
Compare Cities
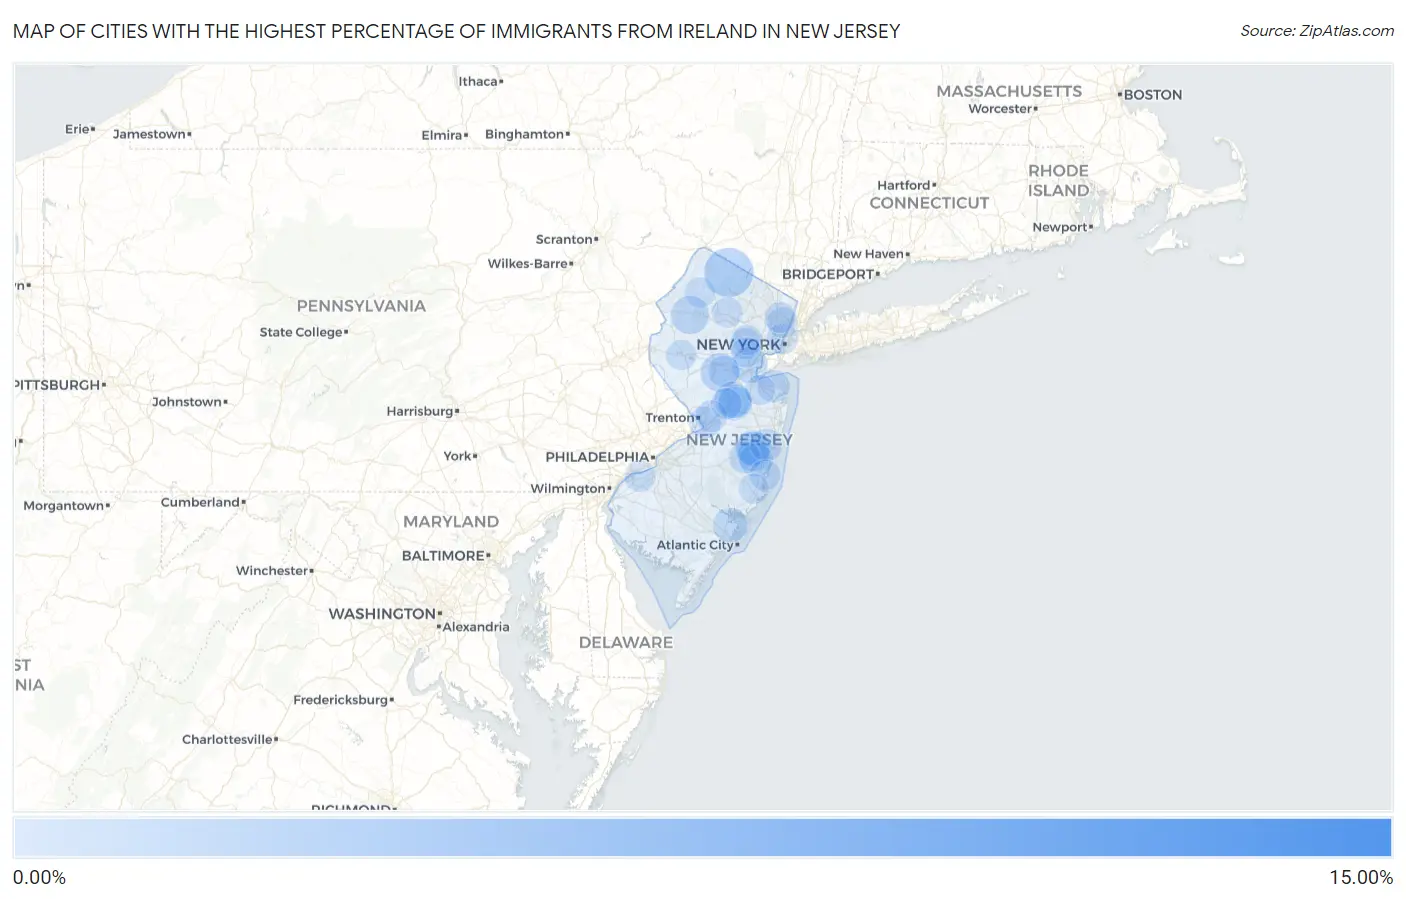
Map of Cities with the Highest Percentage of Immigrants from Ireland in New Jersey
0.00%
15.00%
Cities with the Highest Percentage of Immigrants from Ireland in New Jersey
| City | Ireland | vs State | vs National | |
| 1. | Hewitt | 11.14% | 0.088%(+11.1)#1 | 0.036%(+11.1)#1 |
| 2. | Port Elizabeth | 2.74% | 0.088%(+2.65)#2 | 0.036%(+2.70)#26 |
| 3. | Edgewater Borough | 2.66% | 0.088%(+2.57)#3 | 0.036%(+2.62)#31 |
| 4. | Rockleigh Borough | 2.65% | 0.088%(+2.56)#4 | 0.036%(+2.61)#33 |
| 5. | Pines Lake | 2.60% | 0.088%(+2.52)#5 | 0.036%(+2.57)#34 |
| 6. | Vernon Center | 2.48% | 0.088%(+2.39)#6 | 0.036%(+2.44)#39 |
| 7. | Rainbow Lakes | 2.02% | 0.088%(+1.93)#7 | 0.036%(+1.99)#47 |
| 8. | Oradell Borough | 1.90% | 0.088%(+1.81)#8 | 0.036%(+1.86)#50 |
| 9. | Cresskill Borough | 1.88% | 0.088%(+1.79)#9 | 0.036%(+1.84)#52 |
| 10. | Stanhope Borough | 1.22% | 0.088%(+1.13)#10 | 0.036%(+1.18)#106 |
| 11. | Weston | 1.21% | 0.088%(+1.12)#11 | 0.036%(+1.18)#107 |
| 12. | Panther Valley | 1.14% | 0.088%(+1.05)#12 | 0.036%(+1.10)#120 |
| 13. | Point Pleasant Beach Borough | 1.07% | 0.088%(+0.978)#13 | 0.036%(+1.03)#127 |
| 14. | Waldwick Borough | 0.95% | 0.088%(+0.865)#14 | 0.036%(+0.917)#145 |
| 15. | Rutherford Borough | 0.91% | 0.088%(+0.824)#15 | 0.036%(+0.876)#150 |
| 16. | Rossmoor | 0.90% | 0.088%(+0.814)#16 | 0.036%(+0.866)#152 |
| 17. | Sea Girt Borough | 0.89% | 0.088%(+0.798)#17 | 0.036%(+0.850)#153 |
| 18. | Iselin | 0.87% | 0.088%(+0.782)#18 | 0.036%(+0.834)#157 |
| 19. | Haddon Heights Borough | 0.87% | 0.088%(+0.780)#19 | 0.036%(+0.832)#159 |
| 20. | Neshanic Station | 0.85% | 0.088%(+0.758)#20 | 0.036%(+0.810)#167 |
| 21. | Stirling | 0.80% | 0.088%(+0.709)#21 | 0.036%(+0.760)#182 |
| 22. | Norwood Borough | 0.76% | 0.088%(+0.672)#22 | 0.036%(+0.724)#189 |
| 23. | Basking Ridge | 0.75% | 0.088%(+0.658)#23 | 0.036%(+0.710)#194 |
| 24. | Lyons | 0.72% | 0.088%(+0.628)#24 | 0.036%(+0.680)#205 |
| 25. | Little Silver Borough | 0.70% | 0.088%(+0.616)#25 | 0.036%(+0.668)#208 |
| 26. | Layton | 0.70% | 0.088%(+0.613)#26 | 0.036%(+0.665)#210 |
| 27. | Smithville | 0.70% | 0.088%(+0.613)#27 | 0.036%(+0.664)#211 |
| 28. | Union Beach Borough | 0.70% | 0.088%(+0.607)#28 | 0.036%(+0.659)#214 |
| 29. | Leisure Knoll | 0.69% | 0.088%(+0.598)#29 | 0.036%(+0.650)#217 |
| 30. | Monmouth Beach Borough | 0.66% | 0.088%(+0.568)#30 | 0.036%(+0.620)#226 |
| 31. | Leisure Village West | 0.65% | 0.088%(+0.567)#31 | 0.036%(+0.619)#228 |
| 32. | Ledgewood | 0.65% | 0.088%(+0.558)#32 | 0.036%(+0.610)#234 |
| 33. | Glen Rock Borough | 0.63% | 0.088%(+0.541)#33 | 0.036%(+0.593)#243 |
| 34. | Wanaque Borough | 0.62% | 0.088%(+0.536)#34 | 0.036%(+0.588)#247 |
| 35. | Allentown Borough | 0.61% | 0.088%(+0.517)#35 | 0.036%(+0.569)#256 |
| 36. | Concordia | 0.59% | 0.088%(+0.502)#36 | 0.036%(+0.554)#265 |
| 37. | New Milford Borough | 0.59% | 0.088%(+0.498)#37 | 0.036%(+0.550)#269 |
| 38. | Holiday Heights | 0.59% | 0.088%(+0.498)#38 | 0.036%(+0.549)#270 |
| 39. | Whittingham | 0.58% | 0.088%(+0.490)#39 | 0.036%(+0.542)#276 |
| 40. | Bogota Borough | 0.57% | 0.088%(+0.482)#40 | 0.036%(+0.534)#280 |
| 41. | Demarest Borough | 0.57% | 0.088%(+0.480)#41 | 0.036%(+0.532)#281 |
| 42. | Mendham Borough | 0.56% | 0.088%(+0.476)#42 | 0.036%(+0.527)#283 |
| 43. | Milford Borough | 0.56% | 0.088%(+0.475)#43 | 0.036%(+0.527)#284 |
| 44. | Morris Plains Borough | 0.54% | 0.088%(+0.453)#44 | 0.036%(+0.504)#298 |
| 45. | Dumont Borough | 0.47% | 0.088%(+0.384)#45 | 0.036%(+0.436)#336 |
| 46. | Haworth Borough | 0.45% | 0.088%(+0.361)#46 | 0.036%(+0.413)#355 |
| 47. | Port Monmouth | 0.44% | 0.088%(+0.353)#47 | 0.036%(+0.405)#361 |
| 48. | Holiday City Berkeley | 0.44% | 0.088%(+0.347)#48 | 0.036%(+0.399)#368 |
| 49. | Park Ridge Borough | 0.42% | 0.088%(+0.330)#49 | 0.036%(+0.381)#377 |
| 50. | Leisure Village East | 0.41% | 0.088%(+0.320)#50 | 0.036%(+0.372)#385 |
| 51. | Crestwood Village | 0.39% | 0.088%(+0.301)#51 | 0.036%(+0.353)#409 |
| 52. | Upper Greenwood Lake | 0.38% | 0.088%(+0.292)#52 | 0.036%(+0.344)#419 |
| 53. | Florham Park Borough | 0.37% | 0.088%(+0.279)#53 | 0.036%(+0.331)#438 |
| 54. | White Horse | 0.35% | 0.088%(+0.263)#54 | 0.036%(+0.315)#456 |
| 55. | Highland Park Borough | 0.35% | 0.088%(+0.259)#55 | 0.036%(+0.311)#459 |
| 56. | Hamilton Square | 0.34% | 0.088%(+0.257)#56 | 0.036%(+0.309)#461 |
| 57. | Watchung Borough | 0.34% | 0.088%(+0.255)#57 | 0.036%(+0.307)#465 |
| 58. | Avalon Borough | 0.34% | 0.088%(+0.255)#58 | 0.036%(+0.307)#466 |
| 59. | Millstone Borough | 0.34% | 0.088%(+0.254)#59 | 0.036%(+0.306)#467 |
| 60. | Wood Ridge Borough | 0.34% | 0.088%(+0.253)#60 | 0.036%(+0.305)#468 |
| 61. | Hi Nella Borough | 0.34% | 0.088%(+0.252)#61 | 0.036%(+0.304)#471 |
| 62. | Closter Borough | 0.34% | 0.088%(+0.251)#62 | 0.036%(+0.303)#474 |
| 63. | Matawan Borough | 0.34% | 0.088%(+0.247)#63 | 0.036%(+0.299)#479 |
| 64. | Seaside Park Borough | 0.33% | 0.088%(+0.245)#64 | 0.036%(+0.297)#482 |
| 65. | Franklin Center | 0.32% | 0.088%(+0.234)#65 | 0.036%(+0.286)#499 |
| 66. | Westmont | 0.31% | 0.088%(+0.223)#66 | 0.036%(+0.275)#517 |
| 67. | Bergenfield Borough | 0.31% | 0.088%(+0.220)#67 | 0.036%(+0.272)#520 |
| 68. | Ship Bottom Borough | 0.30% | 0.088%(+0.213)#68 | 0.036%(+0.265)#530 |
| 69. | Watsessing | 0.30% | 0.088%(+0.210)#69 | 0.036%(+0.262)#536 |
| 70. | Summit | 0.29% | 0.088%(+0.205)#70 | 0.036%(+0.256)#546 |
| 71. | Eatontown Borough | 0.29% | 0.088%(+0.200)#71 | 0.036%(+0.252)#553 |
| 72. | Gibbstown | 0.29% | 0.088%(+0.200)#72 | 0.036%(+0.252)#555 |
| 73. | Cranbury | 0.29% | 0.088%(+0.200)#73 | 0.036%(+0.252)#556 |
| 74. | Hasbrouck Heights Borough | 0.28% | 0.088%(+0.193)#74 | 0.036%(+0.245)#569 |
| 75. | Wenonah Borough | 0.27% | 0.088%(+0.183)#75 | 0.036%(+0.235)#590 |
| 76. | River Edge Borough | 0.27% | 0.088%(+0.178)#76 | 0.036%(+0.230)#604 |
| 77. | Hoboken | 0.26% | 0.088%(+0.176)#77 | 0.036%(+0.228)#610 |
| 78. | Forked River | 0.26% | 0.088%(+0.172)#78 | 0.036%(+0.224)#620 |
| 79. | Bloomingdale Borough | 0.26% | 0.088%(+0.171)#79 | 0.036%(+0.223)#623 |
| 80. | Ridgefield Park | 0.26% | 0.088%(+0.170)#80 | 0.036%(+0.222)#625 |
| 81. | Hackensack | 0.24% | 0.088%(+0.157)#81 | 0.036%(+0.209)#653 |
| 82. | Oakland Borough | 0.24% | 0.088%(+0.155)#82 | 0.036%(+0.207)#658 |
| 83. | Newton | 0.24% | 0.088%(+0.151)#83 | 0.036%(+0.203)#670 |
| 84. | Bloomsbury Borough | 0.23% | 0.088%(+0.144)#84 | 0.036%(+0.196)#684 |
| 85. | White Meadow Lake | 0.23% | 0.088%(+0.140)#85 | 0.036%(+0.191)#693 |
| 86. | Leonia Borough | 0.23% | 0.088%(+0.138)#86 | 0.036%(+0.190)#699 |
| 87. | Spring Lake Heights Borough | 0.23% | 0.088%(+0.138)#87 | 0.036%(+0.190)#700 |
| 88. | Keyport Borough | 0.22% | 0.088%(+0.135)#88 | 0.036%(+0.186)#705 |
| 89. | Short Hills | 0.22% | 0.088%(+0.133)#89 | 0.036%(+0.185)#706 |
| 90. | The College Of New Jersey | 0.21% | 0.088%(+0.121)#90 | 0.036%(+0.173)#734 |
| 91. | Westfield | 0.20% | 0.088%(+0.110)#91 | 0.036%(+0.162)#765 |
| 92. | Bridgewater Center | 0.20% | 0.088%(+0.108)#92 | 0.036%(+0.160)#770 |
| 93. | Madison Borough | 0.19% | 0.088%(+0.106)#93 | 0.036%(+0.157)#779 |
| 94. | Bernardsville Borough | 0.19% | 0.088%(+0.102)#94 | 0.036%(+0.154)#787 |
| 95. | Strathmore | 0.19% | 0.088%(+0.100)#95 | 0.036%(+0.152)#795 |
| 96. | Ocean Acres | 0.19% | 0.088%(+0.098)#96 | 0.036%(+0.150)#801 |
| 97. | Keansburg Borough | 0.18% | 0.088%(+0.096)#97 | 0.036%(+0.148)#815 |
| 98. | Bay Head Borough | 0.18% | 0.088%(+0.094)#98 | 0.036%(+0.146)#824 |
| 99. | Clinton | 0.18% | 0.088%(+0.092)#99 | 0.036%(+0.144)#834 |
| 100. | Roselle Park Borough | 0.17% | 0.088%(+0.084)#100 | 0.036%(+0.136)#857 |
Common Questions
What are the Top 10 Cities with the Highest Percentage of Immigrants from Ireland in New Jersey?
Top 10 Cities with the Highest Percentage of Immigrants from Ireland in New Jersey are:
#1
2.48%
#2
1.21%
#3
1.14%
#4
0.90%
#5
0.87%
#6
0.70%
#7
0.69%
#8
0.65%
#9
0.59%
#10
0.59%
What city has the Highest Percentage of Immigrants from Ireland in New Jersey?
Vernon Center has the Highest Percentage of Immigrants from Ireland in New Jersey with 2.48%.
What is the Percentage of Immigrants from Ireland in the State of New Jersey?
Percentage of Immigrants from Ireland in New Jersey is 0.088%.
What is the Percentage of Immigrants from Ireland in the United States?
Percentage of Immigrants from Ireland in the United States is 0.036%.