Cities with the Highest Percentage of Population with a Degree in Literature and Languages in New Jersey
RELATED REPORTS & OPTIONS
Literature and Languages
New Jersey
Compare Cities
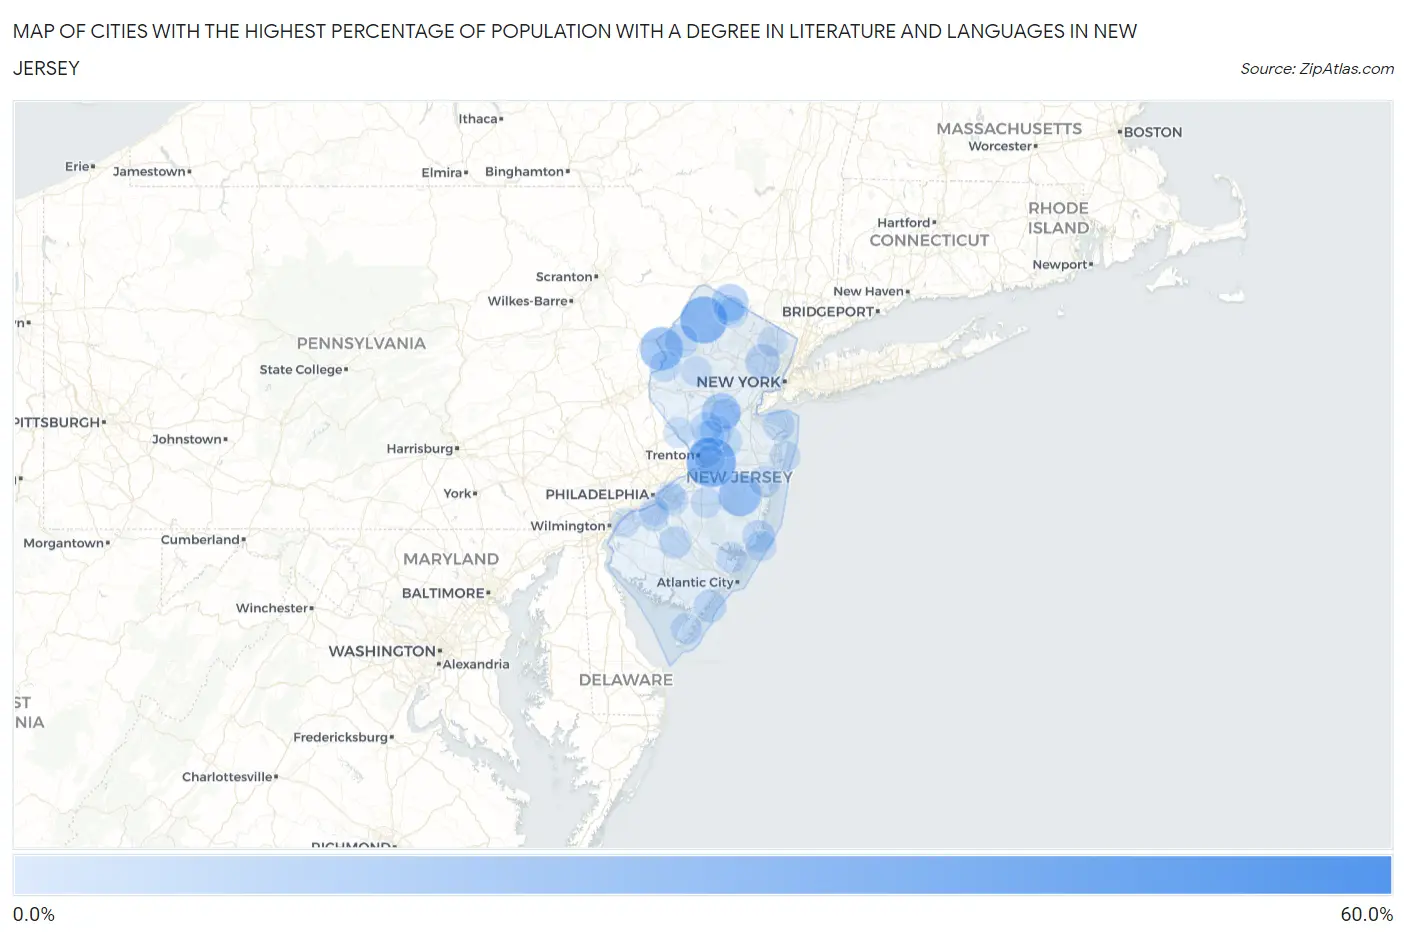
Map of Cities with the Highest Percentage of Population with a Degree in Literature and Languages in New Jersey
0.0%
60.0%
Cities with the Highest Percentage of Population with a Degree in Literature and Languages in New Jersey
| City | % Graduates | vs State | vs National | |
| 1. | Gandys Beach | 57.1% | 4.6%(+52.6)#1 | 4.4%(+52.7)#64 |
| 2. | Delmont | 46.7% | 4.6%(+42.1)#2 | 4.4%(+42.3)#112 |
| 3. | Laurel Heights | 39.0% | 4.6%(+34.4)#3 | 4.4%(+34.6)#166 |
| 4. | Groveville | 35.1% | 4.6%(+30.5)#4 | 4.4%(+30.7)#211 |
| 5. | Ross Corner | 31.6% | 4.6%(+27.0)#5 | 4.4%(+27.2)#278 |
| 6. | Milmay | 26.4% | 4.6%(+21.9)#6 | 4.4%(+22.0)#390 |
| 7. | Columbia | 26.1% | 4.6%(+21.5)#7 | 4.4%(+21.7)#401 |
| 8. | Cedar Glen Lakes | 25.3% | 4.6%(+20.8)#8 | 4.4%(+20.9)#415 |
| 9. | Seeley | 23.8% | 4.6%(+19.2)#9 | 4.4%(+19.4)#479 |
| 10. | Washington Crossing | 21.1% | 4.6%(+16.5)#10 | 4.4%(+16.7)#583 |
| 11. | East Millstone | 20.4% | 4.6%(+15.8)#11 | 4.4%(+16.0)#620 |
| 12. | Springfield | 19.7% | 4.6%(+15.1)#12 | 4.4%(+15.2)#671 |
| 13. | Sweetwater | 18.8% | 4.6%(+14.2)#13 | 4.4%(+14.4)#722 |
| 14. | Vernon Valley | 17.2% | 4.6%(+12.6)#14 | 4.4%(+12.8)#849 |
| 15. | Lower Berkshire Valley | 16.2% | 4.6%(+11.6)#15 | 4.4%(+11.8)#938 |
| 16. | Glen Gardner Borough | 16.1% | 4.6%(+11.5)#16 | 4.4%(+11.7)#946 |
| 17. | Mckee | 15.3% | 4.6%(+10.7)#17 | 4.4%(+10.9)#1,029 |
| 18. | Port Morris | 15.1% | 4.6%(+10.5)#18 | 4.4%(+10.7)#1,051 |
| 19. | Hampton Borough | 14.6% | 4.6%(+10.1)#19 | 4.4%(+10.2)#1,099 |
| 20. | Upper Montclair | 14.2% | 4.6%(+9.61)#20 | 4.4%(+9.76)#1,185 |
| 21. | Milford Borough | 13.9% | 4.6%(+9.33)#21 | 4.4%(+9.49)#1,237 |
| 22. | Brooklawn Borough | 13.7% | 4.6%(+9.09)#22 | 4.4%(+9.25)#1,283 |
| 23. | Keyport Borough | 13.5% | 4.6%(+8.96)#23 | 4.4%(+9.12)#1,308 |
| 24. | Elmer Borough | 13.4% | 4.6%(+8.79)#24 | 4.4%(+8.95)#1,333 |
| 25. | Hopewell Borough | 12.9% | 4.6%(+8.35)#25 | 4.4%(+8.51)#1,403 |
| 26. | Spring Lake Heights Borough | 12.9% | 4.6%(+8.30)#26 | 4.4%(+8.45)#1,414 |
| 27. | Highlands Borough | 12.5% | 4.6%(+7.94)#27 | 4.4%(+8.10)#1,471 |
| 28. | Marksboro | 12.5% | 4.6%(+7.94)#28 | 4.4%(+8.09)#1,492 |
| 29. | Stirling | 12.0% | 4.6%(+7.46)#29 | 4.4%(+7.62)#1,564 |
| 30. | Glen Ridge Borough | 11.8% | 4.6%(+7.29)#30 | 4.4%(+7.44)#1,594 |
| 31. | Chester Borough | 11.7% | 4.6%(+7.14)#31 | 4.4%(+7.30)#1,631 |
| 32. | Victory Lakes | 11.6% | 4.6%(+7.00)#32 | 4.4%(+7.15)#1,657 |
| 33. | Strathmere | 11.4% | 4.6%(+6.86)#33 | 4.4%(+7.02)#1,685 |
| 34. | Beach Haven West | 11.4% | 4.6%(+6.85)#34 | 4.4%(+7.01)#1,688 |
| 35. | Lebanon Borough | 11.3% | 4.6%(+6.70)#35 | 4.4%(+6.85)#1,724 |
| 36. | Woodcliff Lake Borough | 11.2% | 4.6%(+6.64)#36 | 4.4%(+6.79)#1,743 |
| 37. | Pennington Borough | 11.0% | 4.6%(+6.41)#37 | 4.4%(+6.56)#1,827 |
| 38. | North Caldwell Borough | 11.0% | 4.6%(+6.40)#38 | 4.4%(+6.55)#1,831 |
| 39. | Demarest Borough | 10.9% | 4.6%(+6.38)#39 | 4.4%(+6.53)#1,840 |
| 40. | Cranbury | 10.5% | 4.6%(+5.94)#40 | 4.4%(+6.10)#1,978 |
| 41. | Norwood Borough | 10.4% | 4.6%(+5.86)#41 | 4.4%(+6.02)#2,001 |
| 42. | Leonardo | 10.4% | 4.6%(+5.79)#42 | 4.4%(+5.94)#2,020 |
| 43. | Kingston | 10.3% | 4.6%(+5.76)#43 | 4.4%(+5.91)#2,035 |
| 44. | Newfoundland | 10.3% | 4.6%(+5.71)#44 | 4.4%(+5.86)#2,048 |
| 45. | Leisure Village | 10.2% | 4.6%(+5.65)#45 | 4.4%(+5.80)#2,072 |
| 46. | Brookfield | 10.1% | 4.6%(+5.57)#46 | 4.4%(+5.73)#2,099 |
| 47. | Stockton Borough | 10.1% | 4.6%(+5.57)#47 | 4.4%(+5.73)#2,100 |
| 48. | Highland Park Borough | 10.1% | 4.6%(+5.56)#48 | 4.4%(+5.72)#2,103 |
| 49. | Peapack And Gladstone Borough | 10.1% | 4.6%(+5.54)#49 | 4.4%(+5.69)#2,111 |
| 50. | Blawenburg | 10.1% | 4.6%(+5.54)#50 | 4.4%(+5.69)#2,113 |
| 51. | Roadstown | 10.0% | 4.6%(+5.44)#51 | 4.4%(+5.59)#2,164 |
| 52. | Malaga | 9.7% | 4.6%(+5.14)#52 | 4.4%(+5.29)#2,254 |
| 53. | Whitesboro | 9.7% | 4.6%(+5.10)#53 | 4.4%(+5.25)#2,272 |
| 54. | Princeton | 9.6% | 4.6%(+5.06)#54 | 4.4%(+5.21)#2,289 |
| 55. | Port Republic | 9.6% | 4.6%(+5.04)#55 | 4.4%(+5.19)#2,300 |
| 56. | Garwood Borough | 9.6% | 4.6%(+5.04)#56 | 4.4%(+5.19)#2,301 |
| 57. | Kingston Estates | 9.6% | 4.6%(+5.03)#57 | 4.4%(+5.18)#2,304 |
| 58. | Collingswood Borough | 9.5% | 4.6%(+4.97)#58 | 4.4%(+5.13)#2,321 |
| 59. | Ocean Grove | 9.2% | 4.6%(+4.64)#59 | 4.4%(+4.79)#2,476 |
| 60. | Farmingdale Borough | 9.2% | 4.6%(+4.63)#60 | 4.4%(+4.79)#2,481 |
| 61. | Leonia Borough | 9.1% | 4.6%(+4.57)#61 | 4.4%(+4.73)#2,501 |
| 62. | Westmont | 9.1% | 4.6%(+4.53)#62 | 4.4%(+4.69)#2,512 |
| 63. | Mercerville | 9.1% | 4.6%(+4.50)#63 | 4.4%(+4.65)#2,555 |
| 64. | Stone Harbor Borough | 9.1% | 4.6%(+4.49)#64 | 4.4%(+4.65)#2,557 |
| 65. | Old Tappan Borough | 9.0% | 4.6%(+4.40)#65 | 4.4%(+4.55)#2,608 |
| 66. | Leisuretowne | 8.9% | 4.6%(+4.34)#66 | 4.4%(+4.50)#2,644 |
| 67. | Avon By The Sea Borough | 8.9% | 4.6%(+4.34)#67 | 4.4%(+4.49)#2,646 |
| 68. | Lambertville | 8.9% | 4.6%(+4.30)#68 | 4.4%(+4.46)#2,671 |
| 69. | Silver Lake Cdp Warren County | 8.9% | 4.6%(+4.30)#69 | 4.4%(+4.45)#2,674 |
| 70. | Carlstadt Borough | 8.8% | 4.6%(+4.26)#70 | 4.4%(+4.41)#2,688 |
| 71. | Middlebush | 8.7% | 4.6%(+4.15)#71 | 4.4%(+4.30)#2,737 |
| 72. | Oaklyn Borough | 8.7% | 4.6%(+4.11)#72 | 4.4%(+4.27)#2,768 |
| 73. | Long Valley | 8.7% | 4.6%(+4.11)#73 | 4.4%(+4.27)#2,772 |
| 74. | North Beach Haven | 8.6% | 4.6%(+4.00)#74 | 4.4%(+4.15)#2,832 |
| 75. | Little Silver Borough | 8.5% | 4.6%(+3.96)#75 | 4.4%(+4.11)#2,859 |
| 76. | Oak Valley | 8.4% | 4.6%(+3.86)#76 | 4.4%(+4.01)#2,903 |
| 77. | Hightstown Borough | 8.4% | 4.6%(+3.84)#77 | 4.4%(+3.99)#2,916 |
| 78. | Three Bridges | 8.4% | 4.6%(+3.83)#78 | 4.4%(+3.99)#2,918 |
| 79. | Ridgewood | 8.4% | 4.6%(+3.81)#79 | 4.4%(+3.96)#2,939 |
| 80. | Pedricktown | 8.3% | 4.6%(+3.77)#80 | 4.4%(+3.92)#2,970 |
| 81. | Green | 8.3% | 4.6%(+3.75)#81 | 4.4%(+3.90)#2,994 |
| 82. | Highland Lakes | 8.3% | 4.6%(+3.70)#82 | 4.4%(+3.85)#3,012 |
| 83. | Grenloch | 8.2% | 4.6%(+3.66)#83 | 4.4%(+3.82)#3,032 |
| 84. | Harrington Park Borough | 8.2% | 4.6%(+3.60)#84 | 4.4%(+3.76)#3,063 |
| 85. | Ocean View | 8.0% | 4.6%(+3.46)#85 | 4.4%(+3.62)#3,160 |
| 86. | Bedminster | 8.0% | 4.6%(+3.42)#86 | 4.4%(+3.57)#3,189 |
| 87. | Vernon Center | 8.0% | 4.6%(+3.39)#87 | 4.4%(+3.55)#3,193 |
| 88. | Chesilhurst Borough | 8.0% | 4.6%(+3.39)#88 | 4.4%(+3.54)#3,196 |
| 89. | Cherry Hill Mall | 7.9% | 4.6%(+3.34)#89 | 4.4%(+3.49)#3,230 |
| 90. | Rockaway Borough | 7.8% | 4.6%(+3.27)#90 | 4.4%(+3.43)#3,268 |
| 91. | Woodbury | 7.8% | 4.6%(+3.26)#91 | 4.4%(+3.41)#3,283 |
| 92. | Goshen | 7.7% | 4.6%(+3.13)#92 | 4.4%(+3.28)#3,373 |
| 93. | Ledgewood | 7.7% | 4.6%(+3.11)#93 | 4.4%(+3.27)#3,387 |
| 94. | Yardville | 7.7% | 4.6%(+3.10)#94 | 4.4%(+3.25)#3,395 |
| 95. | Gillette | 7.7% | 4.6%(+3.10)#95 | 4.4%(+3.25)#3,399 |
| 96. | Riverton Borough | 7.6% | 4.6%(+3.07)#96 | 4.4%(+3.22)#3,419 |
| 97. | Ringwood Borough | 7.6% | 4.6%(+3.06)#97 | 4.4%(+3.22)#3,423 |
| 98. | Moonachie Borough | 7.6% | 4.6%(+3.05)#98 | 4.4%(+3.20)#3,427 |
| 99. | Runnemede Borough | 7.6% | 4.6%(+3.03)#99 | 4.4%(+3.18)#3,448 |
| 100. | Tuckerton Borough | 7.6% | 4.6%(+3.01)#100 | 4.4%(+3.17)#3,457 |
Common Questions
What are the Top 10 Cities with the Highest Percentage of Population with a Degree in Literature and Languages in New Jersey?
Top 10 Cities with the Highest Percentage of Population with a Degree in Literature and Languages in New Jersey are:
#1
35.1%
#2
31.6%
#3
26.1%
#4
25.3%
#5
20.4%
#6
17.2%
#7
14.2%
#8
12.5%
#9
11.6%
#10
11.4%
What city has the Highest Percentage of Population with a Degree in Literature and Languages in New Jersey?
Groveville has the Highest Percentage of Population with a Degree in Literature and Languages in New Jersey with 35.1%.
What is the Percentage of Population with a Degree in Literature and Languages in the State of New Jersey?
Percentage of Population with a Degree in Literature and Languages in New Jersey is 4.6%.
What is the Percentage of Population with a Degree in Literature and Languages in the United States?
Percentage of Population with a Degree in Literature and Languages in the United States is 4.4%.