Cities with the Highest Percentage of Households Without a Vehicle in New Jersey
RELATED REPORTS & OPTIONS
Households without a Cars
New Jersey
Compare Cities
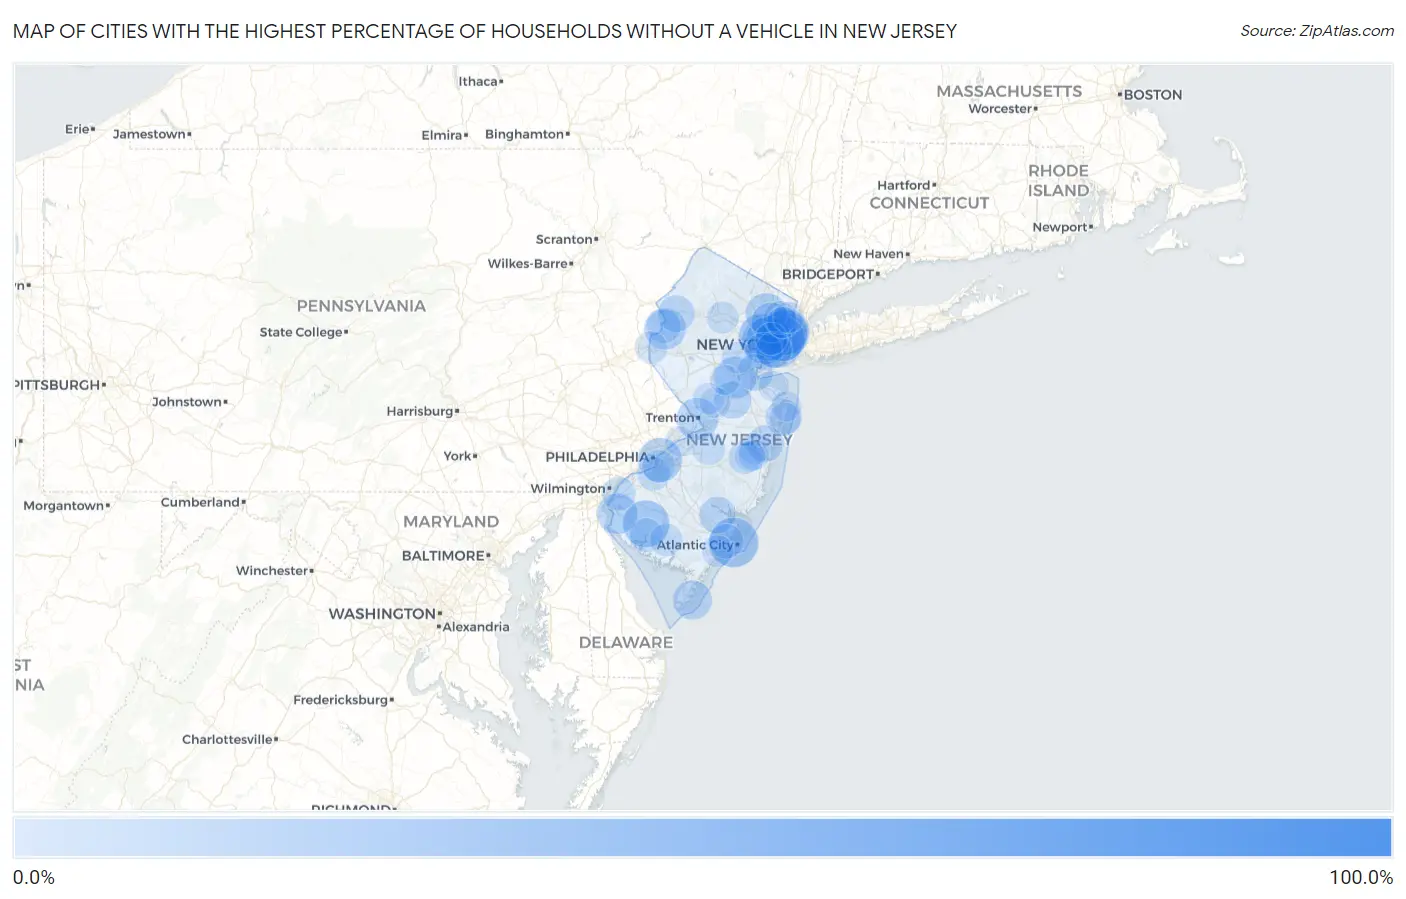
Map of Cities with the Highest Percentage of Households Without a Vehicle in New Jersey
0.0%
100.0%
Cities with the Highest Percentage of Households Without a Vehicle in New Jersey
| City | Housholds Without a Car | vs State | vs National | |
| 1. | Stockton University | 100.0% | 11.3%(+88.7)#1 | 8.3%(+91.7)#1 |
| 2. | Atlantic City | 40.9% | 11.3%(+29.6)#2 | 8.3%(+32.6)#335 |
| 3. | Union City | 40.5% | 11.3%(+29.2)#3 | 8.3%(+32.2)#337 |
| 4. | West New York | 40.0% | 11.3%(+28.7)#4 | 8.3%(+31.7)#343 |
| 5. | Jersey City | 38.5% | 11.3%(+27.2)#5 | 8.3%(+30.2)#360 |
| 6. | Seabrook Farms | 36.7% | 11.3%(+25.4)#6 | 8.3%(+28.4)#393 |
| 7. | Newark | 35.6% | 11.3%(+24.3)#7 | 8.3%(+27.3)#414 |
| 8. | Guttenberg | 34.9% | 11.3%(+23.6)#8 | 8.3%(+26.6)#434 |
| 9. | Hoboken | 34.3% | 11.3%(+23.0)#9 | 8.3%(+26.0)#452 |
| 10. | East Orange | 33.7% | 11.3%(+22.4)#10 | 8.3%(+25.4)#468 |
| 11. | Harrison | 33.7% | 11.3%(+22.4)#11 | 8.3%(+25.4)#469 |
| 12. | Camden | 32.7% | 11.3%(+21.4)#12 | 8.3%(+24.4)#499 |
| 13. | New Brunswick | 29.5% | 11.3%(+18.2)#13 | 8.3%(+21.2)#613 |
| 14. | Trenton | 29.4% | 11.3%(+18.1)#14 | 8.3%(+21.1)#616 |
| 15. | East Newark Borough | 29.1% | 11.3%(+17.8)#15 | 8.3%(+20.8)#631 |
| 16. | Brookfield | 28.8% | 11.3%(+17.5)#16 | 8.3%(+20.5)#643 |
| 17. | Paterson | 28.3% | 11.3%(+17.0)#17 | 8.3%(+20.0)#662 |
| 18. | Salem | 27.5% | 11.3%(+16.2)#18 | 8.3%(+19.2)#700 |
| 19. | Freehold Borough | 26.8% | 11.3%(+15.5)#19 | 8.3%(+18.5)#738 |
| 20. | Passaic | 26.2% | 11.3%(+14.9)#20 | 8.3%(+17.9)#772 |
| 21. | Teterboro Borough | 25.9% | 11.3%(+14.6)#21 | 8.3%(+17.6)#795 |
| 22. | Wildwood | 25.1% | 11.3%(+13.8)#22 | 8.3%(+16.8)#835 |
| 23. | Penns Grove Borough | 24.6% | 11.3%(+13.3)#23 | 8.3%(+16.3)#880 |
| 24. | Fairview Borough | 24.4% | 11.3%(+13.1)#24 | 8.3%(+16.1)#892 |
| 25. | Keasbey | 23.9% | 11.3%(+12.6)#25 | 8.3%(+15.6)#929 |
| 26. | Rossmoor | 22.3% | 11.3%(+11.0)#26 | 8.3%(+14.0)#1,084 |
| 27. | Elizabeth | 22.2% | 11.3%(+10.9)#27 | 8.3%(+13.9)#1,091 |
| 28. | Victory Gardens Borough | 21.5% | 11.3%(+10.2)#28 | 8.3%(+13.2)#1,179 |
| 29. | Perth Amboy | 21.4% | 11.3%(+10.1)#29 | 8.3%(+13.1)#1,187 |
| 30. | Egg Harbor City | 21.4% | 11.3%(+10.1)#30 | 8.3%(+13.1)#1,191 |
| 31. | Hope | 21.4% | 11.3%(+10.1)#31 | 8.3%(+13.1)#1,204 |
| 32. | Asbury Park | 20.9% | 11.3%(+9.60)#32 | 8.3%(+12.6)#1,266 |
| 33. | Leisure Village | 20.8% | 11.3%(+9.50)#33 | 8.3%(+12.5)#1,282 |
| 34. | Bayonne | 20.6% | 11.3%(+9.30)#34 | 8.3%(+12.3)#1,315 |
| 35. | Seaside Heights Borough | 19.0% | 11.3%(+7.70)#35 | 8.3%(+10.7)#1,580 |
| 36. | Watsessing | 18.6% | 11.3%(+7.30)#36 | 8.3%(+10.3)#1,648 |
| 37. | Pleasantville | 18.2% | 11.3%(+6.90)#37 | 8.3%(+9.90)#1,720 |
| 38. | Belvidere | 17.7% | 11.3%(+6.40)#38 | 8.3%(+9.40)#1,848 |
| 39. | Bridgeton | 16.7% | 11.3%(+5.40)#39 | 8.3%(+8.40)#2,091 |
| 40. | Sunset Lake | 16.7% | 11.3%(+5.40)#40 | 8.3%(+8.40)#2,101 |
| 41. | Carneys Point | 16.6% | 11.3%(+5.30)#41 | 8.3%(+8.30)#2,135 |
| 42. | Woodbury | 16.5% | 11.3%(+5.20)#42 | 8.3%(+8.20)#2,157 |
| 43. | Red Bank Borough | 16.0% | 11.3%(+4.70)#43 | 8.3%(+7.70)#2,301 |
| 44. | Woodlynne Borough | 15.9% | 11.3%(+4.60)#44 | 8.3%(+7.60)#2,343 |
| 45. | Crestwood Village | 15.6% | 11.3%(+4.30)#45 | 8.3%(+7.30)#2,457 |
| 46. | Hackensack | 15.4% | 11.3%(+4.10)#46 | 8.3%(+7.10)#2,526 |
| 47. | Juliustown | 15.4% | 11.3%(+4.10)#47 | 8.3%(+7.10)#2,556 |
| 48. | Gloucester City | 15.3% | 11.3%(+4.00)#48 | 8.3%(+7.00)#2,572 |
| 49. | Millville | 15.2% | 11.3%(+3.90)#49 | 8.3%(+6.90)#2,605 |
| 50. | Phillipsburg | 15.0% | 11.3%(+3.70)#50 | 8.3%(+6.70)#2,673 |
| 51. | Keyport Borough | 15.0% | 11.3%(+3.70)#51 | 8.3%(+6.70)#2,679 |
| 52. | Lawnside Borough | 14.8% | 11.3%(+3.50)#52 | 8.3%(+6.50)#2,756 |
| 53. | Green | 14.8% | 11.3%(+3.50)#53 | 8.3%(+6.50)#2,763 |
| 54. | Lindenwold Borough | 14.5% | 11.3%(+3.20)#54 | 8.3%(+6.20)#2,864 |
| 55. | Bogota Borough | 14.5% | 11.3%(+3.20)#55 | 8.3%(+6.20)#2,870 |
| 56. | Kearny | 14.4% | 11.3%(+3.10)#56 | 8.3%(+6.10)#2,912 |
| 57. | Palisades Park Borough | 14.4% | 11.3%(+3.10)#57 | 8.3%(+6.10)#2,915 |
| 58. | Keansburg Borough | 14.3% | 11.3%(+3.00)#58 | 8.3%(+6.00)#2,964 |
| 59. | Wrightstown Borough | 14.1% | 11.3%(+2.80)#59 | 8.3%(+5.80)#3,081 |
| 60. | Plainfield | 14.0% | 11.3%(+2.70)#60 | 8.3%(+5.70)#3,087 |
| 61. | Pompton Plains | 14.0% | 11.3%(+2.70)#61 | 8.3%(+5.70)#3,095 |
| 62. | Dover | 13.8% | 11.3%(+2.50)#62 | 8.3%(+5.50)#3,174 |
| 63. | Ocean Grove | 13.8% | 11.3%(+2.50)#63 | 8.3%(+5.50)#3,189 |
| 64. | Highland Park Borough | 13.7% | 11.3%(+2.40)#64 | 8.3%(+5.40)#3,226 |
| 65. | South Bound Brook Borough | 13.7% | 11.3%(+2.40)#65 | 8.3%(+5.40)#3,234 |
| 66. | Parsippany | 13.6% | 11.3%(+2.30)#66 | 8.3%(+5.30)#3,271 |
| 67. | Somers Point | 13.6% | 11.3%(+2.30)#67 | 8.3%(+5.30)#3,275 |
| 68. | Tinton Falls Borough | 13.5% | 11.3%(+2.20)#68 | 8.3%(+5.20)#3,311 |
| 69. | Audubon Park Borough | 13.4% | 11.3%(+2.10)#69 | 8.3%(+5.10)#3,385 |
| 70. | Sweetwater | 13.4% | 11.3%(+2.10)#70 | 8.3%(+5.10)#3,388 |
| 71. | Cliffside Park Borough | 13.3% | 11.3%(+2.00)#71 | 8.3%(+5.00)#3,397 |
| 72. | Ridgefield Park | 13.3% | 11.3%(+2.00)#72 | 8.3%(+5.00)#3,399 |
| 73. | Princeton | 13.2% | 11.3%(+1.90)#73 | 8.3%(+4.90)#3,442 |
| 74. | Leisure Village West | 13.1% | 11.3%(+1.80)#74 | 8.3%(+4.80)#3,505 |
| 75. | Netcong Borough | 13.0% | 11.3%(+1.70)#75 | 8.3%(+4.70)#3,546 |
| 76. | Prospect Park Borough | 12.8% | 11.3%(+1.50)#76 | 8.3%(+4.50)#3,642 |
| 77. | Englewood | 12.7% | 11.3%(+1.40)#77 | 8.3%(+4.40)#3,684 |
| 78. | Absecon Highlands | 12.6% | 11.3%(+1.30)#78 | 8.3%(+4.30)#3,759 |
| 79. | Port Elizabeth | 12.5% | 11.3%(+1.20)#79 | 8.3%(+4.20)#3,842 |
| 80. | Holiday City Berkeley | 12.4% | 11.3%(+1.10)#80 | 8.3%(+4.10)#3,873 |
| 81. | Pine Ridge At Crestwood | 12.4% | 11.3%(+1.10)#81 | 8.3%(+4.10)#3,891 |
| 82. | Collingswood Borough | 12.3% | 11.3%(+1.00)#82 | 8.3%(+4.00)#3,932 |
| 83. | Cranford | 12.3% | 11.3%(+1.00)#83 | 8.3%(+4.00)#3,957 |
| 84. | Woodbine Borough | 12.2% | 11.3%(+0.900)#84 | 8.3%(+3.90)#4,003 |
| 85. | Princeton Junction | 12.1% | 11.3%(+0.800)#85 | 8.3%(+3.80)#4,069 |
| 86. | Fort Lee Borough | 12.0% | 11.3%(+0.700)#86 | 8.3%(+3.70)#4,109 |
| 87. | Long Branch | 12.0% | 11.3%(+0.700)#87 | 8.3%(+3.70)#4,110 |
| 88. | Bound Brook Borough | 12.0% | 11.3%(+0.700)#88 | 8.3%(+3.70)#4,117 |
| 89. | Belmar Borough | 12.0% | 11.3%(+0.700)#89 | 8.3%(+3.70)#4,124 |
| 90. | Hi Nella Borough | 12.0% | 11.3%(+0.700)#90 | 8.3%(+3.70)#4,148 |
| 91. | Edgewater Borough | 11.9% | 11.3%(+0.600)#91 | 8.3%(+3.60)#4,173 |
| 92. | The College Of New Jersey | 11.9% | 11.3%(+0.600)#92 | 8.3%(+3.60)#4,194 |
| 93. | Port Monmouth | 11.9% | 11.3%(+0.600)#93 | 8.3%(+3.60)#4,196 |
| 94. | Union | 11.9% | 11.3%(+0.600)#94 | 8.3%(+3.60)#4,198 |
| 95. | Barrington Borough | 11.7% | 11.3%(+0.400)#95 | 8.3%(+3.40)#4,326 |
| 96. | Haledon Borough | 11.6% | 11.3%(+0.300)#96 | 8.3%(+3.30)#4,385 |
| 97. | Six Mile Run | 11.6% | 11.3%(+0.300)#97 | 8.3%(+3.30)#4,392 |
| 98. | East Rutherford Borough | 11.5% | 11.3%(+0.200)#98 | 8.3%(+3.20)#4,450 |
| 99. | Beverly | 11.5% | 11.3%(+0.200)#99 | 8.3%(+3.20)#4,472 |
| 100. | Clementon Borough | 11.4% | 11.3%(+0.100)#100 | 8.3%(+3.10)#4,538 |
Common Questions
What are the Top 10 Cities with the Highest Percentage of Households Without a Vehicle in New Jersey?
Top 10 Cities with the Highest Percentage of Households Without a Vehicle in New Jersey are:
#1
40.9%
#2
40.5%
#3
40.0%
#4
38.5%
#5
36.7%
#6
35.6%
#7
34.9%
#8
34.3%
#9
33.7%
#10
33.7%
What city has the Highest Percentage of Households Without a Vehicle in New Jersey?
Atlantic City has the Highest Percentage of Households Without a Vehicle in New Jersey with 40.9%.
What is the Percentage of Households Without a Vehicle in the State of New Jersey?
Percentage of Households Without a Vehicle in New Jersey is 11.3%.
What is the Percentage of Households Without a Vehicle in the United States?
Percentage of Households Without a Vehicle in the United States is 8.3%.