Cities with the Highest Percentage of Immigrants from Uruguay in New Jersey
RELATED REPORTS & OPTIONS
Uruguay
New Jersey
Compare Cities
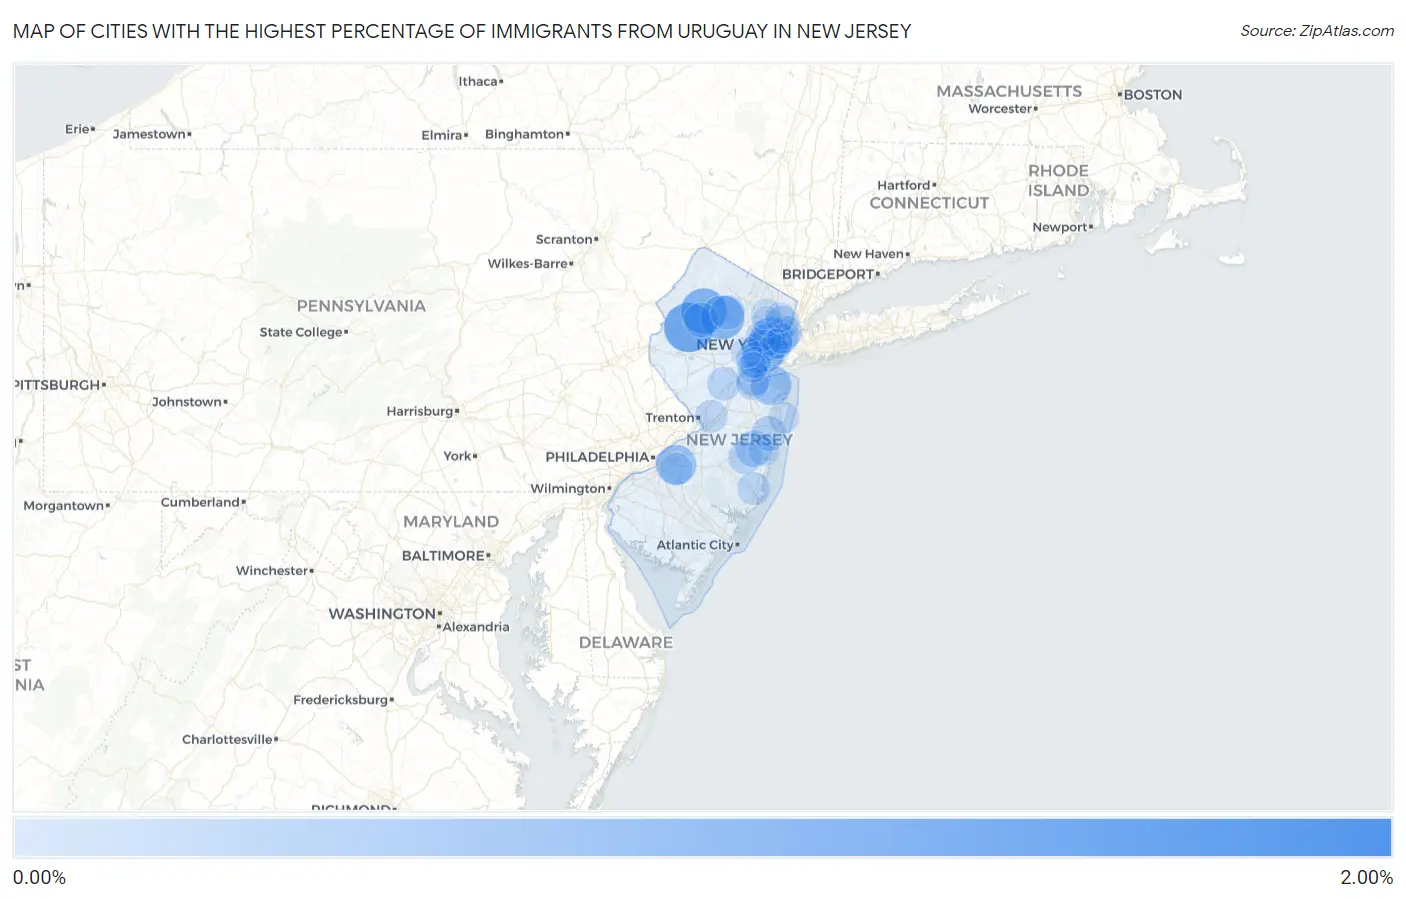
Map of Cities with the Highest Percentage of Immigrants from Uruguay in New Jersey
0.00%
2.00%
Cities with the Highest Percentage of Immigrants from Uruguay in New Jersey
| City | Uruguay | vs State | vs National | |
| 1. | Wharton Borough | 1.91% | 0.075%(+1.84)#-1 | 0.016%(+1.90)#0 |
| 2. | Beattystown | 1.33% | 0.075%(+1.25)#0 | 0.016%(+1.31)#1 |
| 3. | Union | 1.31% | 0.075%(+1.24)#1 | 0.016%(+1.30)#2 |
| 4. | Kenilworth Borough | 1.21% | 0.075%(+1.13)#2 | 0.016%(+1.19)#3 |
| 5. | Hampton Borough | 1.13% | 0.075%(+1.05)#3 | 0.016%(+1.11)#4 |
| 6. | New Milford Borough | 1.13% | 0.075%(+1.05)#4 | 0.016%(+1.11)#5 |
| 7. | Byram Center | 1.07% | 0.075%(+0.991)#5 | 0.016%(+1.05)#6 |
| 8. | Dover | 0.95% | 0.075%(+0.874)#6 | 0.016%(+0.934)#7 |
| 9. | Kearny | 0.87% | 0.075%(+0.797)#7 | 0.016%(+0.857)#8 |
| 10. | Lincoln Park Borough | 0.86% | 0.075%(+0.788)#8 | 0.016%(+0.848)#9 |
| 11. | Lake Hiawatha | 0.84% | 0.075%(+0.769)#9 | 0.016%(+0.829)#10 |
| 12. | Elizabeth | 0.84% | 0.075%(+0.765)#10 | 0.016%(+0.825)#118 |
| 13. | East Newark Borough | 0.74% | 0.075%(+0.660)#11 | 0.016%(+0.720)#119 |
| 14. | North Middletown | 0.70% | 0.075%(+0.621)#12 | 0.016%(+0.681)#120 |
| 15. | Greentree | 0.69% | 0.075%(+0.615)#13 | 0.016%(+0.674)#121 |
| 16. | Silver Lake Cdp Essex County | 0.48% | 0.075%(+0.401)#14 | 0.016%(+0.461)#122 |
| 17. | Leisure Village West | 0.42% | 0.075%(+0.344)#15 | 0.016%(+0.404)#123 |
| 18. | Roselle Borough | 0.36% | 0.075%(+0.285)#16 | 0.016%(+0.344)#124 |
| 19. | Roselle Park Borough | 0.33% | 0.075%(+0.254)#17 | 0.016%(+0.314)#125 |
| 20. | Ramtown | 0.32% | 0.075%(+0.247)#18 | 0.016%(+0.307)#126 |
| 21. | Budd Lake | 0.32% | 0.075%(+0.245)#19 | 0.016%(+0.305)#127 |
| 22. | Rahway | 0.31% | 0.075%(+0.235)#20 | 0.016%(+0.295)#128 |
| 23. | Ship Bottom Borough | 0.30% | 0.075%(+0.226)#21 | 0.016%(+0.286)#129 |
| 24. | South Amboy | 0.30% | 0.075%(+0.225)#22 | 0.016%(+0.284)#130 |
| 25. | White Meadow Lake | 0.29% | 0.075%(+0.217)#23 | 0.016%(+0.277)#131 |
| 26. | Stratford Borough | 0.29% | 0.075%(+0.212)#24 | 0.016%(+0.272)#132 |
| 27. | Hopatcong Borough | 0.28% | 0.075%(+0.202)#25 | 0.016%(+0.262)#133 |
| 28. | Union City | 0.25% | 0.075%(+0.177)#26 | 0.016%(+0.237)#134 |
| 29. | Guttenberg | 0.25% | 0.075%(+0.171)#27 | 0.016%(+0.231)#135 |
| 30. | Franklin Park | 0.24% | 0.075%(+0.163)#28 | 0.016%(+0.223)#136 |
| 31. | Woodland Park Borough | 0.23% | 0.075%(+0.150)#29 | 0.016%(+0.210)#137 |
| 32. | Crestwood Village | 0.22% | 0.075%(+0.149)#30 | 0.016%(+0.209)#138 |
| 33. | Ridgefield Park | 0.22% | 0.075%(+0.145)#31 | 0.016%(+0.205)#139 |
| 34. | North Plainfield Borough | 0.22% | 0.075%(+0.141)#32 | 0.016%(+0.200)#140 |
| 35. | Harrison | 0.21% | 0.075%(+0.133)#33 | 0.016%(+0.193)#141 |
| 36. | Newark | 0.20% | 0.075%(+0.126)#34 | 0.016%(+0.186)#142 |
| 37. | Ocean Acres | 0.20% | 0.075%(+0.122)#35 | 0.016%(+0.182)#143 |
| 38. | Hamilton Square | 0.18% | 0.075%(+0.101)#36 | 0.016%(+0.161)#144 |
| 39. | Garwood Borough | 0.18% | 0.075%(+0.101)#37 | 0.016%(+0.161)#145 |
| 40. | Linden | 0.17% | 0.075%(+0.090)#38 | 0.016%(+0.150)#146 |
| 41. | Springdale | 0.16% | 0.075%(+0.082)#39 | 0.016%(+0.142)#147 |
| 42. | Madison Park | 0.16% | 0.075%(+0.081)#40 | 0.016%(+0.141)#148 |
| 43. | Hawthorne Borough | 0.14% | 0.075%(+0.069)#41 | 0.016%(+0.128)#149 |
| 44. | Bayonne | 0.14% | 0.075%(+0.064)#42 | 0.016%(+0.123)#150 |
| 45. | Little Ferry Borough | 0.14% | 0.075%(+0.062)#43 | 0.016%(+0.121)#151 |
| 46. | Lodi Borough | 0.13% | 0.075%(+0.059)#44 | 0.016%(+0.119)#152 |
| 47. | Bellmawr Borough | 0.13% | 0.075%(+0.053)#45 | 0.016%(+0.113)#153 |
| 48. | Carteret Borough | 0.13% | 0.075%(+0.052)#46 | 0.016%(+0.112)#154 |
| 49. | Oradell Borough | 0.11% | 0.075%(+0.034)#47 | 0.016%(+0.094)#155 |
| 50. | Fairview Borough | 0.11% | 0.075%(+0.032)#48 | 0.016%(+0.092)#156 |
| 51. | Toms River | 0.11% | 0.075%(+0.030)#49 | 0.016%(+0.090)#157 |
| 52. | Butler Borough | 0.099% | 0.075%(+0.024)#50 | 0.016%(+0.084)#158 |
| 53. | Waldwick Borough | 0.099% | 0.075%(+0.024)#51 | 0.016%(+0.084)#159 |
| 54. | West Long Branch Borough | 0.094% | 0.075%(+0.018)#52 | 0.016%(+0.078)#160 |
| 55. | Asbury Park | 0.085% | 0.075%(+0.010)#53 | 0.016%(+0.070)#161 |
| 56. | Avenel | 0.081% | 0.075%(+0.006)#54 | 0.016%(+0.066)#162 |
| 57. | Westfield | 0.058% | 0.075%(-0.017)#55 | 0.016%(+0.043)#163 |
| 58. | Eatontown Borough | 0.052% | 0.075%(-0.024)#56 | 0.016%(+0.036)#164 |
| 59. | East Orange | 0.049% | 0.075%(-0.026)#57 | 0.016%(+0.034)#165 |
| 60. | Paterson | 0.038% | 0.075%(-0.037)#58 | 0.016%(+0.022)#166 |
| 61. | Sayreville Borough | 0.038% | 0.075%(-0.038)#59 | 0.016%(+0.022)#167 |
| 62. | Woodbridge | 0.029% | 0.075%(-0.047)#60 | 0.016%(+0.013)#168 |
| 63. | Clifton | 0.026% | 0.075%(-0.050)#61 | 0.016%(+0.010)#169 |
| 64. | Hoboken | 0.020% | 0.075%(-0.055)#62 | 0.016%(+0.005)#170 |
| 65. | Jersey City | 0.015% | 0.075%(-0.061)#63 | 0.016%(-0.001)#171 |
| 66. | Hackensack | 0.013% | 0.075%(-0.062)#64 | 0.016%(-0.002)#172 |
Common Questions
What are the Top 10 Cities with the Highest Percentage of Immigrants from Uruguay in New Jersey?
Top 10 Cities with the Highest Percentage of Immigrants from Uruguay in New Jersey are:
#1
1.33%
#2
1.07%
#3
0.95%
#4
0.87%
#5
0.84%
#6
0.70%
#7
0.69%
#8
0.42%
#9
0.32%
#10
0.32%
What city has the Highest Percentage of Immigrants from Uruguay in New Jersey?
Beattystown has the Highest Percentage of Immigrants from Uruguay in New Jersey with 1.33%.
What is the Percentage of Immigrants from Uruguay in the State of New Jersey?
Percentage of Immigrants from Uruguay in New Jersey is 0.075%.
What is the Percentage of Immigrants from Uruguay in the United States?
Percentage of Immigrants from Uruguay in the United States is 0.016%.