Cities with the Highest Percentage of Immigrants from St. Vincent and the Grenadines in New Jersey
RELATED REPORTS & OPTIONS
St. Vincent and the Grenadines
New Jersey
Compare Cities
Map of Cities with the Highest Percentage of Immigrants from St. Vincent and the Grenadines in New Jersey
0.00%
0.50%
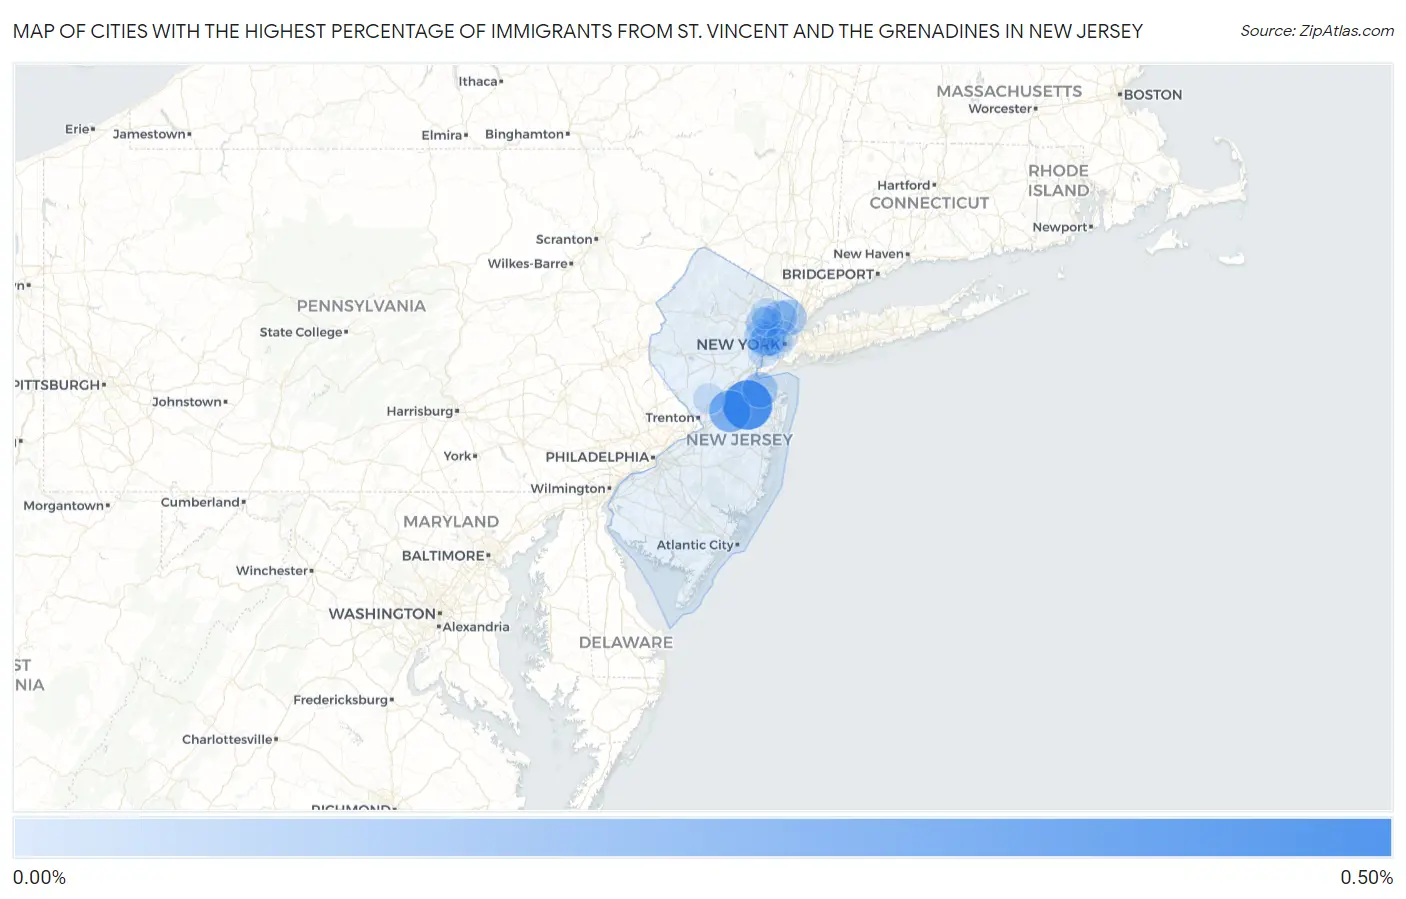
Cities with the Highest Percentage of Immigrants from St. Vincent and the Grenadines in New Jersey
| City | St. Vincent and the Grenadines | vs State | vs National | |
| 1. | Yorketown | 0.42% | 0.013%(+0.404)#216 | 0.0067%(+0.410)#1,659 |
| 2. | Freehold Borough | 0.34% | 0.013%(+0.332)#217 | 0.0067%(+0.337)#1,660 |
| 3. | Twin Rivers | 0.25% | 0.013%(+0.233)#218 | 0.0067%(+0.239)#1,661 |
| 4. | North Caldwell Borough | 0.24% | 0.013%(+0.229)#219 | 0.0067%(+0.235)#1,662 |
| 5. | Ampere North | 0.23% | 0.013%(+0.220)#220 | 0.0067%(+0.226)#1,663 |
| 6. | Caldwell Borough | 0.15% | 0.013%(+0.134)#221 | 0.0067%(+0.139)#1,664 |
| 7. | Englewood | 0.12% | 0.013%(+0.108)#222 | 0.0067%(+0.114)#1,665 |
| 8. | Fanwood Borough | 0.12% | 0.013%(+0.104)#223 | 0.0067%(+0.110)#1,666 |
| 9. | Strathmore | 0.12% | 0.013%(+0.103)#341 | 0.0067%(+0.109)#3,063 |
| 10. | Cliffside Park Borough | 0.094% | 0.013%(+0.081)#342 | 0.0067%(+0.087)#3,064 |
| 11. | Harrison | 0.088% | 0.013%(+0.076)#343 | 0.0067%(+0.082)#3,065 |
| 12. | Hackensack | 0.085% | 0.013%(+0.073)#344 | 0.0067%(+0.079)#3,066 |
| 13. | East Orange | 0.084% | 0.013%(+0.072)#345 | 0.0067%(+0.078)#3,067 |
| 14. | Upper Montclair | 0.072% | 0.013%(+0.060)#346 | 0.0067%(+0.066)#3,068 |
| 15. | Maywood Borough | 0.060% | 0.013%(+0.047)#347 | 0.0067%(+0.053)#3,069 |
| 16. | Newark | 0.041% | 0.013%(+0.029)#348 | 0.0067%(+0.035)#3,070 |
| 17. | Elizabeth | 0.036% | 0.013%(+0.024)#349 | 0.0067%(+0.029)#3,071 |
| 18. | Union City | 0.028% | 0.013%(+0.016)#350 | 0.0067%(+0.022)#3,072 |
| 19. | Paterson | 0.022% | 0.013%(+0.009)#351 | 0.0067%(+0.015)#3,073 |
| 20. | Clifton | 0.021% | 0.013%(+0.009)#352 | 0.0067%(+0.015)#3,074 |
| 21. | Princeton | 0.020% | 0.013%(+0.007)#353 | 0.0067%(+0.013)#3,075 |
| 22. | Jersey City | 0.015% | 0.013%(+0.003)#354 | 0.0067%(+0.009)#3,076 |
Common Questions
What are the Top 10 Cities with the Highest Percentage of Immigrants from St. Vincent and the Grenadines in New Jersey?
Top 10 Cities with the Highest Percentage of Immigrants from St. Vincent and the Grenadines in New Jersey are:
#1
0.42%
#2
0.25%
#3
0.12%
#4
0.12%
#5
0.088%
#6
0.085%
#7
0.084%
#8
0.072%
#9
0.041%
#10
0.036%
What city has the Highest Percentage of Immigrants from St. Vincent and the Grenadines in New Jersey?
Yorketown has the Highest Percentage of Immigrants from St. Vincent and the Grenadines in New Jersey with 0.42%.
What is the Percentage of Immigrants from St. Vincent and the Grenadines in the State of New Jersey?
Percentage of Immigrants from St. Vincent and the Grenadines in New Jersey is 0.013%.
What is the Percentage of Immigrants from St. Vincent and the Grenadines in the United States?
Percentage of Immigrants from St. Vincent and the Grenadines in the United States is 0.0067%.