Cities with the Highest Percentage of Turkish Population in New Jersey
RELATED REPORTS & OPTIONS
Turkish
New Jersey
Compare Cities
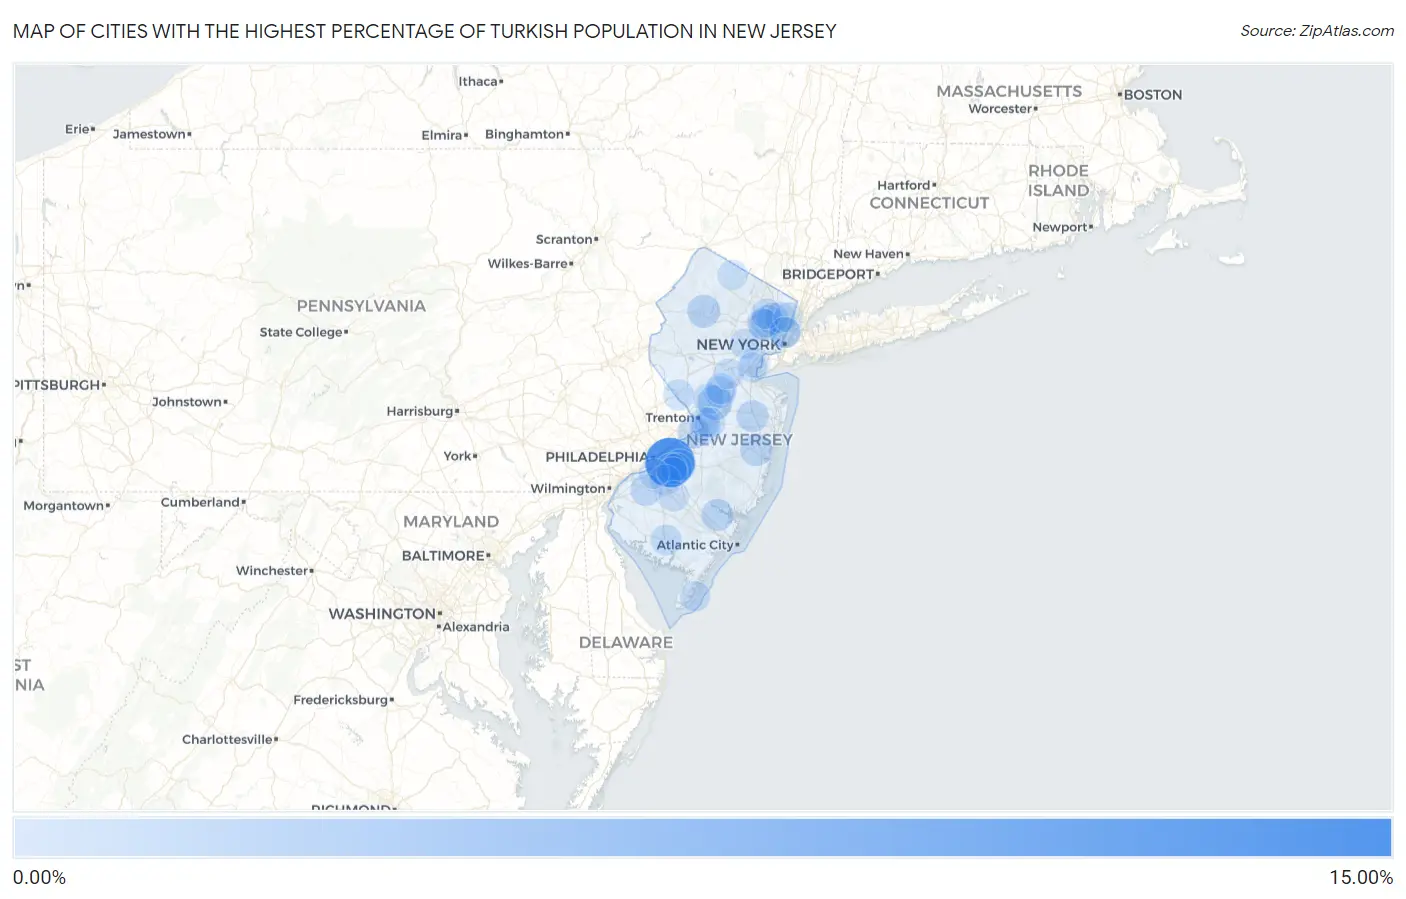
Map of Cities with the Highest Percentage of Turkish Population in New Jersey
0.00%
15.00%
Cities with the Highest Percentage of Turkish Population in New Jersey
| City | Turkish | vs State | vs National | |
| 1. | Ellisburg | 10.10% | 0.27%(+9.83)#1 | 0.071%(+10.0)#4 |
| 2. | Totowa Borough | 6.44% | 0.27%(+6.17)#2 | 0.071%(+6.37)#6 |
| 3. | East Rutherford Borough | 3.70% | 0.27%(+3.43)#3 | 0.071%(+3.63)#21 |
| 4. | Cresskill Borough | 3.05% | 0.27%(+2.78)#4 | 0.071%(+2.98)#31 |
| 5. | Princeton Junction | 2.57% | 0.27%(+2.30)#5 | 0.071%(+2.50)#44 |
| 6. | Woodland Park Borough | 1.99% | 0.27%(+1.71)#6 | 0.071%(+1.92)#64 |
| 7. | Preakness | 1.98% | 0.27%(+1.71)#7 | 0.071%(+1.91)#65 |
| 8. | Carlstadt Borough | 1.89% | 0.27%(+1.62)#8 | 0.071%(+1.82)#72 |
| 9. | Cliffside Park Borough | 1.78% | 0.27%(+1.51)#9 | 0.071%(+1.71)#78 |
| 10. | Byram Center | 1.73% | 0.27%(+1.45)#10 | 0.071%(+1.66)#80 |
| 11. | The Ponds | 1.64% | 0.27%(+1.36)#11 | 0.071%(+1.57)#90 |
| 12. | Matawan Borough | 1.58% | 0.27%(+1.31)#12 | 0.071%(+1.51)#101 |
| 13. | Fort Lee Borough | 1.55% | 0.27%(+1.28)#13 | 0.071%(+1.48)#104 |
| 14. | Deal Borough | 1.55% | 0.27%(+1.28)#14 | 0.071%(+1.48)#106 |
| 15. | Little Ferry Borough | 1.53% | 0.27%(+1.26)#15 | 0.071%(+1.46)#110 |
| 16. | Stirling | 1.50% | 0.27%(+1.23)#16 | 0.071%(+1.43)#111 |
| 17. | North Caldwell Borough | 1.48% | 0.27%(+1.21)#17 | 0.071%(+1.41)#112 |
| 18. | Pine Lake Park | 1.40% | 0.27%(+1.13)#18 | 0.071%(+1.33)#119 |
| 19. | Clifton | 1.38% | 0.27%(+1.10)#19 | 0.071%(+1.31)#124 |
| 20. | Moonachie Borough | 1.36% | 0.27%(+1.09)#20 | 0.071%(+1.29)#126 |
| 21. | Egg Harbor City | 1.33% | 0.27%(+1.05)#21 | 0.071%(+1.25)#128 |
| 22. | Netcong Borough | 1.32% | 0.27%(+1.05)#22 | 0.071%(+1.25)#129 |
| 23. | Florence | 1.31% | 0.27%(+1.04)#23 | 0.071%(+1.24)#133 |
| 24. | West Freehold | 1.29% | 0.27%(+1.02)#24 | 0.071%(+1.22)#136 |
| 25. | North Arlington Borough | 1.19% | 0.27%(+0.921)#25 | 0.071%(+1.12)#152 |
| 26. | Englishtown Borough | 1.17% | 0.27%(+0.902)#26 | 0.071%(+1.10)#159 |
| 27. | New Milford Borough | 1.15% | 0.27%(+0.883)#27 | 0.071%(+1.08)#163 |
| 28. | Butler Borough | 1.14% | 0.27%(+0.872)#28 | 0.071%(+1.07)#164 |
| 29. | Seaside Heights Borough | 1.13% | 0.27%(+0.863)#29 | 0.071%(+1.06)#165 |
| 30. | William Paterson University Of New Jersey | 1.13% | 0.27%(+0.854)#30 | 0.071%(+1.06)#166 |
| 31. | Demarest Borough | 1.12% | 0.27%(+0.844)#31 | 0.071%(+1.04)#169 |
| 32. | Glen Rock Borough | 1.11% | 0.27%(+0.837)#32 | 0.071%(+1.04)#173 |
| 33. | Mullica Hill | 1.10% | 0.27%(+0.828)#33 | 0.071%(+1.03)#175 |
| 34. | Eatontown Borough | 1.09% | 0.27%(+0.823)#34 | 0.071%(+1.02)#176 |
| 35. | Brookdale | 1.09% | 0.27%(+0.814)#35 | 0.071%(+1.02)#178 |
| 36. | Cedar Knolls | 1.08% | 0.27%(+0.804)#36 | 0.071%(+1.01)#181 |
| 37. | Lake Hiawatha | 1.05% | 0.27%(+0.781)#37 | 0.071%(+0.983)#187 |
| 38. | Garfield | 1.00% | 0.27%(+0.729)#38 | 0.071%(+0.930)#200 |
| 39. | Riverdale Borough | 0.98% | 0.27%(+0.708)#39 | 0.071%(+0.909)#208 |
| 40. | Hampton Borough | 0.94% | 0.27%(+0.668)#40 | 0.071%(+0.869)#215 |
| 41. | Rutherford Borough | 0.92% | 0.27%(+0.645)#41 | 0.071%(+0.846)#222 |
| 42. | Stanhope Borough | 0.91% | 0.27%(+0.634)#42 | 0.071%(+0.835)#226 |
| 43. | Towaco | 0.90% | 0.27%(+0.629)#43 | 0.071%(+0.830)#228 |
| 44. | Marlton | 0.89% | 0.27%(+0.622)#44 | 0.071%(+0.823)#234 |
| 45. | Heathcote | 0.89% | 0.27%(+0.614)#45 | 0.071%(+0.815)#238 |
| 46. | Morris Plains Borough | 0.84% | 0.27%(+0.564)#46 | 0.071%(+0.765)#251 |
| 47. | Lambertville | 0.82% | 0.27%(+0.552)#47 | 0.071%(+0.753)#254 |
| 48. | Springdale | 0.81% | 0.27%(+0.541)#48 | 0.071%(+0.743)#260 |
| 49. | Kinnelon Borough | 0.80% | 0.27%(+0.529)#49 | 0.071%(+0.730)#265 |
| 50. | Hillsborough | 0.80% | 0.27%(+0.524)#50 | 0.071%(+0.725)#268 |
| 51. | Millville | 0.78% | 0.27%(+0.513)#51 | 0.071%(+0.714)#271 |
| 52. | Carlls Corner | 0.78% | 0.27%(+0.511)#52 | 0.071%(+0.712)#272 |
| 53. | Roselle Park Borough | 0.77% | 0.27%(+0.502)#53 | 0.071%(+0.703)#280 |
| 54. | Oradell Borough | 0.77% | 0.27%(+0.496)#54 | 0.071%(+0.697)#284 |
| 55. | Ashland | 0.75% | 0.27%(+0.474)#55 | 0.071%(+0.675)#292 |
| 56. | Princeton | 0.74% | 0.27%(+0.470)#56 | 0.071%(+0.671)#295 |
| 57. | Ramsey Borough | 0.73% | 0.27%(+0.461)#57 | 0.071%(+0.662)#303 |
| 58. | West New York | 0.72% | 0.27%(+0.451)#58 | 0.071%(+0.652)#306 |
| 59. | Kendall Park | 0.72% | 0.27%(+0.444)#59 | 0.071%(+0.645)#309 |
| 60. | Hackensack | 0.71% | 0.27%(+0.436)#60 | 0.071%(+0.637)#310 |
| 61. | Lake Como Borough | 0.70% | 0.27%(+0.430)#61 | 0.071%(+0.631)#315 |
| 62. | Guttenberg | 0.70% | 0.27%(+0.425)#62 | 0.071%(+0.626)#322 |
| 63. | Upper Montclair | 0.67% | 0.27%(+0.395)#63 | 0.071%(+0.596)#332 |
| 64. | Union Beach Borough | 0.66% | 0.27%(+0.389)#64 | 0.071%(+0.590)#341 |
| 65. | Maywood Borough | 0.66% | 0.27%(+0.386)#65 | 0.071%(+0.587)#345 |
| 66. | Fairview Borough | 0.66% | 0.27%(+0.384)#66 | 0.071%(+0.585)#347 |
| 67. | Blackwood | 0.63% | 0.27%(+0.360)#67 | 0.071%(+0.561)#359 |
| 68. | Closter Borough | 0.62% | 0.27%(+0.348)#68 | 0.071%(+0.549)#367 |
| 69. | Barrington Borough | 0.61% | 0.27%(+0.341)#69 | 0.071%(+0.542)#373 |
| 70. | Glassboro Borough | 0.60% | 0.27%(+0.332)#70 | 0.071%(+0.533)#380 |
| 71. | Williamstown | 0.60% | 0.27%(+0.324)#71 | 0.071%(+0.525)#388 |
| 72. | Somerset | 0.59% | 0.27%(+0.314)#72 | 0.071%(+0.515)#395 |
| 73. | Bordentown | 0.58% | 0.27%(+0.305)#73 | 0.071%(+0.506)#400 |
| 74. | South Toms River Borough | 0.57% | 0.27%(+0.302)#74 | 0.071%(+0.503)#404 |
| 75. | Summit | 0.55% | 0.27%(+0.282)#75 | 0.071%(+0.483)#418 |
| 76. | North Wildwood | 0.55% | 0.27%(+0.278)#76 | 0.071%(+0.479)#422 |
| 77. | Mount Arlington Borough | 0.55% | 0.27%(+0.274)#77 | 0.071%(+0.475)#423 |
| 78. | Paterson | 0.54% | 0.27%(+0.264)#78 | 0.071%(+0.465)#431 |
| 79. | Califon Borough | 0.53% | 0.27%(+0.261)#79 | 0.071%(+0.462)#435 |
| 80. | Yardville | 0.53% | 0.27%(+0.259)#80 | 0.071%(+0.460)#439 |
| 81. | White Horse | 0.53% | 0.27%(+0.254)#81 | 0.071%(+0.455)#442 |
| 82. | Echelon | 0.52% | 0.27%(+0.245)#82 | 0.071%(+0.446)#445 |
| 83. | Landing | 0.50% | 0.27%(+0.228)#83 | 0.071%(+0.429)#456 |
| 84. | Upper Saddle River Borough | 0.49% | 0.27%(+0.221)#84 | 0.071%(+0.422)#465 |
| 85. | Red Bank Borough | 0.47% | 0.27%(+0.202)#85 | 0.071%(+0.403)#487 |
| 86. | Park Ridge Borough | 0.47% | 0.27%(+0.201)#86 | 0.071%(+0.402)#488 |
| 87. | Pompton Lakes Borough | 0.47% | 0.27%(+0.199)#87 | 0.071%(+0.400)#491 |
| 88. | Montclair State University | 0.47% | 0.27%(+0.195)#88 | 0.071%(+0.396)#497 |
| 89. | Madison Borough | 0.45% | 0.27%(+0.182)#89 | 0.071%(+0.383)#513 |
| 90. | Mount Hope | 0.45% | 0.27%(+0.181)#90 | 0.071%(+0.382)#518 |
| 91. | Woodbury | 0.44% | 0.27%(+0.169)#91 | 0.071%(+0.370)#538 |
| 92. | Avenel | 0.42% | 0.27%(+0.152)#92 | 0.071%(+0.353)#560 |
| 93. | Paramus Borough | 0.41% | 0.27%(+0.142)#93 | 0.071%(+0.343)#571 |
| 94. | South Bound Brook Borough | 0.41% | 0.27%(+0.142)#94 | 0.071%(+0.343)#572 |
| 95. | Wanaque Borough | 0.41% | 0.27%(+0.138)#95 | 0.071%(+0.339)#582 |
| 96. | Keansburg Borough | 0.41% | 0.27%(+0.138)#96 | 0.071%(+0.339)#583 |
| 97. | Woodbridge | 0.41% | 0.27%(+0.134)#97 | 0.071%(+0.335)#589 |
| 98. | Dumont Borough | 0.39% | 0.27%(+0.117)#98 | 0.071%(+0.318)#612 |
| 99. | Englewood | 0.37% | 0.27%(+0.099)#99 | 0.071%(+0.300)#640 |
| 100. | Highland Lakes | 0.37% | 0.27%(+0.095)#100 | 0.071%(+0.296)#646 |
Common Questions
What are the Top 10 Cities with the Highest Percentage of Turkish Population in New Jersey?
Top 10 Cities with the Highest Percentage of Turkish Population in New Jersey are:
#1
10.10%
#2
2.57%
#3
1.73%
#4
1.40%
#5
1.38%
#6
1.33%
#7
1.31%
#8
1.29%
#9
1.10%
#10
1.09%
What city has the Highest Percentage of Turkish Population in New Jersey?
Ellisburg has the Highest Percentage of Turkish Population in New Jersey with 10.10%.
What is the Percentage of Turkish Population in the State of New Jersey?
Percentage of Turkish Population in New Jersey is 0.27%.
What is the Percentage of Turkish Population in the United States?
Percentage of Turkish Population in the United States is 0.071%.