Cities with the Highest Percentage of Population Employed in Office & Administration in New Jersey
RELATED REPORTS & OPTIONS
Office & Administration
New Jersey
Compare Cities
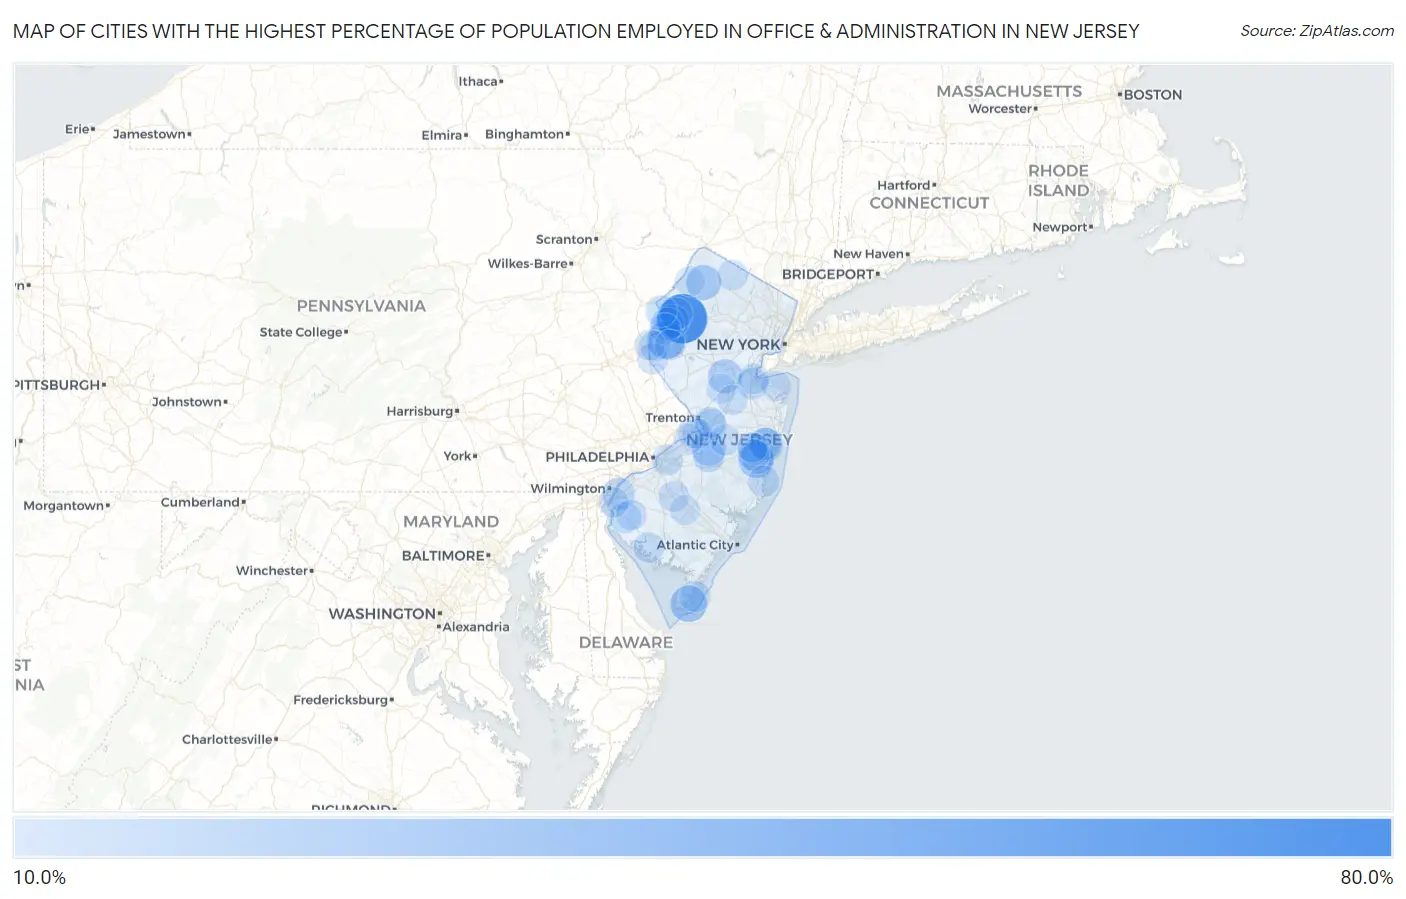
Map of Cities with the Highest Percentage of Population Employed in Office & Administration in New Jersey
0.0%
80.0%
Cities with the Highest Percentage of Population Employed in Office & Administration in New Jersey
| City | % Employed | vs State | vs National | |
| 1. | Great Meadows | 79.4% | 11.1%(+68.3)#1 | 10.9%(+68.5)#61 |
| 2. | Renaissance At Monroe | 52.1% | 11.1%(+41.0)#2 | 10.9%(+41.2)#190 |
| 3. | Deerfield Street | 50.0% | 11.1%(+38.9)#3 | 10.9%(+39.1)#213 |
| 4. | Broadway | 40.9% | 11.1%(+29.8)#4 | 10.9%(+30.1)#394 |
| 5. | Richland | 38.6% | 11.1%(+27.6)#5 | 10.9%(+27.8)#455 |
| 6. | Diamond Beach | 36.6% | 11.1%(+25.5)#6 | 10.9%(+25.7)#509 |
| 7. | Laurel Heights | 34.6% | 11.1%(+23.5)#7 | 10.9%(+23.7)#593 |
| 8. | Marshallville | 34.6% | 11.1%(+23.5)#8 | 10.9%(+23.7)#594 |
| 9. | Teterboro Borough | 34.2% | 11.1%(+23.1)#9 | 10.9%(+23.4)#608 |
| 10. | Holiday Heights | 33.8% | 11.1%(+22.7)#10 | 10.9%(+22.9)#625 |
| 11. | East Vineland | 32.4% | 11.1%(+21.3)#11 | 10.9%(+21.5)#719 |
| 12. | Pluckemin | 32.2% | 11.1%(+21.1)#12 | 10.9%(+21.3)#731 |
| 13. | Ross Corner | 31.6% | 11.1%(+20.5)#13 | 10.9%(+20.7)#758 |
| 14. | Sweetwater | 30.1% | 11.1%(+19.0)#14 | 10.9%(+19.2)#836 |
| 15. | Washington Crossing | 30.0% | 11.1%(+18.9)#15 | 10.9%(+19.1)#841 |
| 16. | Middlebush | 29.1% | 11.1%(+18.0)#16 | 10.9%(+18.2)#912 |
| 17. | Juliustown | 29.0% | 11.1%(+18.0)#17 | 10.9%(+18.2)#917 |
| 18. | Oldwick | 28.5% | 11.1%(+17.4)#18 | 10.9%(+17.6)#970 |
| 19. | Leisure Village East | 28.0% | 11.1%(+16.9)#19 | 10.9%(+17.1)#1,006 |
| 20. | Sunset Lake | 27.1% | 11.1%(+16.0)#20 | 10.9%(+16.2)#1,097 |
| 21. | William Paterson University Of New Jersey | 26.1% | 11.1%(+15.1)#21 | 10.9%(+15.3)#1,192 |
| 22. | Carlls Corner | 25.8% | 11.1%(+14.7)#22 | 10.9%(+14.9)#1,221 |
| 23. | Mountain Lake | 25.2% | 11.1%(+14.1)#23 | 10.9%(+14.3)#1,282 |
| 24. | Audubon Park Borough | 24.5% | 11.1%(+13.5)#24 | 10.9%(+13.7)#1,390 |
| 25. | Holiday City South | 24.5% | 11.1%(+13.4)#25 | 10.9%(+13.6)#1,396 |
| 26. | Lakehurst Borough | 24.3% | 11.1%(+13.2)#26 | 10.9%(+13.4)#1,419 |
| 27. | Bridgeville | 24.1% | 11.1%(+13.0)#27 | 10.9%(+13.2)#1,452 |
| 28. | Carneys Point | 23.5% | 11.1%(+12.4)#28 | 10.9%(+12.7)#1,555 |
| 29. | Leisure Village | 23.4% | 11.1%(+12.4)#29 | 10.9%(+12.6)#1,567 |
| 30. | Hope | 23.3% | 11.1%(+12.2)#30 | 10.9%(+12.5)#1,587 |
| 31. | Pemberton Borough | 21.5% | 11.1%(+10.4)#31 | 10.9%(+10.6)#1,966 |
| 32. | Leisure Village West | 21.5% | 11.1%(+10.4)#32 | 10.9%(+10.6)#1,973 |
| 33. | Pemberton Heights | 21.0% | 11.1%(+9.94)#33 | 10.9%(+10.2)#2,101 |
| 34. | Quinton | 20.9% | 11.1%(+9.85)#34 | 10.9%(+10.1)#2,121 |
| 35. | Hightstown Borough | 20.8% | 11.1%(+9.78)#35 | 10.9%(+9.99)#2,139 |
| 36. | Gibbsboro Borough | 20.8% | 11.1%(+9.75)#36 | 10.9%(+9.96)#2,155 |
| 37. | Grenloch | 20.7% | 11.1%(+9.61)#37 | 10.9%(+9.82)#2,197 |
| 38. | Newfoundland | 20.6% | 11.1%(+9.57)#38 | 10.9%(+9.78)#2,207 |
| 39. | Cumberland-Hesstown | 20.4% | 11.1%(+9.30)#39 | 10.9%(+9.51)#2,287 |
| 40. | Holiday City Berkeley | 20.4% | 11.1%(+9.29)#40 | 10.9%(+9.50)#2,293 |
| 41. | Columbia | 20.2% | 11.1%(+9.16)#41 | 10.9%(+9.37)#2,330 |
| 42. | Madison Park | 20.2% | 11.1%(+9.15)#42 | 10.9%(+9.36)#2,334 |
| 43. | Waretown | 19.9% | 11.1%(+8.87)#43 | 10.9%(+9.08)#2,455 |
| 44. | Groveville | 19.8% | 11.1%(+8.72)#44 | 10.9%(+8.93)#2,504 |
| 45. | Florence | 19.8% | 11.1%(+8.71)#45 | 10.9%(+8.92)#2,508 |
| 46. | North Wildwood | 19.8% | 11.1%(+8.70)#46 | 10.9%(+8.91)#2,515 |
| 47. | Stonebridge | 19.5% | 11.1%(+8.42)#47 | 10.9%(+8.63)#2,618 |
| 48. | Buena Borough | 19.4% | 11.1%(+8.38)#48 | 10.9%(+8.59)#2,627 |
| 49. | Rutgers University-Busch Campus | 19.3% | 11.1%(+8.26)#49 | 10.9%(+8.47)#2,670 |
| 50. | Golden Triangle | 19.3% | 11.1%(+8.24)#50 | 10.9%(+8.45)#2,680 |
| 51. | Vauxhall | 19.3% | 11.1%(+8.19)#51 | 10.9%(+8.40)#2,693 |
| 52. | Brookfield | 19.2% | 11.1%(+8.13)#52 | 10.9%(+8.34)#2,724 |
| 53. | Landing | 18.9% | 11.1%(+7.84)#53 | 10.9%(+8.05)#2,853 |
| 54. | Yardville | 18.9% | 11.1%(+7.79)#54 | 10.9%(+8.00)#2,877 |
| 55. | Silver Lake Cdp Warren County | 18.8% | 11.1%(+7.72)#55 | 10.9%(+7.93)#2,918 |
| 56. | Finesville | 18.7% | 11.1%(+7.64)#56 | 10.9%(+7.85)#2,973 |
| 57. | Lopatcong Overlook | 18.7% | 11.1%(+7.61)#57 | 10.9%(+7.82)#2,984 |
| 58. | New Egypt | 18.6% | 11.1%(+7.53)#58 | 10.9%(+7.74)#3,028 |
| 59. | Totowa Borough | 18.5% | 11.1%(+7.40)#59 | 10.9%(+7.61)#3,103 |
| 60. | Carteret Borough | 18.4% | 11.1%(+7.30)#60 | 10.9%(+7.51)#3,150 |
| 61. | South Amboy | 18.3% | 11.1%(+7.28)#61 | 10.9%(+7.49)#3,154 |
| 62. | Williamstown | 18.3% | 11.1%(+7.22)#62 | 10.9%(+7.43)#3,185 |
| 63. | Neptune City Borough | 18.3% | 11.1%(+7.22)#63 | 10.9%(+7.43)#3,188 |
| 64. | Alloway | 18.2% | 11.1%(+7.12)#64 | 10.9%(+7.33)#3,222 |
| 65. | Delaware Park | 18.2% | 11.1%(+7.12)#65 | 10.9%(+7.33)#3,229 |
| 66. | Ocean View | 18.1% | 11.1%(+7.05)#66 | 10.9%(+7.26)#3,286 |
| 67. | Shiloh Borough | 17.9% | 11.1%(+6.86)#67 | 10.9%(+7.07)#3,384 |
| 68. | Cedarville | 17.9% | 11.1%(+6.84)#68 | 10.9%(+7.04)#3,401 |
| 69. | Asbury | 17.9% | 11.1%(+6.83)#69 | 10.9%(+7.04)#3,406 |
| 70. | Palmyra Borough | 17.9% | 11.1%(+6.82)#70 | 10.9%(+7.03)#3,409 |
| 71. | Woodstown Borough | 17.8% | 11.1%(+6.72)#71 | 10.9%(+6.93)#3,458 |
| 72. | Kean University | 17.8% | 11.1%(+6.71)#72 | 10.9%(+6.92)#3,472 |
| 73. | Pine Hill Borough | 17.7% | 11.1%(+6.62)#73 | 10.9%(+6.83)#3,512 |
| 74. | Mount Ephraim Borough | 17.7% | 11.1%(+6.62)#74 | 10.9%(+6.83)#3,515 |
| 75. | Highland Lakes | 17.6% | 11.1%(+6.58)#75 | 10.9%(+6.79)#3,555 |
| 76. | West Wildwood Borough | 17.4% | 11.1%(+6.35)#76 | 10.9%(+6.56)#3,697 |
| 77. | Elmer Borough | 17.4% | 11.1%(+6.31)#77 | 10.9%(+6.52)#3,722 |
| 78. | Leesburg | 17.2% | 11.1%(+6.18)#78 | 10.9%(+6.38)#3,809 |
| 79. | Pennsville | 17.0% | 11.1%(+5.97)#79 | 10.9%(+6.18)#3,948 |
| 80. | Laurel Springs Borough | 17.0% | 11.1%(+5.88)#80 | 10.9%(+6.09)#4,006 |
| 81. | Roebling | 16.8% | 11.1%(+5.77)#81 | 10.9%(+5.98)#4,079 |
| 82. | Ogdensburg Borough | 16.8% | 11.1%(+5.70)#82 | 10.9%(+5.91)#4,129 |
| 83. | Palermo | 16.8% | 11.1%(+5.68)#83 | 10.9%(+5.89)#4,135 |
| 84. | Milltown Borough | 16.7% | 11.1%(+5.59)#84 | 10.9%(+5.80)#4,244 |
| 85. | Kendall Park | 16.6% | 11.1%(+5.57)#85 | 10.9%(+5.78)#4,250 |
| 86. | Belford | 16.6% | 11.1%(+5.48)#86 | 10.9%(+5.69)#4,304 |
| 87. | Collings Lakes | 16.5% | 11.1%(+5.48)#87 | 10.9%(+5.69)#4,313 |
| 88. | South Seaville | 16.5% | 11.1%(+5.47)#88 | 10.9%(+5.68)#4,319 |
| 89. | Woodbury Heights Borough | 16.5% | 11.1%(+5.45)#89 | 10.9%(+5.66)#4,331 |
| 90. | Prospect Park Borough | 16.5% | 11.1%(+5.44)#90 | 10.9%(+5.65)#4,334 |
| 91. | Leisure Knoll | 16.5% | 11.1%(+5.39)#91 | 10.9%(+5.60)#4,373 |
| 92. | Barrington Borough | 16.4% | 11.1%(+5.37)#92 | 10.9%(+5.57)#4,394 |
| 93. | Union | 16.4% | 11.1%(+5.35)#93 | 10.9%(+5.56)#4,403 |
| 94. | Midland Park Borough | 16.4% | 11.1%(+5.34)#94 | 10.9%(+5.55)#4,419 |
| 95. | Rossmoor | 16.4% | 11.1%(+5.34)#95 | 10.9%(+5.55)#4,420 |
| 96. | Swedesboro Borough | 16.4% | 11.1%(+5.32)#96 | 10.9%(+5.53)#4,435 |
| 97. | Burlington | 16.4% | 11.1%(+5.30)#97 | 10.9%(+5.51)#4,446 |
| 98. | Crandon Lakes | 16.3% | 11.1%(+5.28)#98 | 10.9%(+5.49)#4,464 |
| 99. | Mauricetown | 16.2% | 11.1%(+5.15)#99 | 10.9%(+5.36)#4,583 |
| 100. | Thorofare | 16.2% | 11.1%(+5.14)#100 | 10.9%(+5.35)#4,590 |
Common Questions
What are the Top 10 Cities with the Highest Percentage of Population Employed in Office & Administration in New Jersey?
Top 10 Cities with the Highest Percentage of Population Employed in Office & Administration in New Jersey are:
#1
79.4%
#2
40.9%
#3
36.6%
#4
33.8%
#5
31.6%
#6
29.1%
#7
29.0%
#8
28.0%
#9
25.2%
#10
24.5%
What city has the Highest Percentage of Population Employed in Office & Administration in New Jersey?
Great Meadows has the Highest Percentage of Population Employed in Office & Administration in New Jersey with 79.4%.
What is the Percentage of Population Employed in Office & Administration in the State of New Jersey?
Percentage of Population Employed in Office & Administration in New Jersey is 11.1%.
What is the Percentage of Population Employed in Office & Administration in the United States?
Percentage of Population Employed in Office & Administration in the United States is 10.9%.