Cities with the Highest Percentage of Italian Population in New Jersey
RELATED REPORTS & OPTIONS
Italian
New Jersey
Compare Cities
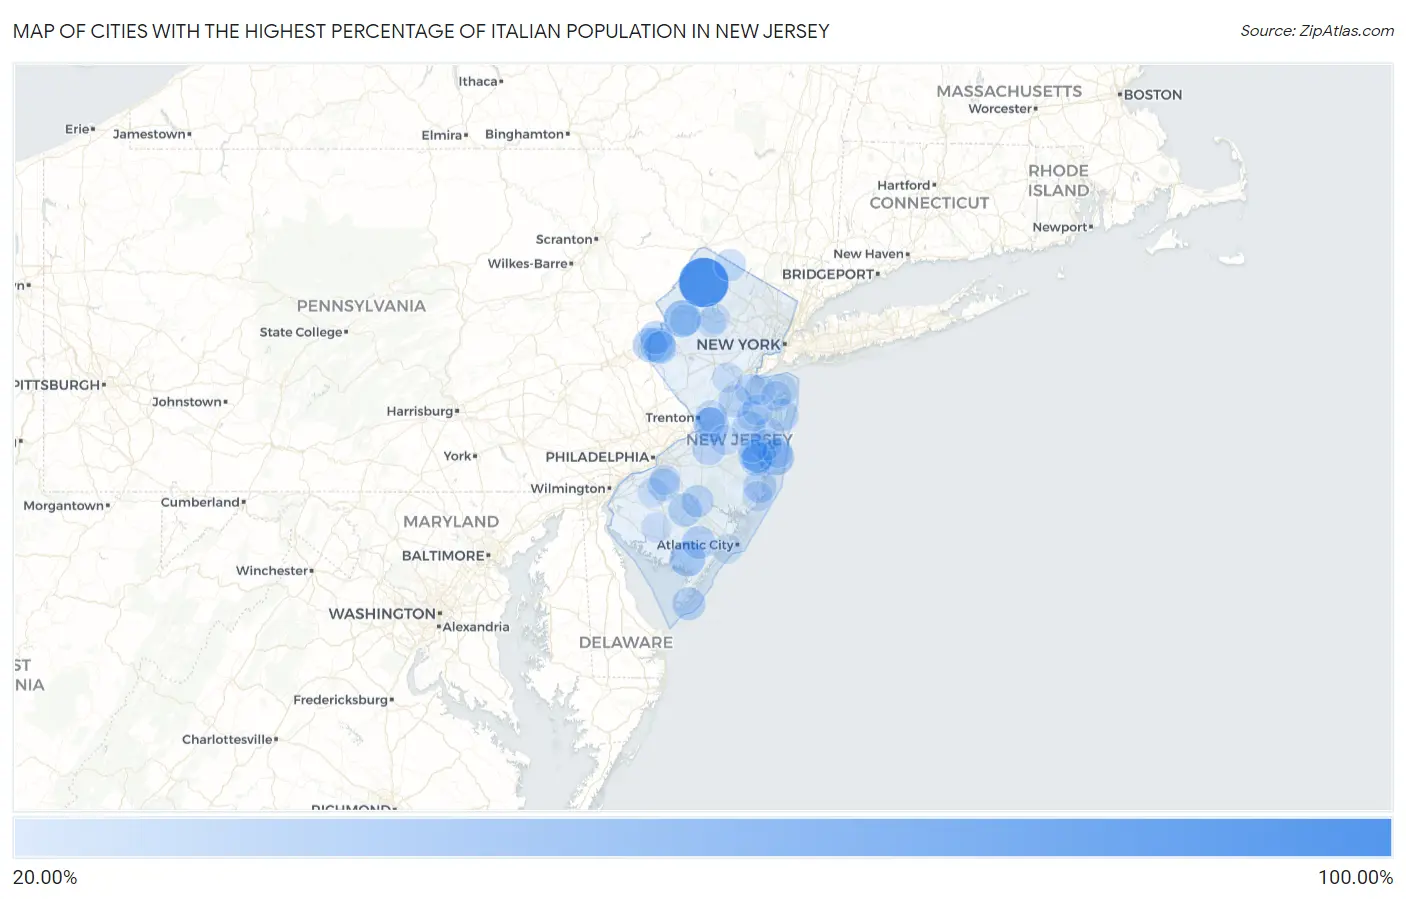
Map of Cities with the Highest Percentage of Italian Population in New Jersey
0.00%
100.00%
Cities with the Highest Percentage of Italian Population in New Jersey
| City | Italian | vs State | vs National | |
| 1. | Ross Corner | 100.00% | 14.29%(+85.7)#1 | 4.93%(+95.1)#1 |
| 2. | Great Meadows | 52.90% | 14.29%(+38.6)#2 | 4.93%(+48.0)#35 |
| 3. | Roadstown | 50.61% | 14.29%(+36.3)#3 | 4.93%(+45.7)#41 |
| 4. | Dover Beaches South | 47.96% | 14.29%(+33.7)#4 | 4.93%(+43.0)#49 |
| 5. | Belleplain | 47.30% | 14.29%(+33.0)#5 | 4.93%(+42.4)#53 |
| 6. | Groveville | 46.51% | 14.29%(+32.2)#6 | 4.93%(+41.6)#58 |
| 7. | Silver Ridge | 45.72% | 14.29%(+31.4)#7 | 4.93%(+40.8)#63 |
| 8. | Upper Stewartsville | 44.77% | 14.29%(+30.5)#8 | 4.93%(+39.8)#67 |
| 9. | Germania | 44.27% | 14.29%(+30.0)#9 | 4.93%(+39.3)#73 |
| 10. | Delaware Park | 42.44% | 14.29%(+28.2)#10 | 4.93%(+37.5)#78 |
| 11. | Lavallette Borough | 40.37% | 14.29%(+26.1)#11 | 4.93%(+35.4)#89 |
| 12. | Collings Lakes | 40.08% | 14.29%(+25.8)#12 | 4.93%(+35.1)#92 |
| 13. | Lower Berkshire Valley | 39.70% | 14.29%(+25.4)#13 | 4.93%(+34.8)#97 |
| 14. | Great Notch | 39.55% | 14.29%(+25.3)#14 | 4.93%(+34.6)#98 |
| 15. | Barnegat | 38.64% | 14.29%(+24.4)#15 | 4.93%(+33.7)#107 |
| 16. | Estell Manor | 38.52% | 14.29%(+24.2)#16 | 4.93%(+33.6)#108 |
| 17. | Diamond Beach | 38.50% | 14.29%(+24.2)#17 | 4.93%(+33.6)#109 |
| 18. | Harmony | 38.30% | 14.29%(+24.0)#18 | 4.93%(+33.4)#112 |
| 19. | Vista Center | 38.01% | 14.29%(+23.7)#19 | 4.93%(+33.1)#114 |
| 20. | Stewartsville | 37.66% | 14.29%(+23.4)#20 | 4.93%(+32.7)#121 |
| 21. | Whittingham | 37.47% | 14.29%(+23.2)#21 | 4.93%(+32.5)#125 |
| 22. | Juliustown | 37.31% | 14.29%(+23.0)#22 | 4.93%(+32.4)#127 |
| 23. | Sewell | 37.20% | 14.29%(+22.9)#23 | 4.93%(+32.3)#129 |
| 24. | Turnersville | 36.37% | 14.29%(+22.1)#24 | 4.93%(+31.4)#137 |
| 25. | Folsom Borough | 36.23% | 14.29%(+21.9)#25 | 4.93%(+31.3)#140 |
| 26. | Wanamassa | 36.14% | 14.29%(+21.9)#26 | 4.93%(+31.2)#142 |
| 27. | Emerson Borough | 36.08% | 14.29%(+21.8)#27 | 4.93%(+31.2)#143 |
| 28. | Jobstown | 36.01% | 14.29%(+21.7)#28 | 4.93%(+31.1)#145 |
| 29. | Hammonton | 35.28% | 14.29%(+21.0)#29 | 4.93%(+30.4)#158 |
| 30. | Malaga | 34.97% | 14.29%(+20.7)#30 | 4.93%(+30.0)#163 |
| 31. | Beesleys Point | 34.61% | 14.29%(+20.3)#31 | 4.93%(+29.7)#168 |
| 32. | Seaside Heights Borough | 34.53% | 14.29%(+20.2)#32 | 4.93%(+29.6)#169 |
| 33. | Holiday Heights | 34.36% | 14.29%(+20.1)#33 | 4.93%(+29.4)#172 |
| 34. | Brownville | 34.26% | 14.29%(+20.0)#34 | 4.93%(+29.3)#175 |
| 35. | Encore At Monroe | 34.18% | 14.29%(+19.9)#35 | 4.93%(+29.3)#181 |
| 36. | Vernon Valley | 34.13% | 14.29%(+19.8)#36 | 4.93%(+29.2)#182 |
| 37. | Ramtown | 34.03% | 14.29%(+19.7)#37 | 4.93%(+29.1)#185 |
| 38. | Laurel Heights | 33.82% | 14.29%(+19.5)#38 | 4.93%(+28.9)#189 |
| 39. | Oceanport Borough | 33.81% | 14.29%(+19.5)#39 | 4.93%(+28.9)#190 |
| 40. | Hamilton Square | 33.75% | 14.29%(+19.5)#40 | 4.93%(+28.8)#192 |
| 41. | Navesink | 33.64% | 14.29%(+19.4)#41 | 4.93%(+28.7)#196 |
| 42. | Tavistock Borough | 33.33% | 14.29%(+19.0)#42 | 4.93%(+28.4)#204 |
| 43. | South Dennis | 33.24% | 14.29%(+18.9)#43 | 4.93%(+28.3)#207 |
| 44. | Longport Borough | 32.60% | 14.29%(+18.3)#44 | 4.93%(+27.7)#224 |
| 45. | Stanhope Borough | 32.55% | 14.29%(+18.3)#45 | 4.93%(+27.6)#227 |
| 46. | Holiday City Berkeley | 32.46% | 14.29%(+18.2)#46 | 4.93%(+27.5)#228 |
| 47. | Renaissance At Monroe | 32.27% | 14.29%(+18.0)#47 | 4.93%(+27.3)#232 |
| 48. | Montclair State University | 32.09% | 14.29%(+17.8)#48 | 4.93%(+27.2)#235 |
| 49. | West Freehold | 31.73% | 14.29%(+17.4)#49 | 4.93%(+26.8)#241 |
| 50. | Vienna | 31.72% | 14.29%(+17.4)#50 | 4.93%(+26.8)#242 |
| 51. | Landing | 31.68% | 14.29%(+17.4)#51 | 4.93%(+26.8)#245 |
| 52. | Windsor | 31.40% | 14.29%(+17.1)#52 | 4.93%(+26.5)#254 |
| 53. | North Caldwell Borough | 31.11% | 14.29%(+16.8)#53 | 4.93%(+26.2)#259 |
| 54. | English Creek | 30.91% | 14.29%(+16.6)#54 | 4.93%(+26.0)#263 |
| 55. | East Vineland | 30.83% | 14.29%(+16.5)#55 | 4.93%(+25.9)#266 |
| 56. | East Freehold | 30.72% | 14.29%(+16.4)#56 | 4.93%(+25.8)#270 |
| 57. | Mountain Lakes Borough | 30.47% | 14.29%(+16.2)#57 | 4.93%(+25.5)#278 |
| 58. | Leisure Village East | 30.39% | 14.29%(+16.1)#58 | 4.93%(+25.5)#285 |
| 59. | Mount Royal | 30.34% | 14.29%(+16.0)#59 | 4.93%(+25.4)#287 |
| 60. | Seaville | 30.29% | 14.29%(+16.0)#60 | 4.93%(+25.4)#291 |
| 61. | Newfield Borough | 30.22% | 14.29%(+15.9)#61 | 4.93%(+25.3)#295 |
| 62. | Park Ridge Borough | 30.17% | 14.29%(+15.9)#62 | 4.93%(+25.2)#298 |
| 63. | Money Island | 30.00% | 14.29%(+15.7)#63 | 4.93%(+25.1)#305 |
| 64. | Holiday City South | 29.76% | 14.29%(+15.5)#64 | 4.93%(+24.8)#313 |
| 65. | Branchville Borough | 29.66% | 14.29%(+15.4)#65 | 4.93%(+24.7)#318 |
| 66. | Packanack Lake | 29.62% | 14.29%(+15.3)#66 | 4.93%(+24.7)#319 |
| 67. | Strathmore | 29.48% | 14.29%(+15.2)#67 | 4.93%(+24.5)#323 |
| 68. | Oak Ridge | 29.42% | 14.29%(+15.1)#68 | 4.93%(+24.5)#327 |
| 69. | Fairview | 29.38% | 14.29%(+15.1)#69 | 4.93%(+24.5)#329 |
| 70. | Manahawkin | 29.27% | 14.29%(+15.0)#70 | 4.93%(+24.3)#331 |
| 71. | Hillsdale Borough | 29.24% | 14.29%(+15.0)#71 | 4.93%(+24.3)#333 |
| 72. | Dover Beaches North | 29.19% | 14.29%(+14.9)#72 | 4.93%(+24.3)#336 |
| 73. | Mount Hope | 29.08% | 14.29%(+14.8)#73 | 4.93%(+24.1)#339 |
| 74. | Wildwood Crest Borough | 29.03% | 14.29%(+14.7)#74 | 4.93%(+24.1)#341 |
| 75. | Clyde | 28.95% | 14.29%(+14.7)#75 | 4.93%(+24.0)#348 |
| 76. | Yardville | 28.76% | 14.29%(+14.5)#76 | 4.93%(+23.8)#360 |
| 77. | Kinnelon Borough | 28.69% | 14.29%(+14.4)#77 | 4.93%(+23.8)#362 |
| 78. | Highlands Borough | 28.63% | 14.29%(+14.3)#78 | 4.93%(+23.7)#364 |
| 79. | Flanders | 28.56% | 14.29%(+14.3)#79 | 4.93%(+23.6)#367 |
| 80. | West Long Branch Borough | 28.54% | 14.29%(+14.2)#80 | 4.93%(+23.6)#369 |
| 81. | Richwood | 28.42% | 14.29%(+14.1)#81 | 4.93%(+23.5)#371 |
| 82. | Rumson Borough | 28.37% | 14.29%(+14.1)#82 | 4.93%(+23.4)#373 |
| 83. | Blackwood | 28.36% | 14.29%(+14.1)#83 | 4.93%(+23.4)#374 |
| 84. | Kenvil | 28.24% | 14.29%(+13.9)#84 | 4.93%(+23.3)#382 |
| 85. | New Egypt | 28.16% | 14.29%(+13.9)#85 | 4.93%(+23.2)#386 |
| 86. | Dennisville | 28.16% | 14.29%(+13.9)#86 | 4.93%(+23.2)#387 |
| 87. | Rosenhayn | 28.12% | 14.29%(+13.8)#87 | 4.93%(+23.2)#391 |
| 88. | Cream Ridge | 28.09% | 14.29%(+13.8)#88 | 4.93%(+23.2)#393 |
| 89. | Pompton Plains | 28.07% | 14.29%(+13.8)#89 | 4.93%(+23.1)#395 |
| 90. | Leisure Knoll | 28.03% | 14.29%(+13.7)#90 | 4.93%(+23.1)#397 |
| 91. | Margate City | 27.87% | 14.29%(+13.6)#91 | 4.93%(+22.9)#408 |
| 92. | Mount Arlington Borough | 27.80% | 14.29%(+13.5)#92 | 4.93%(+22.9)#411 |
| 93. | Brielle Borough | 27.70% | 14.29%(+13.4)#93 | 4.93%(+22.8)#421 |
| 94. | Interlaken Borough | 27.69% | 14.29%(+13.4)#94 | 4.93%(+22.8)#422 |
| 95. | Essex Fells Borough | 27.64% | 14.29%(+13.4)#95 | 4.93%(+22.7)#424 |
| 96. | Whippany | 27.59% | 14.29%(+13.3)#96 | 4.93%(+22.7)#426 |
| 97. | Union Beach Borough | 27.54% | 14.29%(+13.3)#97 | 4.93%(+22.6)#428 |
| 98. | Succasunna | 27.53% | 14.29%(+13.2)#98 | 4.93%(+22.6)#432 |
| 99. | Ocean View | 27.51% | 14.29%(+13.2)#99 | 4.93%(+22.6)#434 |
| 100. | Seeley | 27.50% | 14.29%(+13.2)#100 | 4.93%(+22.6)#435 |
Common Questions
What are the Top 10 Cities with the Highest Percentage of Italian Population in New Jersey?
Top 10 Cities with the Highest Percentage of Italian Population in New Jersey are:
#1
100.00%
#2
52.90%
#3
47.96%
#4
47.30%
#5
46.51%
#6
45.72%
#7
44.77%
#8
42.44%
#9
40.08%
#10
38.64%
What city has the Highest Percentage of Italian Population in New Jersey?
Ross Corner has the Highest Percentage of Italian Population in New Jersey with 100.00%.
What is the Percentage of Italian Population in the State of New Jersey?
Percentage of Italian Population in New Jersey is 14.29%.
What is the Percentage of Italian Population in the United States?
Percentage of Italian Population in the United States is 4.93%.