Cities with the Highest Percentage of Population Carpooling to Work in New Jersey
RELATED REPORTS & OPTIONS
Drive | Carpool
New Jersey
Compare Cities
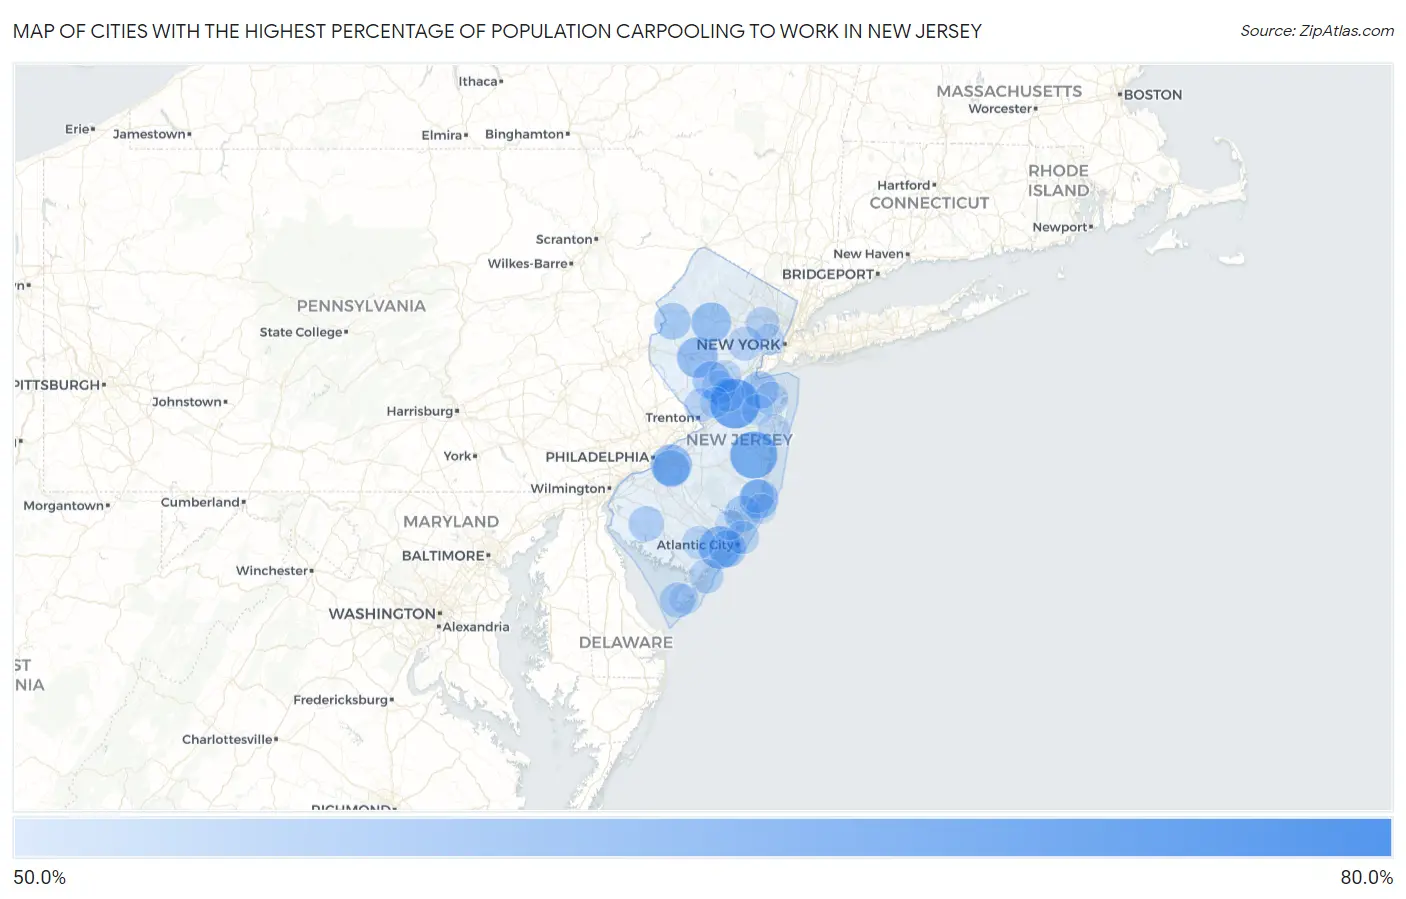
Map of Cities with the Highest Percentage of Population Carpooling to Work in New Jersey
0.0%
80.0%
Cities with the Highest Percentage of Population Carpooling to Work in New Jersey
| City | % Carpool | vs State | vs National | |
| 1. | Stone Harbor Borough | 72.5% | 40.8%(+31.7)#1 | 38.2%(+34.3)#37 |
| 2. | Cedar Knolls | 69.4% | 40.8%(+28.6)#2 | 38.2%(+31.2)#62 |
| 3. | Silver Lake Cdp Warren County | 67.4% | 40.8%(+26.6)#3 | 38.2%(+29.2)#100 |
| 4. | Concordia | 66.2% | 40.8%(+25.4)#4 | 38.2%(+28.0)#126 |
| 5. | Barrington Borough | 65.1% | 40.8%(+24.3)#5 | 38.2%(+26.9)#153 |
| 6. | Holiday City Berkeley | 64.3% | 40.8%(+23.5)#6 | 38.2%(+26.1)#176 |
| 7. | Wenonah Borough | 63.8% | 40.8%(+23.0)#7 | 38.2%(+25.6)#204 |
| 8. | Essex Fells Borough | 63.2% | 40.8%(+22.4)#8 | 38.2%(+25.0)#231 |
| 9. | Hewitt | 62.5% | 40.8%(+21.7)#9 | 38.2%(+24.3)#268 |
| 10. | Woodland Park Borough | 62.2% | 40.8%(+21.4)#10 | 38.2%(+24.0)#302 |
| 11. | Penns Grove Borough | 62.2% | 40.8%(+21.4)#11 | 38.2%(+24.0)#303 |
| 12. | Rockaway Borough | 61.6% | 40.8%(+20.8)#12 | 38.2%(+23.4)#337 |
| 13. | Troy Hills | 61.0% | 40.8%(+20.2)#13 | 38.2%(+22.8)#415 |
| 14. | Saddle River Borough | 60.7% | 40.8%(+19.9)#14 | 38.2%(+22.5)#435 |
| 15. | Linwood | 60.6% | 40.8%(+19.8)#15 | 38.2%(+22.4)#438 |
| 16. | Oceanport Borough | 60.1% | 40.8%(+19.3)#16 | 38.2%(+21.9)#521 |
| 17. | Monmouth Beach Borough | 60.1% | 40.8%(+19.3)#17 | 38.2%(+21.9)#524 |
| 18. | Sea Bright Borough | 60.1% | 40.8%(+19.3)#18 | 38.2%(+21.9)#528 |
| 19. | Barclay | 59.4% | 40.8%(+18.6)#19 | 38.2%(+21.2)#604 |
| 20. | Ramsey Borough | 59.2% | 40.8%(+18.4)#20 | 38.2%(+21.0)#643 |
| 21. | Seaside Park Borough | 59.1% | 40.8%(+18.3)#21 | 38.2%(+20.9)#661 |
| 22. | White House Station | 59.0% | 40.8%(+18.2)#22 | 38.2%(+20.8)#670 |
| 23. | Englewood Cliffs Borough | 58.7% | 40.8%(+17.9)#23 | 38.2%(+20.5)#691 |
| 24. | Harrington Park Borough | 58.5% | 40.8%(+17.7)#24 | 38.2%(+20.3)#709 |
| 25. | Allendale Borough | 58.3% | 40.8%(+17.5)#25 | 38.2%(+20.1)#746 |
| 26. | Interlaken Borough | 58.3% | 40.8%(+17.5)#26 | 38.2%(+20.1)#769 |
| 27. | Succasunna | 58.2% | 40.8%(+17.4)#27 | 38.2%(+20.0)#782 |
| 28. | Beach Haven West | 57.9% | 40.8%(+17.1)#28 | 38.2%(+19.7)#826 |
| 29. | Jamesburg Borough | 57.6% | 40.8%(+16.8)#29 | 38.2%(+19.4)#852 |
| 30. | Ship Bottom Borough | 56.7% | 40.8%(+15.9)#30 | 38.2%(+18.5)#1,001 |
| 31. | Barnegat Light Borough | 56.7% | 40.8%(+15.9)#31 | 38.2%(+18.5)#1,006 |
| 32. | Audubon Park Borough | 56.5% | 40.8%(+15.7)#32 | 38.2%(+18.3)#1,023 |
| 33. | Belle Mead | 56.3% | 40.8%(+15.5)#33 | 38.2%(+18.1)#1,065 |
| 34. | Strathmore | 56.2% | 40.8%(+15.4)#34 | 38.2%(+18.0)#1,100 |
| 35. | Margate City | 56.1% | 40.8%(+15.3)#35 | 38.2%(+17.9)#1,125 |
| 36. | Ashland | 56.0% | 40.8%(+15.2)#36 | 38.2%(+17.8)#1,150 |
| 37. | Mountain Lake | 55.6% | 40.8%(+14.8)#37 | 38.2%(+17.4)#1,219 |
| 38. | Peapack And Gladstone Borough | 55.5% | 40.8%(+14.7)#38 | 38.2%(+17.3)#1,231 |
| 39. | Mystic Island | 55.4% | 40.8%(+14.6)#39 | 38.2%(+17.2)#1,266 |
| 40. | Demarest Borough | 55.3% | 40.8%(+14.5)#40 | 38.2%(+17.1)#1,279 |
| 41. | Milltown Borough | 55.1% | 40.8%(+14.3)#41 | 38.2%(+16.9)#1,331 |
| 42. | Haddon Heights Borough | 54.9% | 40.8%(+14.1)#42 | 38.2%(+16.7)#1,375 |
| 43. | Seabrook Farms | 54.6% | 40.8%(+13.8)#43 | 38.2%(+16.4)#1,436 |
| 44. | Point Pleasant Beach Borough | 54.5% | 40.8%(+13.7)#44 | 38.2%(+16.3)#1,445 |
| 45. | North Cape May | 54.5% | 40.8%(+13.7)#45 | 38.2%(+16.3)#1,450 |
| 46. | Woodbine Borough | 54.4% | 40.8%(+13.6)#46 | 38.2%(+16.2)#1,489 |
| 47. | Maywood Borough | 54.3% | 40.8%(+13.5)#47 | 38.2%(+16.1)#1,502 |
| 48. | Whippany | 54.2% | 40.8%(+13.4)#48 | 38.2%(+16.0)#1,545 |
| 49. | Bridgewater Center | 54.2% | 40.8%(+13.4)#49 | 38.2%(+16.0)#1,546 |
| 50. | Rumson Borough | 54.1% | 40.8%(+13.3)#50 | 38.2%(+15.9)#1,568 |
| 51. | Sea Isle City | 53.9% | 40.8%(+13.1)#51 | 38.2%(+15.7)#1,619 |
| 52. | Bay Head Borough | 53.9% | 40.8%(+13.1)#52 | 38.2%(+15.7)#1,622 |
| 53. | Haworth Borough | 53.8% | 40.8%(+13.0)#53 | 38.2%(+15.6)#1,628 |
| 54. | Ten Mile Run | 53.7% | 40.8%(+12.9)#54 | 38.2%(+15.5)#1,647 |
| 55. | Summit | 53.6% | 40.8%(+12.8)#55 | 38.2%(+15.4)#1,655 |
| 56. | Clayton Borough | 53.5% | 40.8%(+12.7)#56 | 38.2%(+15.3)#1,679 |
| 57. | Dayton | 53.5% | 40.8%(+12.7)#57 | 38.2%(+15.3)#1,680 |
| 58. | Lincroft | 53.5% | 40.8%(+12.7)#58 | 38.2%(+15.3)#1,682 |
| 59. | Upper Montclair | 53.4% | 40.8%(+12.6)#59 | 38.2%(+15.2)#1,725 |
| 60. | Longport Borough | 53.4% | 40.8%(+12.6)#60 | 38.2%(+15.2)#1,744 |
| 61. | Lawrenceville | 53.3% | 40.8%(+12.5)#61 | 38.2%(+15.1)#1,759 |
| 62. | Manahawkin | 53.3% | 40.8%(+12.5)#62 | 38.2%(+15.1)#1,763 |
| 63. | Brigantine | 53.0% | 40.8%(+12.2)#63 | 38.2%(+14.8)#1,836 |
| 64. | Estell Manor | 52.8% | 40.8%(+12.0)#64 | 38.2%(+14.6)#1,879 |
| 65. | Sea Girt Borough | 52.7% | 40.8%(+11.9)#65 | 38.2%(+14.5)#1,904 |
| 66. | Avon By The Sea Borough | 52.7% | 40.8%(+11.9)#66 | 38.2%(+14.5)#1,907 |
| 67. | Woodcliff Lake Borough | 52.5% | 40.8%(+11.7)#67 | 38.2%(+14.3)#1,934 |
| 68. | Island Heights Borough | 52.5% | 40.8%(+11.7)#68 | 38.2%(+14.3)#1,944 |
| 69. | Middlebush | 52.4% | 40.8%(+11.6)#69 | 38.2%(+14.2)#1,974 |
| 70. | Califon Borough | 52.3% | 40.8%(+11.5)#70 | 38.2%(+14.1)#2,008 |
| 71. | Fort Lee Borough | 52.2% | 40.8%(+11.4)#71 | 38.2%(+14.0)#2,030 |
| 72. | Pompton Plains | 52.2% | 40.8%(+11.4)#72 | 38.2%(+14.0)#2,034 |
| 73. | Wood Ridge Borough | 52.2% | 40.8%(+11.4)#73 | 38.2%(+14.0)#2,035 |
| 74. | Allenwood | 52.2% | 40.8%(+11.4)#74 | 38.2%(+14.0)#2,048 |
| 75. | Laurel Springs Borough | 52.1% | 40.8%(+11.3)#75 | 38.2%(+13.9)#2,067 |
| 76. | Paramus Borough | 52.0% | 40.8%(+11.2)#76 | 38.2%(+13.8)#2,087 |
| 77. | Atlantic Highlands Borough | 52.0% | 40.8%(+11.2)#77 | 38.2%(+13.8)#2,091 |
| 78. | Pitman Borough | 51.9% | 40.8%(+11.1)#78 | 38.2%(+13.7)#2,120 |
| 79. | Berlin Borough | 51.7% | 40.8%(+10.9)#79 | 38.2%(+13.5)#2,168 |
| 80. | Franklin Lakes Borough | 51.6% | 40.8%(+10.8)#80 | 38.2%(+13.4)#2,186 |
| 81. | Madison Borough | 51.5% | 40.8%(+10.7)#81 | 38.2%(+13.3)#2,211 |
| 82. | Alpine Borough | 51.5% | 40.8%(+10.7)#82 | 38.2%(+13.3)#2,228 |
| 83. | East Freehold | 51.4% | 40.8%(+10.6)#83 | 38.2%(+13.2)#2,261 |
| 84. | Wildwood Crest Borough | 51.2% | 40.8%(+10.4)#84 | 38.2%(+13.0)#2,343 |
| 85. | Princeton Junction | 51.2% | 40.8%(+10.4)#85 | 38.2%(+13.0)#2,349 |
| 86. | Tenafly Borough | 51.1% | 40.8%(+10.3)#86 | 38.2%(+12.9)#2,363 |
| 87. | Millington | 51.1% | 40.8%(+10.3)#87 | 38.2%(+12.9)#2,380 |
| 88. | Mount Tabor | 51.0% | 40.8%(+10.2)#88 | 38.2%(+12.8)#2,423 |
| 89. | Harrison | 50.7% | 40.8%(+9.90)#89 | 38.2%(+12.5)#2,507 |
| 90. | Leonia Borough | 50.7% | 40.8%(+9.90)#90 | 38.2%(+12.5)#2,509 |
| 91. | Hopelawn | 50.7% | 40.8%(+9.90)#91 | 38.2%(+12.5)#2,517 |
| 92. | Victory Gardens Borough | 50.7% | 40.8%(+9.90)#92 | 38.2%(+12.5)#2,520 |
| 93. | Macopin | 50.6% | 40.8%(+9.80)#93 | 38.2%(+12.4)#2,538 |
| 94. | Keansburg Borough | 50.5% | 40.8%(+9.70)#94 | 38.2%(+12.3)#2,549 |
| 95. | Smithville | 50.5% | 40.8%(+9.70)#95 | 38.2%(+12.3)#2,550 |
| 96. | Keyport Borough | 50.5% | 40.8%(+9.70)#96 | 38.2%(+12.3)#2,553 |
| 97. | Far Hills Borough | 50.5% | 40.8%(+9.70)#97 | 38.2%(+12.3)#2,576 |
| 98. | North Beach Haven | 50.4% | 40.8%(+9.60)#98 | 38.2%(+12.2)#2,638 |
| 99. | Erma | 50.4% | 40.8%(+9.60)#99 | 38.2%(+12.2)#2,640 |
| 100. | Bergenfield Borough | 50.2% | 40.8%(+9.40)#100 | 38.2%(+12.0)#2,714 |
Common Questions
What are the Top 10 Cities with the Highest Percentage of Population Carpooling to Work in New Jersey?
Top 10 Cities with the Highest Percentage of Population Carpooling to Work in New Jersey are:
#1
66.2%
#2
64.3%
#3
60.6%
#4
59.4%
#5
59.0%
#6
58.2%
#7
57.9%
#8
56.3%
#9
56.2%
#10
56.1%
What city has the Highest Percentage of Population Carpooling to Work in New Jersey?
Concordia has the Highest Percentage of Population Carpooling to Work in New Jersey with 66.2%.
What is the Percentage of Population Carpooling to Work in the State of New Jersey?
Percentage of Population Carpooling to Work in New Jersey is 40.8%.
What is the Percentage of Population Carpooling to Work in the United States?
Percentage of Population Carpooling to Work in the United States is 38.2%.