Cities with the Most Immigrants from Serbia in New Jersey
RELATED REPORTS & OPTIONS
Serbia
New Jersey
Compare Cities
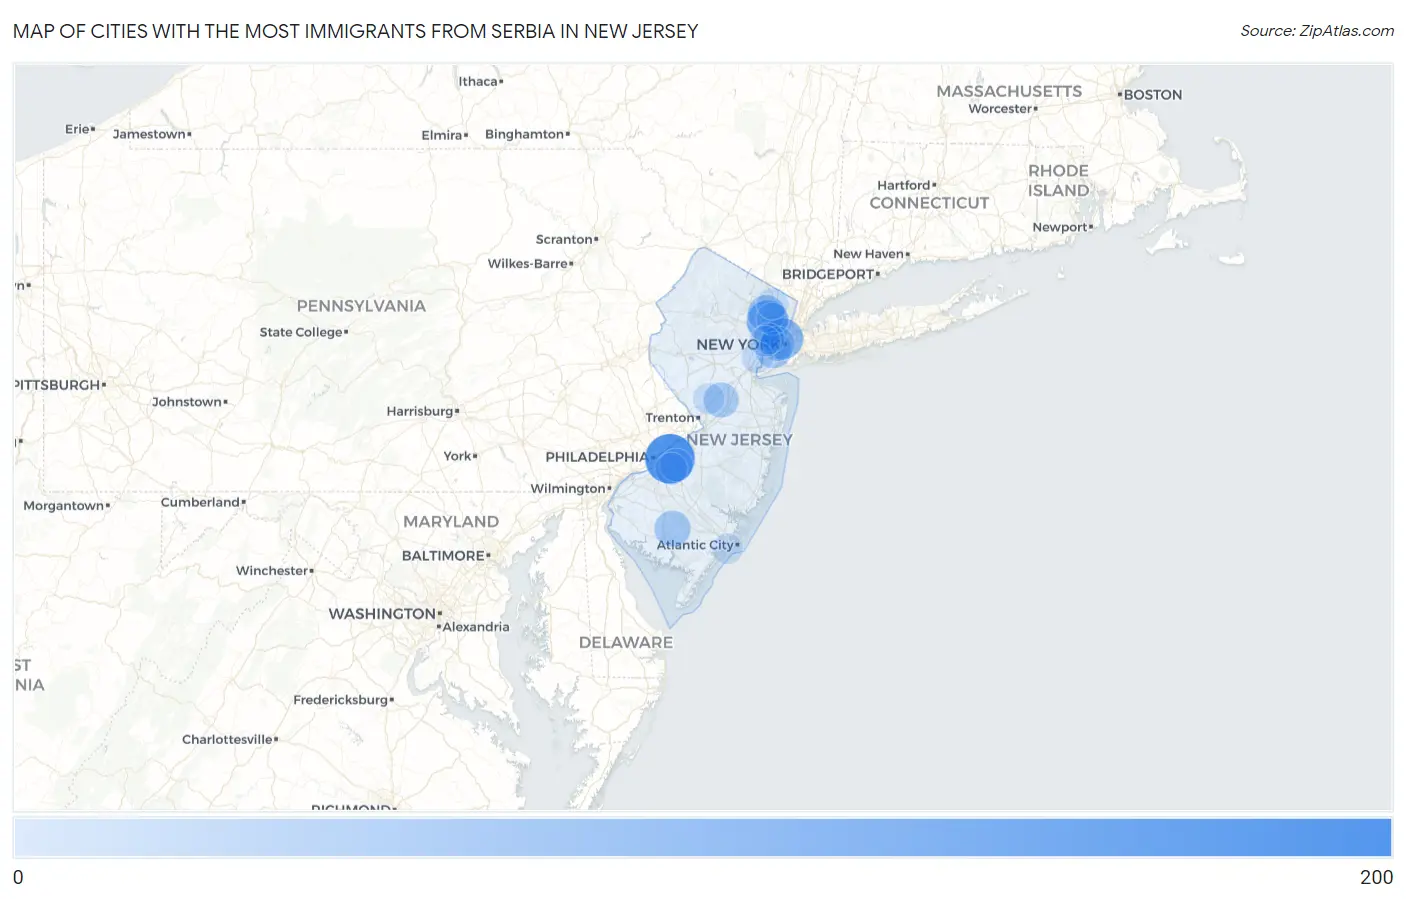
Map of Cities with the Most Immigrants from Serbia in New Jersey
0
200
Cities with the Most Immigrants from Serbia in New Jersey
| City | Serbia | vs State | vs National | |
| 1. | Cherry Hill Mall | 192 | 1,881(10.21%)#1 | 42,332(0.45%)#26 |
| 2. | Clifton | 113 | 1,881(6.01%)#2 | 42,332(0.27%)#56 |
| 3. | Hoboken | 108 | 1,881(5.74%)#3 | 42,332(0.26%)#59 |
| 4. | Wallington Borough | 80 | 1,881(4.25%)#4 | 42,332(0.19%)#86 |
| 5. | Paterson | 69 | 1,881(3.67%)#5 | 42,332(0.16%)#107 |
| 6. | Bayonne | 59 | 1,881(3.14%)#6 | 42,332(0.14%)#133 |
| 7. | Vineland | 58 | 1,881(3.08%)#7 | 42,332(0.14%)#139 |
| 8. | Lodi Borough | 52 | 1,881(2.76%)#8 | 42,332(0.12%)#156 |
| 9. | Hillsdale Borough | 51 | 1,881(2.71%)#9 | 42,332(0.12%)#163 |
| 10. | Princeton Meadows | 48 | 1,881(2.55%)#10 | 42,332(0.11%)#175 |
| 11. | Jersey City | 41 | 1,881(2.18%)#11 | 42,332(0.10%)#211 |
| 12. | Butler Borough | 35 | 1,881(1.86%)#12 | 42,332(0.08%)#244 |
| 13. | Cliffside Park Borough | 29 | 1,881(1.54%)#13 | 42,332(0.07%)#286 |
| 14. | Greentree | 25 | 1,881(1.33%)#14 | 42,332(0.06%)#328 |
| 15. | Bound Brook Borough | 23 | 1,881(1.22%)#15 | 42,332(0.05%)#351 |
| 16. | Ringwood Borough | 22 | 1,881(1.17%)#16 | 42,332(0.05%)#362 |
| 17. | Garfield | 19 | 1,881(1.01%)#17 | 42,332(0.04%)#403 |
| 18. | Ashland | 19 | 1,881(1.01%)#18 | 42,332(0.04%)#409 |
| 19. | Linden | 15 | 1,881(0.80%)#19 | 42,332(0.04%)#470 |
| 20. | Roselle Park Borough | 15 | 1,881(0.80%)#20 | 42,332(0.04%)#475 |
| 21. | Wanaque Borough | 15 | 1,881(0.80%)#21 | 42,332(0.04%)#476 |
| 22. | Bargaintown | 15 | 1,881(0.80%)#22 | 42,332(0.04%)#478 |
| 23. | Ridgewood | 14 | 1,881(0.74%)#23 | 42,332(0.03%)#492 |
| 24. | Fort Lee Borough | 13 | 1,881(0.69%)#24 | 42,332(0.03%)#511 |
| 25. | Palisades Park Borough | 12 | 1,881(0.64%)#25 | 42,332(0.03%)#534 |
| 26. | Princeton | 11 | 1,881(0.58%)#26 | 42,332(0.03%)#547 |
| 27. | Harrison | 7 | 1,881(0.37%)#27 | 42,332(0.02%)#672 |
| 28. | Kean University | 7 | 1,881(0.37%)#28 | 42,332(0.02%)#682 |
| 29. | Newark | 6 | 1,881(0.32%)#29 | 42,332(0.01%)#685 |
| 30. | Margate City | 5 | 1,881(0.27%)#30 | 42,332(0.01%)#722 |
| 31. | Allenhurst Borough | 2 | 1,881(0.11%)#31 | 42,332(0.00%)#769 |
Common Questions
What are the Top 10 Cities with the Most Immigrants from Serbia in New Jersey?
Top 10 Cities with the Most Immigrants from Serbia in New Jersey are:
#1
192
#2
113
#3
108
#4
69
#5
59
#6
58
#7
48
#8
41
#9
25
#10
19
What city has the Most Immigrants from Serbia in New Jersey?
Cherry Hill Mall has the Most Immigrants from Serbia in New Jersey with 192.
What is the Total Immigrants from Serbia in the State of New Jersey?
Total Immigrants from Serbia in New Jersey is 1,881.
What is the Total Immigrants from Serbia in the United States?
Total Immigrants from Serbia in the United States is 42,332.