Cities with the Highest Percentage of Polish Population in New Jersey
RELATED REPORTS & OPTIONS
Polish
New Jersey
Compare Cities
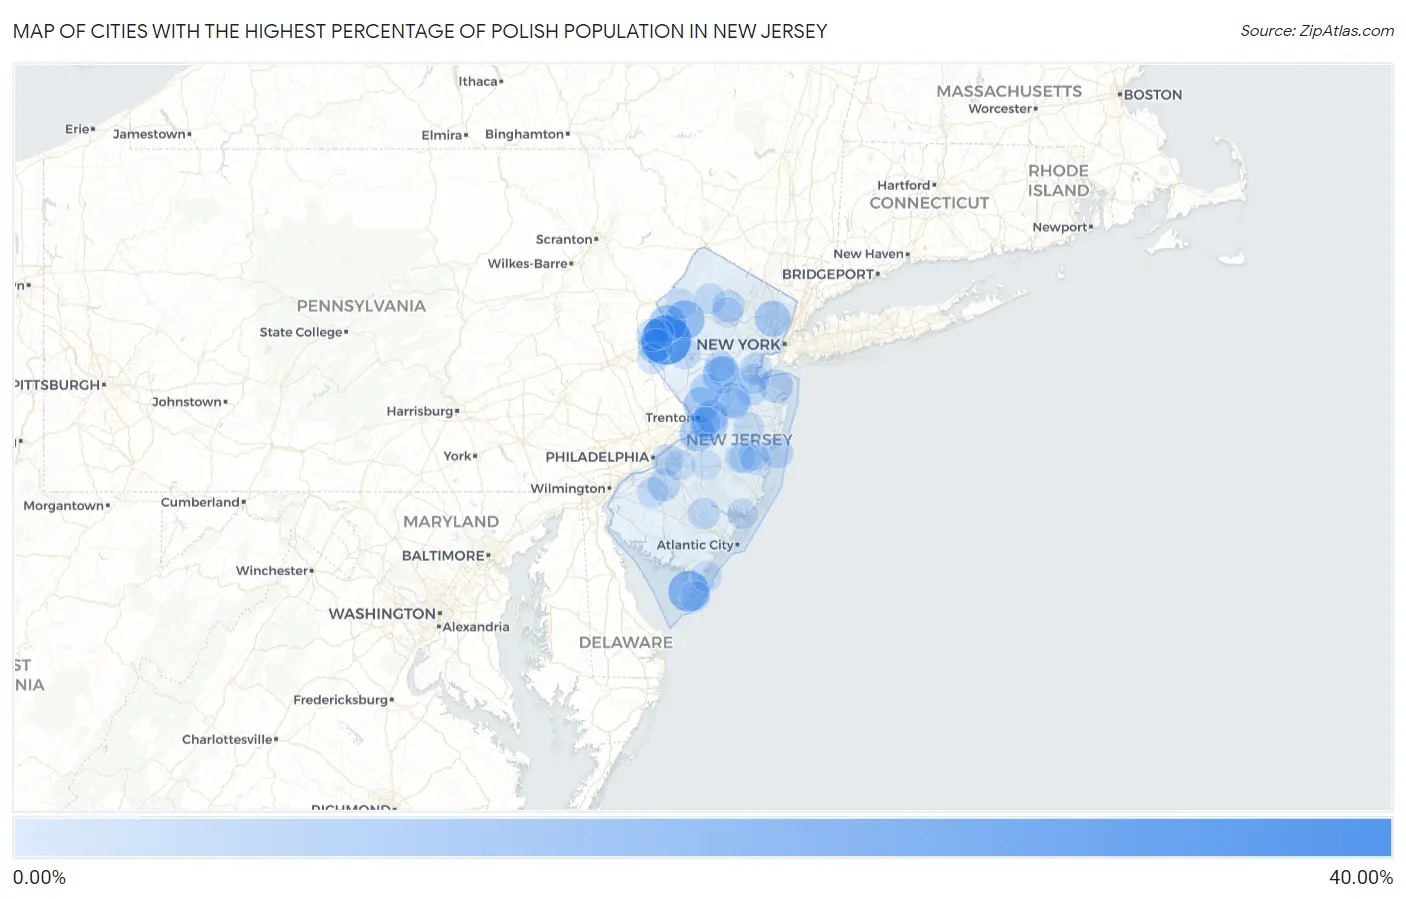
Map of Cities with the Highest Percentage of Polish Population in New Jersey
0.00%
40.00%
Cities with the Highest Percentage of Polish Population in New Jersey
| City | Polish | vs State | vs National | |
| 1. | Wallington Borough | 37.12% | 4.98%(+32.1)#1 | 2.61%(+34.5)#60 |
| 2. | Broadway | 32.43% | 4.98%(+27.5)#2 | 2.61%(+29.8)#88 |
| 3. | Cape May Point Borough | 27.10% | 4.98%(+22.1)#3 | 2.61%(+24.5)#149 |
| 4. | Crosswicks | 25.74% | 4.98%(+20.8)#4 | 2.61%(+23.1)#180 |
| 5. | Burleigh | 22.36% | 4.98%(+17.4)#5 | 2.61%(+19.7)#268 |
| 6. | Dorchester | 22.09% | 4.98%(+17.1)#6 | 2.61%(+19.5)#276 |
| 7. | Richland | 21.62% | 4.98%(+16.6)#7 | 2.61%(+19.0)#292 |
| 8. | Vienna | 20.10% | 4.98%(+15.1)#8 | 2.61%(+17.5)#339 |
| 9. | Germania | 18.44% | 4.98%(+13.5)#9 | 2.61%(+15.8)#416 |
| 10. | Bridgeville | 18.29% | 4.98%(+13.3)#10 | 2.61%(+15.7)#423 |
| 11. | East Millstone | 17.74% | 4.98%(+12.8)#11 | 2.61%(+15.1)#449 |
| 12. | Gandys Beach | 16.67% | 4.98%(+11.7)#12 | 2.61%(+14.1)#538 |
| 13. | Yardville | 16.66% | 4.98%(+11.7)#13 | 2.61%(+14.0)#542 |
| 14. | Roebling | 16.50% | 4.98%(+11.5)#14 | 2.61%(+13.9)#552 |
| 15. | Garfield | 16.40% | 4.98%(+11.4)#15 | 2.61%(+13.8)#562 |
| 16. | Manville Borough | 16.39% | 4.98%(+11.4)#16 | 2.61%(+13.8)#564 |
| 17. | Lawrenceville | 16.39% | 4.98%(+11.4)#17 | 2.61%(+13.8)#565 |
| 18. | Rossmoor | 15.51% | 4.98%(+10.5)#18 | 2.61%(+12.9)#647 |
| 19. | Renaissance At Monroe | 15.48% | 4.98%(+10.5)#19 | 2.61%(+12.9)#650 |
| 20. | Spotswood Borough | 15.30% | 4.98%(+10.3)#20 | 2.61%(+12.7)#667 |
| 21. | Regency At Monroe | 15.05% | 4.98%(+10.1)#21 | 2.61%(+12.4)#690 |
| 22. | Fortescue | 14.94% | 4.98%(+9.97)#22 | 2.61%(+12.3)#706 |
| 23. | Ringoes | 14.78% | 4.98%(+9.81)#23 | 2.61%(+12.2)#724 |
| 24. | Atlantic Highlands Borough | 14.52% | 4.98%(+9.54)#24 | 2.61%(+11.9)#748 |
| 25. | Lopatcong Overlook | 14.48% | 4.98%(+9.51)#25 | 2.61%(+11.9)#757 |
| 26. | Fieldsboro Borough | 14.48% | 4.98%(+9.50)#26 | 2.61%(+11.9)#759 |
| 27. | Flagtown | 13.86% | 4.98%(+8.89)#27 | 2.61%(+11.3)#851 |
| 28. | Belford | 13.80% | 4.98%(+8.82)#28 | 2.61%(+11.2)#857 |
| 29. | Hamilton Square | 13.58% | 4.98%(+8.60)#29 | 2.61%(+11.0)#885 |
| 30. | Bridgewater Center | 13.36% | 4.98%(+8.39)#30 | 2.61%(+10.8)#907 |
| 31. | Barnegat Light Borough | 13.33% | 4.98%(+8.36)#31 | 2.61%(+10.7)#914 |
| 32. | Helmetta Borough | 13.25% | 4.98%(+8.27)#32 | 2.61%(+10.6)#928 |
| 33. | Upper Stewartsville | 12.79% | 4.98%(+7.81)#33 | 2.61%(+10.2)#994 |
| 34. | Ocean Gate Borough | 12.66% | 4.98%(+7.69)#34 | 2.61%(+10.1)#1,012 |
| 35. | Brainards | 12.65% | 4.98%(+7.67)#35 | 2.61%(+10.0)#1,015 |
| 36. | Pines Lake | 12.62% | 4.98%(+7.65)#36 | 2.61%(+10.0)#1,021 |
| 37. | Cumberland-Hesstown | 12.56% | 4.98%(+7.58)#37 | 2.61%(+9.95)#1,037 |
| 38. | Blawenburg | 12.50% | 4.98%(+7.52)#38 | 2.61%(+9.89)#1,050 |
| 39. | Turnersville | 12.45% | 4.98%(+7.47)#39 | 2.61%(+9.83)#1,062 |
| 40. | Sewaren | 12.36% | 4.98%(+7.38)#40 | 2.61%(+9.74)#1,080 |
| 41. | Glen Gardner Borough | 12.30% | 4.98%(+7.32)#41 | 2.61%(+9.69)#1,090 |
| 42. | Liberty Corner | 12.28% | 4.98%(+7.30)#42 | 2.61%(+9.67)#1,097 |
| 43. | Netcong Borough | 12.26% | 4.98%(+7.28)#43 | 2.61%(+9.64)#1,100 |
| 44. | Lake Telemark | 12.22% | 4.98%(+7.24)#44 | 2.61%(+9.61)#1,104 |
| 45. | New Gretna | 12.12% | 4.98%(+7.14)#45 | 2.61%(+9.51)#1,128 |
| 46. | Franklin Lakes Borough | 12.03% | 4.98%(+7.05)#46 | 2.61%(+9.42)#1,149 |
| 47. | Crestwood Village | 11.91% | 4.98%(+6.94)#47 | 2.61%(+9.30)#1,177 |
| 48. | Elwood | 11.86% | 4.98%(+6.88)#48 | 2.61%(+9.25)#1,188 |
| 49. | Golden Triangle | 11.83% | 4.98%(+6.86)#49 | 2.61%(+9.22)#1,193 |
| 50. | Dover Beaches North | 11.79% | 4.98%(+6.82)#50 | 2.61%(+9.18)#1,201 |
| 51. | Brownville | 11.77% | 4.98%(+6.80)#51 | 2.61%(+9.16)#1,203 |
| 52. | Sheppards Mill | 11.39% | 4.98%(+6.42)#52 | 2.61%(+8.78)#1,297 |
| 53. | Concordia | 11.33% | 4.98%(+6.35)#53 | 2.61%(+8.72)#1,309 |
| 54. | Annandale | 11.28% | 4.98%(+6.30)#54 | 2.61%(+8.67)#1,320 |
| 55. | Milltown Borough | 11.27% | 4.98%(+6.30)#55 | 2.61%(+8.66)#1,322 |
| 56. | Franklin Center | 11.25% | 4.98%(+6.27)#56 | 2.61%(+8.64)#1,330 |
| 57. | Lake Mohawk | 11.23% | 4.98%(+6.26)#57 | 2.61%(+8.62)#1,334 |
| 58. | Neshanic Station | 11.19% | 4.98%(+6.21)#58 | 2.61%(+8.58)#1,343 |
| 59. | Union Beach Borough | 11.15% | 4.98%(+6.17)#59 | 2.61%(+8.53)#1,356 |
| 60. | Allentown Borough | 11.12% | 4.98%(+6.14)#60 | 2.61%(+8.51)#1,359 |
| 61. | Richwood | 11.05% | 4.98%(+6.07)#61 | 2.61%(+8.44)#1,378 |
| 62. | White Horse | 11.04% | 4.98%(+6.06)#62 | 2.61%(+8.43)#1,382 |
| 63. | Connecticut Farms | 10.93% | 4.98%(+5.96)#63 | 2.61%(+8.32)#1,406 |
| 64. | Finderne | 10.93% | 4.98%(+5.96)#64 | 2.61%(+8.32)#1,407 |
| 65. | Sayreville Borough | 10.92% | 4.98%(+5.95)#65 | 2.61%(+8.31)#1,410 |
| 66. | Sea Isle City | 10.89% | 4.98%(+5.92)#66 | 2.61%(+8.28)#1,413 |
| 67. | South Amboy | 10.85% | 4.98%(+5.87)#67 | 2.61%(+8.24)#1,425 |
| 68. | Lakehurst Borough | 10.74% | 4.98%(+5.77)#68 | 2.61%(+8.13)#1,451 |
| 69. | White Meadow Lake | 10.73% | 4.98%(+5.76)#69 | 2.61%(+8.12)#1,456 |
| 70. | The Ponds | 10.69% | 4.98%(+5.71)#70 | 2.61%(+8.08)#1,467 |
| 71. | Mystic Island | 10.67% | 4.98%(+5.70)#71 | 2.61%(+8.06)#1,471 |
| 72. | Marlton | 10.63% | 4.98%(+5.66)#72 | 2.61%(+8.02)#1,486 |
| 73. | Millstone Borough | 10.62% | 4.98%(+5.64)#73 | 2.61%(+8.01)#1,491 |
| 74. | Vista Center | 10.58% | 4.98%(+5.61)#74 | 2.61%(+7.97)#1,503 |
| 75. | Finesville | 10.57% | 4.98%(+5.60)#75 | 2.61%(+7.96)#1,504 |
| 76. | Beachwood Borough | 10.54% | 4.98%(+5.56)#76 | 2.61%(+7.93)#1,513 |
| 77. | Holiday City Berkeley | 10.51% | 4.98%(+5.53)#77 | 2.61%(+7.90)#1,520 |
| 78. | North Wildwood | 10.50% | 4.98%(+5.52)#78 | 2.61%(+7.89)#1,522 |
| 79. | Franklinville | 10.49% | 4.98%(+5.51)#79 | 2.61%(+7.88)#1,523 |
| 80. | Ship Bottom Borough | 10.45% | 4.98%(+5.48)#80 | 2.61%(+7.84)#1,532 |
| 81. | Hutchinson | 10.43% | 4.98%(+5.46)#81 | 2.61%(+7.82)#1,536 |
| 82. | Marksboro | 10.30% | 4.98%(+5.33)#82 | 2.61%(+7.69)#1,574 |
| 83. | Mount Ephraim Borough | 10.28% | 4.98%(+5.31)#83 | 2.61%(+7.67)#1,581 |
| 84. | Belmar Borough | 10.28% | 4.98%(+5.30)#84 | 2.61%(+7.67)#1,584 |
| 85. | Holiday Heights | 10.25% | 4.98%(+5.27)#85 | 2.61%(+7.64)#1,593 |
| 86. | Carlstadt Borough | 10.20% | 4.98%(+5.23)#86 | 2.61%(+7.59)#1,612 |
| 87. | Morris Plains Borough | 10.09% | 4.98%(+5.12)#87 | 2.61%(+7.48)#1,638 |
| 88. | Cedar Glen Lakes | 10.06% | 4.98%(+5.09)#88 | 2.61%(+7.45)#1,644 |
| 89. | Folsom Borough | 10.05% | 4.98%(+5.07)#89 | 2.61%(+7.44)#1,652 |
| 90. | Oaklyn Borough | 10.03% | 4.98%(+5.06)#90 | 2.61%(+7.42)#1,656 |
| 91. | Cranford | 10.01% | 4.98%(+5.04)#91 | 2.61%(+7.40)#1,663 |
| 92. | Washington Crossing | 9.94% | 4.98%(+4.96)#92 | 2.61%(+7.32)#1,679 |
| 93. | Montclair State University | 9.92% | 4.98%(+4.94)#93 | 2.61%(+7.31)#1,688 |
| 94. | Great Notch | 9.88% | 4.98%(+4.90)#94 | 2.61%(+7.27)#1,699 |
| 95. | Stirling | 9.88% | 4.98%(+4.90)#95 | 2.61%(+7.27)#1,700 |
| 96. | Whippany | 9.88% | 4.98%(+4.90)#96 | 2.61%(+7.27)#1,701 |
| 97. | Hillsborough | 9.87% | 4.98%(+4.90)#97 | 2.61%(+7.26)#1,702 |
| 98. | Avon By The Sea Borough | 9.82% | 4.98%(+4.85)#98 | 2.61%(+7.21)#1,722 |
| 99. | Bradley Beach Borough | 9.82% | 4.98%(+4.84)#99 | 2.61%(+7.21)#1,723 |
| 100. | Leisuretowne | 9.72% | 4.98%(+4.74)#100 | 2.61%(+7.11)#1,755 |
Common Questions
What are the Top 10 Cities with the Highest Percentage of Polish Population in New Jersey?
Top 10 Cities with the Highest Percentage of Polish Population in New Jersey are:
#1
32.43%
#2
22.36%
#3
20.10%
#4
18.29%
#5
17.74%
#6
16.66%
#7
16.50%
#8
16.40%
#9
16.39%
#10
15.51%
What city has the Highest Percentage of Polish Population in New Jersey?
Broadway has the Highest Percentage of Polish Population in New Jersey with 32.43%.
What is the Percentage of Polish Population in the State of New Jersey?
Percentage of Polish Population in New Jersey is 4.98%.
What is the Percentage of Polish Population in the United States?
Percentage of Polish Population in the United States is 2.61%.