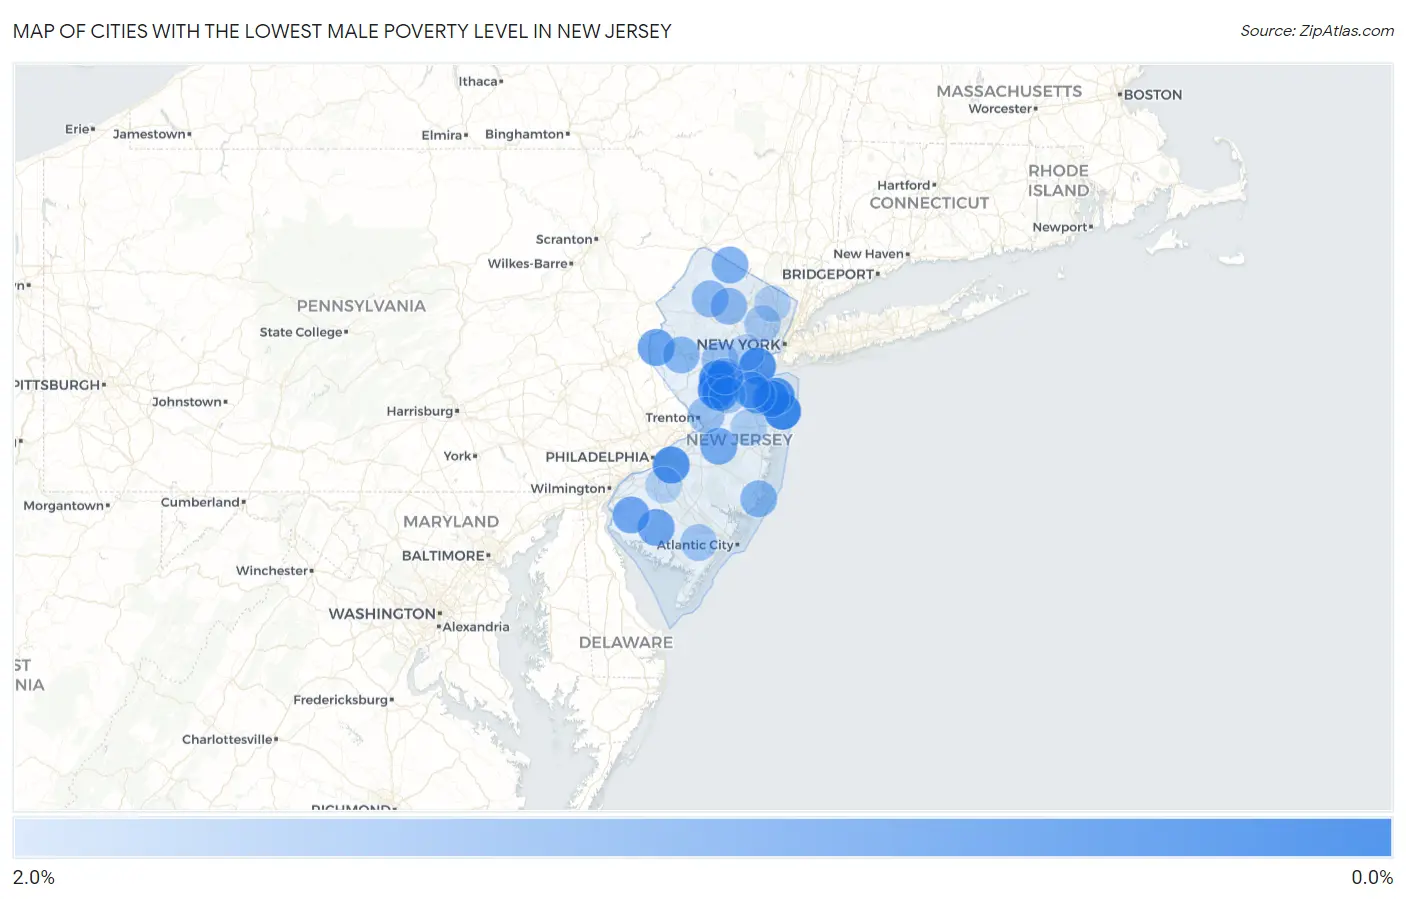
Cities with the Lowest Male Poverty Level in New Jersey
RELATED REPORTS & OPTIONS
Lowest Poverty | Male
New Jersey
Compare Cities
Map of Cities with the Lowest Male Poverty Level in New Jersey
2.0%
0.0%
Cities with the Lowest Male Poverty Level in New Jersey
| City | Male Poverty | vs State | vs National | |
| 1. | Hopelawn | 0.066% | 8.6%(-8.54)#1 | 11.3%(-11.3)#3 |
| 2. | Ho Ho Kus Borough | 0.14% | 8.6%(-8.47)#2 | 11.3%(-11.2)#17 |
| 3. | Bedminster | 0.15% | 8.6%(-8.45)#3 | 11.3%(-11.2)#21 |
| 4. | Oakhurst | 0.16% | 8.6%(-8.45)#4 | 11.3%(-11.2)#22 |
| 5. | Sea Girt Borough | 0.19% | 8.6%(-8.42)#5 | 11.3%(-11.1)#30 |
| 6. | Hewitt | 0.22% | 8.6%(-8.38)#6 | 11.3%(-11.1)#35 |
| 7. | Mountain Lakes Borough | 0.34% | 8.6%(-8.27)#7 | 11.3%(-11.0)#66 |
| 8. | Packanack Lake | 0.36% | 8.6%(-8.25)#8 | 11.3%(-11.0)#73 |
| 9. | Great Notch | 0.38% | 8.6%(-8.23)#9 | 11.3%(-11.0)#80 |
| 10. | Island Heights Borough | 0.41% | 8.6%(-8.20)#10 | 11.3%(-10.9)#97 |
| 11. | Port Reading | 0.43% | 8.6%(-8.18)#11 | 11.3%(-10.9)#107 |
| 12. | Medford Lakes Borough | 0.43% | 8.6%(-8.18)#12 | 11.3%(-10.9)#111 |
| 13. | Griggstown | 0.44% | 8.6%(-8.17)#13 | 11.3%(-10.9)#115 |
| 14. | Beesleys Point | 0.45% | 8.6%(-8.16)#14 | 11.3%(-10.9)#120 |
| 15. | Essex Fells Borough | 0.45% | 8.6%(-8.16)#15 | 11.3%(-10.9)#121 |
| 16. | Fairview | 0.45% | 8.6%(-8.15)#16 | 11.3%(-10.9)#124 |
| 17. | Little Silver Borough | 0.48% | 8.6%(-8.13)#17 | 11.3%(-10.9)#133 |
| 18. | Demarest Borough | 0.49% | 8.6%(-8.12)#18 | 11.3%(-10.9)#138 |
| 19. | Lincroft | 0.49% | 8.6%(-8.12)#19 | 11.3%(-10.9)#139 |
| 20. | Six Mile Run | 0.51% | 8.6%(-8.10)#20 | 11.3%(-10.8)#152 |
| 21. | East Rocky Hill | 0.52% | 8.6%(-8.09)#21 | 11.3%(-10.8)#155 |
| 22. | Barclay | 0.53% | 8.6%(-8.08)#22 | 11.3%(-10.8)#161 |
| 23. | Seaville | 0.56% | 8.6%(-8.05)#23 | 11.3%(-10.8)#170 |
| 24. | Blackwells Mills | 0.56% | 8.6%(-8.05)#24 | 11.3%(-10.8)#172 |
| 25. | Liberty Corner | 0.59% | 8.6%(-8.02)#25 | 11.3%(-10.8)#189 |
| 26. | Heathcote | 0.62% | 8.6%(-7.98)#26 | 11.3%(-10.7)#212 |
| 27. | Cedar Knolls | 0.64% | 8.6%(-7.97)#27 | 11.3%(-10.7)#219 |
| 28. | Fair Haven Borough | 0.67% | 8.6%(-7.94)#28 | 11.3%(-10.7)#242 |
| 29. | Spotswood Borough | 0.69% | 8.6%(-7.92)#29 | 11.3%(-10.7)#250 |
| 30. | Wenonah Borough | 0.73% | 8.6%(-7.88)#30 | 11.3%(-10.6)#279 |
| 31. | Pines Lake | 0.73% | 8.6%(-7.88)#31 | 11.3%(-10.6)#282 |
| 32. | Morganville | 0.73% | 8.6%(-7.88)#32 | 11.3%(-10.6)#286 |
| 33. | Auburn | 0.77% | 8.6%(-7.84)#33 | 11.3%(-10.6)#314 |
| 34. | Ramsey Borough | 0.79% | 8.6%(-7.82)#34 | 11.3%(-10.6)#330 |
| 35. | Greenwich | 0.86% | 8.6%(-7.75)#35 | 11.3%(-10.5)#385 |
| 36. | Rosenhayn | 0.92% | 8.6%(-7.69)#36 | 11.3%(-10.4)#423 |
| 37. | New Providence Borough | 0.92% | 8.6%(-7.69)#37 | 11.3%(-10.4)#426 |
| 38. | Alloway | 0.94% | 8.6%(-7.66)#38 | 11.3%(-10.4)#443 |
| 39. | Mcguire Afb | 1.0% | 8.6%(-7.57)#39 | 11.3%(-10.3)#510 |
| 40. | Moonachie Borough | 1.0% | 8.6%(-7.56)#40 | 11.3%(-10.3)#516 |
| 41. | Haddonfield Borough | 1.1% | 8.6%(-7.53)#41 | 11.3%(-10.3)#541 |
| 42. | Vincentown | 1.1% | 8.6%(-7.46)#42 | 11.3%(-10.2)#600 |
| 43. | Vernon Valley | 1.2% | 8.6%(-7.45)#43 | 11.3%(-10.2)#614 |
| 44. | Ship Bottom Borough | 1.2% | 8.6%(-7.39)#44 | 11.3%(-10.1)#680 |
| 45. | Cresskill Borough | 1.2% | 8.6%(-7.37)#45 | 11.3%(-10.1)#707 |
| 46. | Union Beach Borough | 1.2% | 8.6%(-7.36)#46 | 11.3%(-10.1)#712 |
| 47. | Palermo | 1.3% | 8.6%(-7.34)#47 | 11.3%(-10.1)#725 |
| 48. | Watchung Borough | 1.3% | 8.6%(-7.33)#48 | 11.3%(-10.1)#733 |
| 49. | Beach Haven West | 1.3% | 8.6%(-7.31)#49 | 11.3%(-10.0)#746 |
| 50. | Clinton | 1.3% | 8.6%(-7.31)#50 | 11.3%(-10.0)#752 |
| 51. | Mount Tabor | 1.3% | 8.6%(-7.29)#51 | 11.3%(-10.0)#773 |
| 52. | Englewood Cliffs Borough | 1.3% | 8.6%(-7.27)#52 | 11.3%(-10.0)#789 |
| 53. | Fanwood Borough | 1.3% | 8.6%(-7.26)#53 | 11.3%(-10.00)#796 |
| 54. | Ledgewood | 1.4% | 8.6%(-7.24)#54 | 11.3%(-9.97)#815 |
| 55. | Laurel Heights | 1.4% | 8.6%(-7.23)#55 | 11.3%(-9.96)#835 |
| 56. | Bernardsville Borough | 1.4% | 8.6%(-7.21)#56 | 11.3%(-9.95)#846 |
| 57. | Lake Mohawk | 1.4% | 8.6%(-7.21)#57 | 11.3%(-9.94)#852 |
| 58. | Lake Telemark | 1.4% | 8.6%(-7.20)#58 | 11.3%(-9.93)#860 |
| 59. | Oakland Borough | 1.4% | 8.6%(-7.19)#59 | 11.3%(-9.92)#865 |
| 60. | Glen Rock Borough | 1.4% | 8.6%(-7.18)#60 | 11.3%(-9.92)#867 |
| 61. | Old Tappan Borough | 1.4% | 8.6%(-7.18)#61 | 11.3%(-9.91)#878 |
| 62. | Waldwick Borough | 1.4% | 8.6%(-7.17)#62 | 11.3%(-9.90)#882 |
| 63. | Rainbow Lakes | 1.4% | 8.6%(-7.17)#63 | 11.3%(-9.90)#883 |
| 64. | Park Ridge Borough | 1.5% | 8.6%(-7.14)#64 | 11.3%(-9.88)#905 |
| 65. | Silver Lake | 1.5% | 8.6%(-7.14)#65 | 11.3%(-9.88)#907 |
| 66. | Lavallette Borough | 1.5% | 8.6%(-7.14)#66 | 11.3%(-9.87)#912 |
| 67. | Brownville | 1.5% | 8.6%(-7.13)#67 | 11.3%(-9.86)#921 |
| 68. | Martinsville | 1.5% | 8.6%(-7.09)#68 | 11.3%(-9.82)#955 |
| 69. | Cranford | 1.5% | 8.6%(-7.07)#69 | 11.3%(-9.80)#976 |
| 70. | Morris Plains Borough | 1.5% | 8.6%(-7.06)#70 | 11.3%(-9.79)#980 |
| 71. | Mantoloking Borough | 1.6% | 8.6%(-7.05)#71 | 11.3%(-9.78)#996 |
| 72. | Robbinsville Center | 1.6% | 8.6%(-7.03)#72 | 11.3%(-9.77)#1,003 |
| 73. | Mercerville | 1.6% | 8.6%(-7.03)#73 | 11.3%(-9.76)#1,008 |
| 74. | Kinnelon Borough | 1.6% | 8.6%(-7.02)#74 | 11.3%(-9.75)#1,020 |
| 75. | Glen Ridge Borough | 1.6% | 8.6%(-7.01)#75 | 11.3%(-9.74)#1,025 |
| 76. | Lincoln Park Borough | 1.6% | 8.6%(-6.99)#76 | 11.3%(-9.73)#1,035 |
| 77. | Madison Borough | 1.6% | 8.6%(-6.98)#77 | 11.3%(-9.72)#1,044 |
| 78. | Manasquan Borough | 1.6% | 8.6%(-6.97)#78 | 11.3%(-9.71)#1,056 |
| 79. | Ocean Gate Borough | 1.7% | 8.6%(-6.95)#79 | 11.3%(-9.68)#1,090 |
| 80. | Estell Manor | 1.7% | 8.6%(-6.93)#80 | 11.3%(-9.67)#1,113 |
| 81. | Mount Hope | 1.7% | 8.6%(-6.91)#81 | 11.3%(-9.64)#1,139 |
| 82. | Berlin Borough | 1.7% | 8.6%(-6.90)#82 | 11.3%(-9.64)#1,142 |
| 83. | Dayton | 1.7% | 8.6%(-6.89)#83 | 11.3%(-9.63)#1,159 |
| 84. | Centre Grove | 1.7% | 8.6%(-6.88)#84 | 11.3%(-9.62)#1,164 |
| 85. | Middlebush | 1.7% | 8.6%(-6.86)#85 | 11.3%(-9.60)#1,193 |
| 86. | Upper Montclair | 1.7% | 8.6%(-6.86)#86 | 11.3%(-9.60)#1,199 |
| 87. | Carlls Corner | 1.8% | 8.6%(-6.84)#87 | 11.3%(-9.57)#1,224 |
| 88. | Milltown Borough | 1.8% | 8.6%(-6.83)#88 | 11.3%(-9.57)#1,233 |
| 89. | Glen Gardner Borough | 1.9% | 8.6%(-6.75)#89 | 11.3%(-9.49)#1,323 |
| 90. | Vista Center | 1.9% | 8.6%(-6.75)#90 | 11.3%(-9.48)#1,326 |
| 91. | Sheppards Mill | 1.9% | 8.6%(-6.72)#91 | 11.3%(-9.45)#1,352 |
| 92. | Metuchen Borough | 1.9% | 8.6%(-6.72)#92 | 11.3%(-9.45)#1,353 |
| 93. | Ridgewood | 1.9% | 8.6%(-6.72)#93 | 11.3%(-9.45)#1,354 |
| 94. | Milmay | 1.9% | 8.6%(-6.70)#94 | 11.3%(-9.44)#1,374 |
| 95. | Westfield | 1.9% | 8.6%(-6.69)#95 | 11.3%(-9.42)#1,391 |
| 96. | River Edge Borough | 1.9% | 8.6%(-6.67)#96 | 11.3%(-9.41)#1,406 |
| 97. | Towaco | 1.9% | 8.6%(-6.67)#97 | 11.3%(-9.40)#1,413 |
| 98. | Roosevelt Borough | 1.9% | 8.6%(-6.66)#98 | 11.3%(-9.40)#1,417 |
| 99. | Turnersville | 2.0% | 8.6%(-6.65)#99 | 11.3%(-9.39)#1,427 |
| 100. | Far Hills Borough | 2.0% | 8.6%(-6.63)#100 | 11.3%(-9.36)#1,454 |
Common Questions
What are the Top 10 Cities with the Lowest Male Poverty Level in New Jersey?
Top 10 Cities with the Lowest Male Poverty Level in New Jersey are:
#1
0.16%
#2
0.43%
#3
0.44%
#4
0.45%
#5
0.49%
#6
0.51%
#7
0.52%
#8
0.53%
#9
0.56%
#10
0.62%
What city has the Lowest Male Poverty Level in New Jersey?
Oakhurst has the Lowest Male Poverty Level in New Jersey with 0.16%.
What is the Poverty Level Among Males in the State of New Jersey?
Poverty Level Among Males in New Jersey is 8.6%.
What is the Poverty Level Among Males in the United States?
Poverty Level Among Males in the United States is 11.3%.