Cities with the Highest Percentage of Households Heated without Fuel in New Jersey
RELATED REPORTS & OPTIONS
Fuel-less Heating
New Jersey
Compare Cities
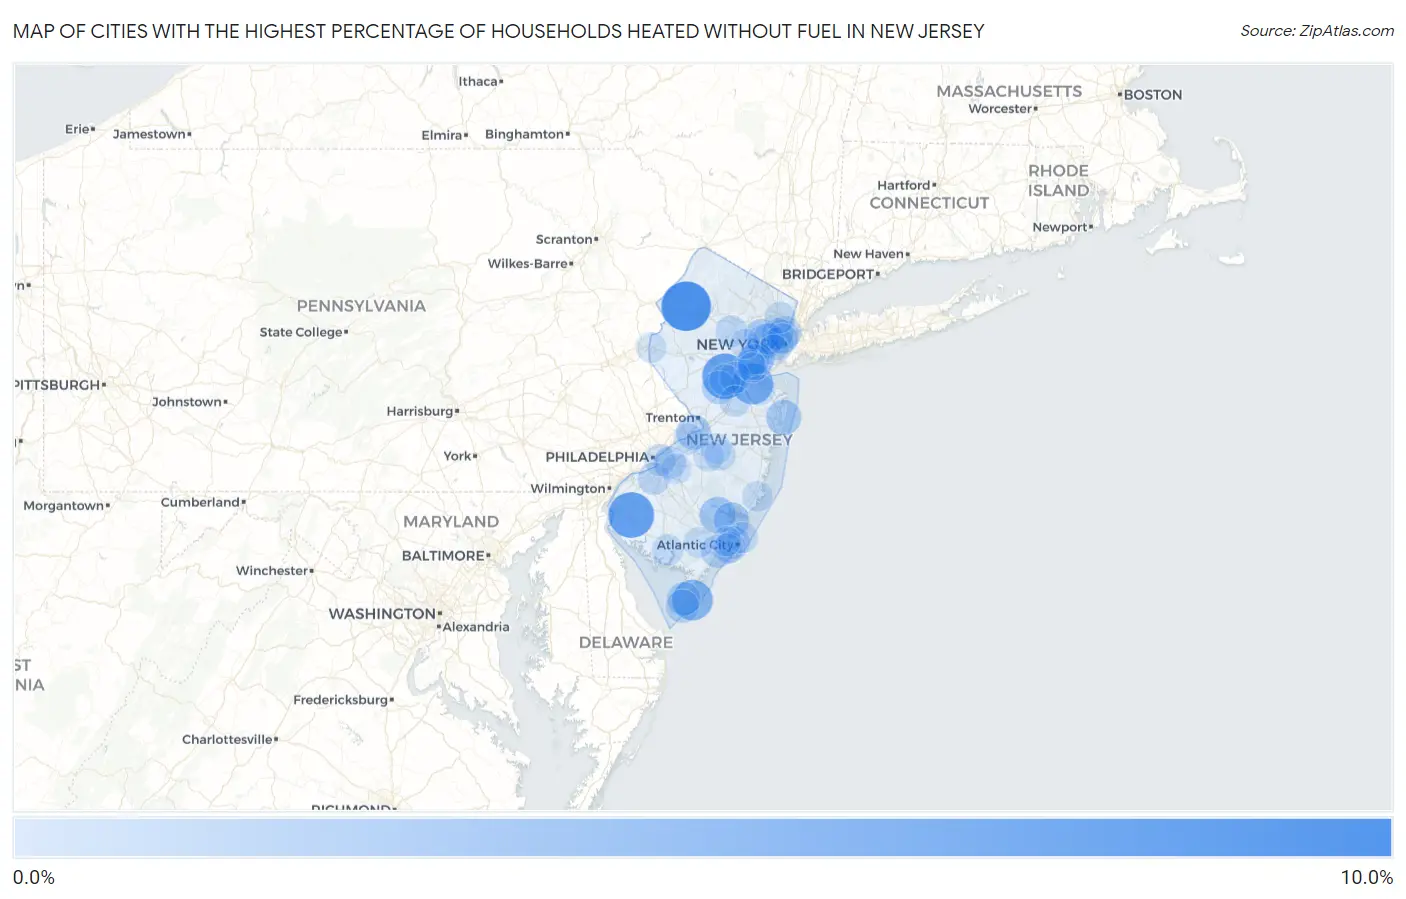
Map of Cities with the Highest Percentage of Households Heated without Fuel in New Jersey
0.0%
10.0%
Cities with the Highest Percentage of Households Heated without Fuel in New Jersey
| City | Fuel-less Heating | vs State | vs National | |
| 1. | Johnsonburg | 8.5% | 0.70%(+7.80)#1 | 1.2%(+7.30)#698 |
| 2. | West Park | 7.7% | 0.70%(+7.00)#2 | 1.2%(+6.50)#748 |
| 3. | Alloway | 7.0% | 0.70%(+6.30)#3 | 1.2%(+5.80)#790 |
| 4. | Middlebush | 6.9% | 0.70%(+6.20)#4 | 1.2%(+5.70)#799 |
| 5. | Victory Gardens Borough | 6.6% | 0.70%(+5.90)#5 | 1.2%(+5.40)#827 |
| 6. | Madison Park | 5.3% | 0.70%(+4.60)#6 | 1.2%(+4.10)#986 |
| 7. | Wildwood | 5.0% | 0.70%(+4.30)#7 | 1.2%(+3.80)#1,041 |
| 8. | Stone Harbor Borough | 4.3% | 0.70%(+3.60)#8 | 1.2%(+3.10)#1,217 |
| 9. | Mantoloking Borough | 3.6% | 0.70%(+2.90)#9 | 1.2%(+2.40)#1,407 |
| 10. | Egg Harbor City | 3.3% | 0.70%(+2.60)#10 | 1.2%(+2.10)#1,492 |
| 11. | Fairview Borough | 3.1% | 0.70%(+2.40)#11 | 1.2%(+1.90)#1,565 |
| 12. | Port Republic | 3.0% | 0.70%(+2.30)#12 | 1.2%(+1.80)#1,648 |
| 13. | Avenel | 2.9% | 0.70%(+2.20)#13 | 1.2%(+1.70)#1,662 |
| 14. | Asbury Park | 2.9% | 0.70%(+2.20)#14 | 1.2%(+1.70)#1,663 |
| 15. | Keasbey | 2.8% | 0.70%(+2.10)#15 | 1.2%(+1.60)#1,734 |
| 16. | Newark | 2.7% | 0.70%(+2.00)#16 | 1.2%(+1.50)#1,762 |
| 17. | Florence | 2.7% | 0.70%(+2.00)#17 | 1.2%(+1.50)#1,781 |
| 18. | East Orange | 2.6% | 0.70%(+1.90)#18 | 1.2%(+1.40)#1,831 |
| 19. | Linden | 2.6% | 0.70%(+1.90)#19 | 1.2%(+1.40)#1,835 |
| 20. | Netcong Borough | 2.6% | 0.70%(+1.90)#20 | 1.2%(+1.40)#1,858 |
| 21. | Far Hills Borough | 2.6% | 0.70%(+1.90)#21 | 1.2%(+1.40)#1,879 |
| 22. | Bogota Borough | 2.5% | 0.70%(+1.80)#22 | 1.2%(+1.30)#1,925 |
| 23. | Fort Lee Borough | 2.4% | 0.70%(+1.70)#23 | 1.2%(+1.20)#1,989 |
| 24. | Cape May Point Borough | 2.4% | 0.70%(+1.70)#24 | 1.2%(+1.20)#2,075 |
| 25. | Erma | 2.3% | 0.70%(+1.60)#25 | 1.2%(+1.10)#2,124 |
| 26. | Bound Brook Borough | 2.2% | 0.70%(+1.50)#26 | 1.2%(+1.00)#2,184 |
| 27. | Cape May | 2.2% | 0.70%(+1.50)#27 | 1.2%(+1.00)#2,210 |
| 28. | Ten Mile Run | 2.2% | 0.70%(+1.50)#28 | 1.2%(+1.00)#2,218 |
| 29. | Farmingdale Borough | 2.2% | 0.70%(+1.50)#29 | 1.2%(+1.00)#2,232 |
| 30. | Union City | 2.1% | 0.70%(+1.40)#30 | 1.2%(+0.900)#2,283 |
| 31. | Guttenberg | 2.1% | 0.70%(+1.40)#31 | 1.2%(+0.900)#2,309 |
| 32. | Somers Point | 2.1% | 0.70%(+1.40)#32 | 1.2%(+0.900)#2,311 |
| 33. | Runnemede Borough | 2.1% | 0.70%(+1.40)#33 | 1.2%(+0.900)#2,318 |
| 34. | Atlantic Highlands Borough | 2.1% | 0.70%(+1.40)#34 | 1.2%(+0.900)#2,332 |
| 35. | Hillsborough | 2.0% | 0.70%(+1.30)#35 | 1.2%(+0.800)#2,419 |
| 36. | Somerville Borough | 2.0% | 0.70%(+1.30)#36 | 1.2%(+0.800)#2,429 |
| 37. | Jersey City | 1.9% | 0.70%(+1.20)#37 | 1.2%(+0.700)#2,535 |
| 38. | Atlantic City | 1.9% | 0.70%(+1.20)#38 | 1.2%(+0.700)#2,543 |
| 39. | North Arlington Borough | 1.9% | 0.70%(+1.20)#39 | 1.2%(+0.700)#2,558 |
| 40. | Manville Borough | 1.9% | 0.70%(+1.20)#40 | 1.2%(+0.700)#2,564 |
| 41. | Ellisburg | 1.9% | 0.70%(+1.20)#41 | 1.2%(+0.700)#2,591 |
| 42. | Kenilworth Borough | 1.8% | 0.70%(+1.10)#42 | 1.2%(+0.600)#2,725 |
| 43. | Oak Valley | 1.8% | 0.70%(+1.10)#43 | 1.2%(+0.600)#2,747 |
| 44. | Woodlynne Borough | 1.8% | 0.70%(+1.10)#44 | 1.2%(+0.600)#2,765 |
| 45. | Laurel Springs Borough | 1.8% | 0.70%(+1.10)#45 | 1.2%(+0.600)#2,784 |
| 46. | Rahway | 1.7% | 0.70%(+1.00)#46 | 1.2%(+0.500)#2,878 |
| 47. | Westwood Borough | 1.7% | 0.70%(+1.00)#47 | 1.2%(+0.500)#2,899 |
| 48. | Hi Nella Borough | 1.7% | 0.70%(+1.00)#48 | 1.2%(+0.500)#2,971 |
| 49. | Allenhurst Borough | 1.7% | 0.70%(+1.00)#49 | 1.2%(+0.500)#2,987 |
| 50. | Camden | 1.6% | 0.70%(+0.900)#50 | 1.2%(+0.400)#3,018 |
| 51. | South Plainfield Borough | 1.6% | 0.70%(+0.900)#51 | 1.2%(+0.400)#3,035 |
| 52. | Secaucus | 1.6% | 0.70%(+0.900)#52 | 1.2%(+0.400)#3,041 |
| 53. | Morristown | 1.6% | 0.70%(+0.900)#53 | 1.2%(+0.400)#3,043 |
| 54. | Red Bank Borough | 1.6% | 0.70%(+0.900)#54 | 1.2%(+0.400)#3,059 |
| 55. | Newport | 1.6% | 0.70%(+0.900)#55 | 1.2%(+0.400)#3,179 |
| 56. | New Brunswick | 1.5% | 0.70%(+0.800)#56 | 1.2%(+0.300)#3,220 |
| 57. | Harrison | 1.5% | 0.70%(+0.800)#57 | 1.2%(+0.300)#3,245 |
| 58. | Freehold Borough | 1.5% | 0.70%(+0.800)#58 | 1.2%(+0.300)#3,256 |
| 59. | Mount Arlington Borough | 1.5% | 0.70%(+0.800)#59 | 1.2%(+0.300)#3,285 |
| 60. | Landing | 1.5% | 0.70%(+0.800)#60 | 1.2%(+0.300)#3,297 |
| 61. | Six Mile Run | 1.5% | 0.70%(+0.800)#61 | 1.2%(+0.300)#3,310 |
| 62. | Whittingham | 1.5% | 0.70%(+0.800)#62 | 1.2%(+0.300)#3,332 |
| 63. | Macopin | 1.5% | 0.70%(+0.800)#63 | 1.2%(+0.300)#3,333 |
| 64. | Laurel Lake | 1.5% | 0.70%(+0.800)#64 | 1.2%(+0.300)#3,334 |
| 65. | Surf City Borough | 1.5% | 0.70%(+0.800)#65 | 1.2%(+0.300)#3,363 |
| 66. | Hackensack | 1.4% | 0.70%(+0.700)#66 | 1.2%(+0.200)#3,434 |
| 67. | Lake Hiawatha | 1.4% | 0.70%(+0.700)#67 | 1.2%(+0.200)#3,473 |
| 68. | Browns Mills | 1.4% | 0.70%(+0.700)#68 | 1.2%(+0.200)#3,474 |
| 69. | Ventnor City | 1.4% | 0.70%(+0.700)#69 | 1.2%(+0.200)#3,481 |
| 70. | Brigantine | 1.4% | 0.70%(+0.700)#70 | 1.2%(+0.200)#3,495 |
| 71. | Hoboken | 1.3% | 0.70%(+0.600)#71 | 1.2%(+0.100)#3,660 |
| 72. | Cliffside Park Borough | 1.3% | 0.70%(+0.600)#72 | 1.2%(+0.100)#3,677 |
| 73. | Collingswood Borough | 1.3% | 0.70%(+0.600)#73 | 1.2%(+0.100)#3,700 |
| 74. | Fort Dix | 1.3% | 0.70%(+0.600)#74 | 1.2%(+0.100)#3,724 |
| 75. | Jamesburg Borough | 1.3% | 0.70%(+0.600)#75 | 1.2%(+0.100)#3,743 |
| 76. | Pemberton Heights | 1.3% | 0.70%(+0.600)#76 | 1.2%(+0.100)#3,792 |
| 77. | Riverton Borough | 1.3% | 0.70%(+0.600)#77 | 1.2%(+0.100)#3,794 |
| 78. | Estell Manor | 1.3% | 0.70%(+0.600)#78 | 1.2%(+0.100)#3,816 |
| 79. | Bayonne | 1.2% | 0.70%(+0.500)#79 | 1.2%(=0.000)#3,906 |
| 80. | Carteret Borough | 1.2% | 0.70%(+0.500)#80 | 1.2%(=0.000)#3,936 |
| 81. | Iselin | 1.2% | 0.70%(+0.500)#81 | 1.2%(=0.000)#3,949 |
| 82. | Phillipsburg | 1.2% | 0.70%(+0.500)#82 | 1.2%(=0.000)#3,959 |
| 83. | Edgewater Borough | 1.2% | 0.70%(+0.500)#83 | 1.2%(=0.000)#3,964 |
| 84. | Keansburg Borough | 1.2% | 0.70%(+0.500)#84 | 1.2%(=0.000)#3,982 |
| 85. | Strathmore | 1.2% | 0.70%(+0.500)#85 | 1.2%(=0.000)#4,005 |
| 86. | Woodcliff Lake Borough | 1.2% | 0.70%(+0.500)#86 | 1.2%(=0.000)#4,012 |
| 87. | Manahawkin | 1.2% | 0.70%(+0.500)#87 | 1.2%(=0.000)#4,072 |
| 88. | Hampton Borough | 1.2% | 0.70%(+0.500)#88 | 1.2%(=0.000)#4,118 |
| 89. | Summit | 1.1% | 0.70%(+0.400)#89 | 1.2%(-0.100)#4,240 |
| 90. | Springdale | 1.1% | 0.70%(+0.400)#90 | 1.2%(-0.100)#4,259 |
| 91. | Woodland Park Borough | 1.1% | 0.70%(+0.400)#91 | 1.2%(-0.100)#4,268 |
| 92. | Burlington | 1.1% | 0.70%(+0.400)#92 | 1.2%(-0.100)#4,285 |
| 93. | Chatham Borough | 1.1% | 0.70%(+0.400)#93 | 1.2%(-0.100)#4,288 |
| 94. | Margate City | 1.1% | 0.70%(+0.400)#94 | 1.2%(-0.100)#4,316 |
| 95. | Neshanic Station | 1.1% | 0.70%(+0.400)#95 | 1.2%(-0.100)#4,317 |
| 96. | Lodi Borough | 1.0% | 0.70%(+0.300)#96 | 1.2%(-0.200)#4,557 |
| 97. | North Plainfield Borough | 1.0% | 0.70%(+0.300)#97 | 1.2%(-0.200)#4,565 |
| 98. | Roselle Borough | 1.0% | 0.70%(+0.300)#98 | 1.2%(-0.200)#4,566 |
| 99. | Woodbridge | 1.0% | 0.70%(+0.300)#99 | 1.2%(-0.200)#4,570 |
| 100. | Pleasantville | 1.0% | 0.70%(+0.300)#100 | 1.2%(-0.200)#4,571 |
Common Questions
What are the Top 10 Cities with the Highest Percentage of Households Heated without Fuel in New Jersey?
Top 10 Cities with the Highest Percentage of Households Heated without Fuel in New Jersey are:
#1
8.5%
#2
7.0%
#3
6.9%
#4
5.3%
#5
5.0%
#6
3.3%
#7
3.0%
#8
2.9%
#9
2.9%
#10
2.7%
What city has the Highest Percentage of Households Heated without Fuel in New Jersey?
Johnsonburg has the Highest Percentage of Households Heated without Fuel in New Jersey with 8.5%.
What is the Percentage of Households Heated without Fuel in the State of New Jersey?
Percentage of Households Heated without Fuel in New Jersey is 0.70%.
What is the Percentage of Households Heated without Fuel in the United States?
Percentage of Households Heated without Fuel in the United States is 1.2%.