Cities with the Largest Guatemalan Community in New Jersey
RELATED REPORTS & OPTIONS
Guatemalan
New Jersey
Compare Cities
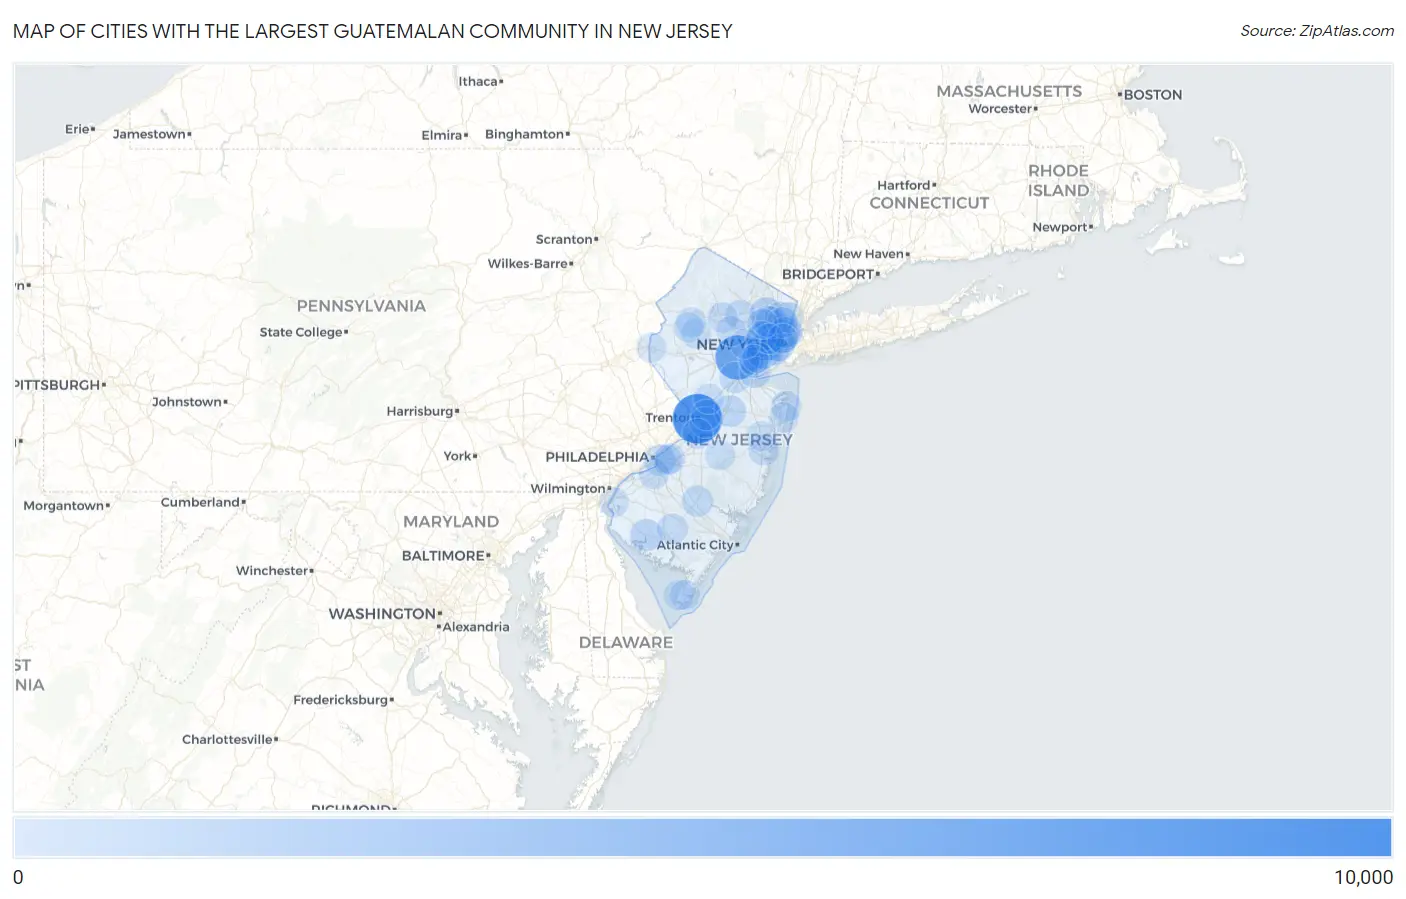
Map of Cities with the Largest Guatemalan Community in New Jersey
0
10,000
Cities with the Largest Guatemalan Community in New Jersey
| City | Guatemalan | vs State | vs National | |
| 1. | Trenton | 9,324 | 72,199(12.91%)#1 | 1,669,094(0.56%)#10 |
| 2. | Plainfield | 6,810 | 72,199(9.43%)#2 | 1,669,094(0.41%)#16 |
| 3. | Newark | 4,184 | 72,199(5.80%)#3 | 1,669,094(0.25%)#42 |
| 4. | Elizabeth | 2,395 | 72,199(3.32%)#4 | 1,669,094(0.14%)#94 |
| 5. | Jersey City | 2,296 | 72,199(3.18%)#5 | 1,669,094(0.14%)#100 |
| 6. | West New York | 2,096 | 72,199(2.90%)#6 | 1,669,094(0.13%)#112 |
| 7. | North Plainfield Borough | 1,891 | 72,199(2.62%)#7 | 1,669,094(0.11%)#133 |
| 8. | Cliffside Park Borough | 1,806 | 72,199(2.50%)#8 | 1,669,094(0.11%)#140 |
| 9. | Paterson | 1,365 | 72,199(1.89%)#9 | 1,669,094(0.08%)#198 |
| 10. | Fairview Borough | 1,328 | 72,199(1.84%)#10 | 1,669,094(0.08%)#206 |
| 11. | Union City | 1,165 | 72,199(1.61%)#11 | 1,669,094(0.07%)#235 |
| 12. | Palisades Park Borough | 971 | 72,199(1.34%)#12 | 1,669,094(0.06%)#279 |
| 13. | Bridgeton | 941 | 72,199(1.30%)#13 | 1,669,094(0.06%)#286 |
| 14. | Passaic | 931 | 72,199(1.29%)#14 | 1,669,094(0.06%)#291 |
| 15. | Twin Rivers | 845 | 72,199(1.17%)#15 | 1,669,094(0.05%)#316 |
| 16. | Bound Brook Borough | 787 | 72,199(1.09%)#16 | 1,669,094(0.05%)#341 |
| 17. | Camden | 621 | 72,199(0.86%)#17 | 1,669,094(0.04%)#409 |
| 18. | New Brunswick | 558 | 72,199(0.77%)#18 | 1,669,094(0.03%)#454 |
| 19. | Kearny | 507 | 72,199(0.70%)#19 | 1,669,094(0.03%)#497 |
| 20. | Bayonne | 495 | 72,199(0.69%)#20 | 1,669,094(0.03%)#503 |
| 21. | Hackensack | 490 | 72,199(0.68%)#21 | 1,669,094(0.03%)#507 |
| 22. | Hammonton | 486 | 72,199(0.67%)#22 | 1,669,094(0.03%)#511 |
| 23. | Perth Amboy | 466 | 72,199(0.65%)#23 | 1,669,094(0.03%)#523 |
| 24. | White Horse | 445 | 72,199(0.62%)#24 | 1,669,094(0.03%)#539 |
| 25. | Toms River | 408 | 72,199(0.57%)#25 | 1,669,094(0.02%)#586 |
| 26. | Clifton | 408 | 72,199(0.57%)#26 | 1,669,094(0.02%)#587 |
| 27. | Vineland | 379 | 72,199(0.52%)#27 | 1,669,094(0.02%)#634 |
| 28. | South Plainfield Borough | 369 | 72,199(0.51%)#28 | 1,669,094(0.02%)#648 |
| 29. | Woodbury | 354 | 72,199(0.49%)#29 | 1,669,094(0.02%)#668 |
| 30. | Englewood | 351 | 72,199(0.49%)#30 | 1,669,094(0.02%)#673 |
| 31. | Guttenberg | 342 | 72,199(0.47%)#31 | 1,669,094(0.02%)#696 |
| 32. | Flemington Borough | 337 | 72,199(0.47%)#32 | 1,669,094(0.02%)#707 |
| 33. | Ridgefield Park | 262 | 72,199(0.36%)#33 | 1,669,094(0.02%)#871 |
| 34. | Ridgefield Borough | 260 | 72,199(0.36%)#34 | 1,669,094(0.02%)#879 |
| 35. | Watsessing | 228 | 72,199(0.32%)#35 | 1,669,094(0.01%)#961 |
| 36. | North Arlington Borough | 218 | 72,199(0.30%)#36 | 1,669,094(0.01%)#987 |
| 37. | South River Borough | 214 | 72,199(0.30%)#37 | 1,669,094(0.01%)#1,001 |
| 38. | Long Branch | 210 | 72,199(0.29%)#38 | 1,669,094(0.01%)#1,014 |
| 39. | Bernardsville Borough | 202 | 72,199(0.28%)#39 | 1,669,094(0.01%)#1,044 |
| 40. | East Orange | 201 | 72,199(0.28%)#40 | 1,669,094(0.01%)#1,046 |
| 41. | Fort Lee Borough | 201 | 72,199(0.28%)#41 | 1,669,094(0.01%)#1,049 |
| 42. | Cherry Hill Mall | 180 | 72,199(0.25%)#42 | 1,669,094(0.01%)#1,135 |
| 43. | Hawthorne Borough | 178 | 72,199(0.25%)#43 | 1,669,094(0.01%)#1,141 |
| 44. | Swedesboro Borough | 178 | 72,199(0.25%)#44 | 1,669,094(0.01%)#1,143 |
| 45. | Mercerville | 166 | 72,199(0.23%)#45 | 1,669,094(0.01%)#1,194 |
| 46. | Villas | 165 | 72,199(0.23%)#46 | 1,669,094(0.01%)#1,202 |
| 47. | Boonton | 162 | 72,199(0.22%)#47 | 1,669,094(0.01%)#1,217 |
| 48. | Avenel | 159 | 72,199(0.22%)#48 | 1,669,094(0.01%)#1,230 |
| 49. | Bergenfield Borough | 153 | 72,199(0.21%)#49 | 1,669,094(0.01%)#1,268 |
| 50. | Netcong Borough | 152 | 72,199(0.21%)#50 | 1,669,094(0.01%)#1,281 |
| 51. | Roebling | 147 | 72,199(0.20%)#51 | 1,669,094(0.01%)#1,311 |
| 52. | Linden | 146 | 72,199(0.20%)#52 | 1,669,094(0.01%)#1,313 |
| 53. | Leonia Borough | 144 | 72,199(0.20%)#53 | 1,669,094(0.01%)#1,326 |
| 54. | Princeton | 142 | 72,199(0.20%)#54 | 1,669,094(0.01%)#1,339 |
| 55. | Dover | 141 | 72,199(0.20%)#55 | 1,669,094(0.01%)#1,349 |
| 56. | Freehold Borough | 138 | 72,199(0.19%)#56 | 1,669,094(0.01%)#1,372 |
| 57. | Elmwood Park Borough | 136 | 72,199(0.19%)#57 | 1,669,094(0.01%)#1,379 |
| 58. | Gillette | 129 | 72,199(0.18%)#58 | 1,669,094(0.01%)#1,427 |
| 59. | Wanaque Borough | 126 | 72,199(0.17%)#59 | 1,669,094(0.01%)#1,436 |
| 60. | Morristown | 123 | 72,199(0.17%)#60 | 1,669,094(0.01%)#1,451 |
| 61. | Butler Borough | 123 | 72,199(0.17%)#61 | 1,669,094(0.01%)#1,453 |
| 62. | Long Valley | 121 | 72,199(0.17%)#62 | 1,669,094(0.01%)#1,466 |
| 63. | Golden Triangle | 119 | 72,199(0.16%)#63 | 1,669,094(0.01%)#1,477 |
| 64. | Cresskill Borough | 116 | 72,199(0.16%)#64 | 1,669,094(0.01%)#1,496 |
| 65. | North Haledon Borough | 112 | 72,199(0.16%)#65 | 1,669,094(0.01%)#1,532 |
| 66. | Asbury Park | 111 | 72,199(0.15%)#66 | 1,669,094(0.01%)#1,543 |
| 67. | Carteret Borough | 110 | 72,199(0.15%)#67 | 1,669,094(0.01%)#1,554 |
| 68. | Prospect Park Borough | 110 | 72,199(0.15%)#68 | 1,669,094(0.01%)#1,558 |
| 69. | Stratford Borough | 99 | 72,199(0.14%)#69 | 1,669,094(0.01%)#1,669 |
| 70. | Raritan Borough | 98 | 72,199(0.14%)#70 | 1,669,094(0.01%)#1,683 |
| 71. | Hillsdale Borough | 97 | 72,199(0.13%)#71 | 1,669,094(0.01%)#1,697 |
| 72. | Hackettstown | 97 | 72,199(0.13%)#72 | 1,669,094(0.01%)#1,698 |
| 73. | Roosevelt Borough | 95 | 72,199(0.13%)#73 | 1,669,094(0.01%)#1,725 |
| 74. | Lakewood | 91 | 72,199(0.13%)#74 | 1,669,094(0.01%)#1,765 |
| 75. | Parsippany | 91 | 72,199(0.13%)#75 | 1,669,094(0.01%)#1,771 |
| 76. | Hightstown Borough | 87 | 72,199(0.12%)#76 | 1,669,094(0.01%)#1,820 |
| 77. | Dividing Creek | 86 | 72,199(0.12%)#77 | 1,669,094(0.01%)#1,834 |
| 78. | Harrison | 83 | 72,199(0.11%)#78 | 1,669,094(0.00%)#1,854 |
| 79. | Caldwell Borough | 82 | 72,199(0.11%)#79 | 1,669,094(0.00%)#1,870 |
| 80. | Runnemede Borough | 80 | 72,199(0.11%)#80 | 1,669,094(0.00%)#1,894 |
| 81. | Beattystown | 80 | 72,199(0.11%)#81 | 1,669,094(0.00%)#1,896 |
| 82. | Summit | 77 | 72,199(0.11%)#82 | 1,669,094(0.00%)#1,934 |
| 83. | Saddle River Borough | 75 | 72,199(0.10%)#83 | 1,669,094(0.00%)#1,961 |
| 84. | Glen Rock Borough | 74 | 72,199(0.10%)#84 | 1,669,094(0.00%)#1,969 |
| 85. | Rio Grande | 73 | 72,199(0.10%)#85 | 1,669,094(0.00%)#1,982 |
| 86. | Beachwood Borough | 72 | 72,199(0.10%)#86 | 1,669,094(0.00%)#1,989 |
| 87. | Sicklerville | 71 | 72,199(0.10%)#87 | 1,669,094(0.00%)#2,001 |
| 88. | Manville Borough | 69 | 72,199(0.10%)#88 | 1,669,094(0.00%)#2,039 |
| 89. | Upper Montclair | 68 | 72,199(0.09%)#89 | 1,669,094(0.00%)#2,057 |
| 90. | South Bound Brook Borough | 68 | 72,199(0.09%)#90 | 1,669,094(0.00%)#2,063 |
| 91. | Hoboken | 66 | 72,199(0.09%)#91 | 1,669,094(0.00%)#2,092 |
| 92. | Roselle Park Borough | 65 | 72,199(0.09%)#92 | 1,669,094(0.00%)#2,115 |
| 93. | Somerville Borough | 61 | 72,199(0.08%)#93 | 1,669,094(0.00%)#2,177 |
| 94. | Phillipsburg | 58 | 72,199(0.08%)#94 | 1,669,094(0.00%)#2,239 |
| 95. | Tinton Falls Borough | 57 | 72,199(0.08%)#95 | 1,669,094(0.00%)#2,261 |
| 96. | Pennsville | 57 | 72,199(0.08%)#96 | 1,669,094(0.00%)#2,265 |
| 97. | Closter Borough | 55 | 72,199(0.08%)#97 | 1,669,094(0.00%)#2,306 |
| 98. | Browns Mills | 54 | 72,199(0.07%)#98 | 1,669,094(0.00%)#2,320 |
| 99. | Rahway | 53 | 72,199(0.07%)#99 | 1,669,094(0.00%)#2,334 |
| 100. | Rutherford Borough | 53 | 72,199(0.07%)#100 | 1,669,094(0.00%)#2,340 |
Common Questions
What are the Top 10 Cities with the Largest Guatemalan Community in New Jersey?
Top 10 Cities with the Largest Guatemalan Community in New Jersey are:
#1
9,324
#2
6,810
#3
4,184
#4
2,395
#5
2,296
#6
2,096
#7
1,365
#8
1,165
#9
941
#10
931
What city has the Largest Guatemalan Community in New Jersey?
Trenton has the Largest Guatemalan Community in New Jersey with 9,324.
What is the Total Guatemalan Population in the State of New Jersey?
Total Guatemalan Population in New Jersey is 72,199.
What is the Total Guatemalan Population in the United States?
Total Guatemalan Population in the United States is 1,669,094.