Cities with the Highest Percentage of Self-Employed / Not Incorporated in New Jersey
RELATED REPORTS & OPTIONS
Self-Employed / Not Incorporated
New Jersey
Compare Cities
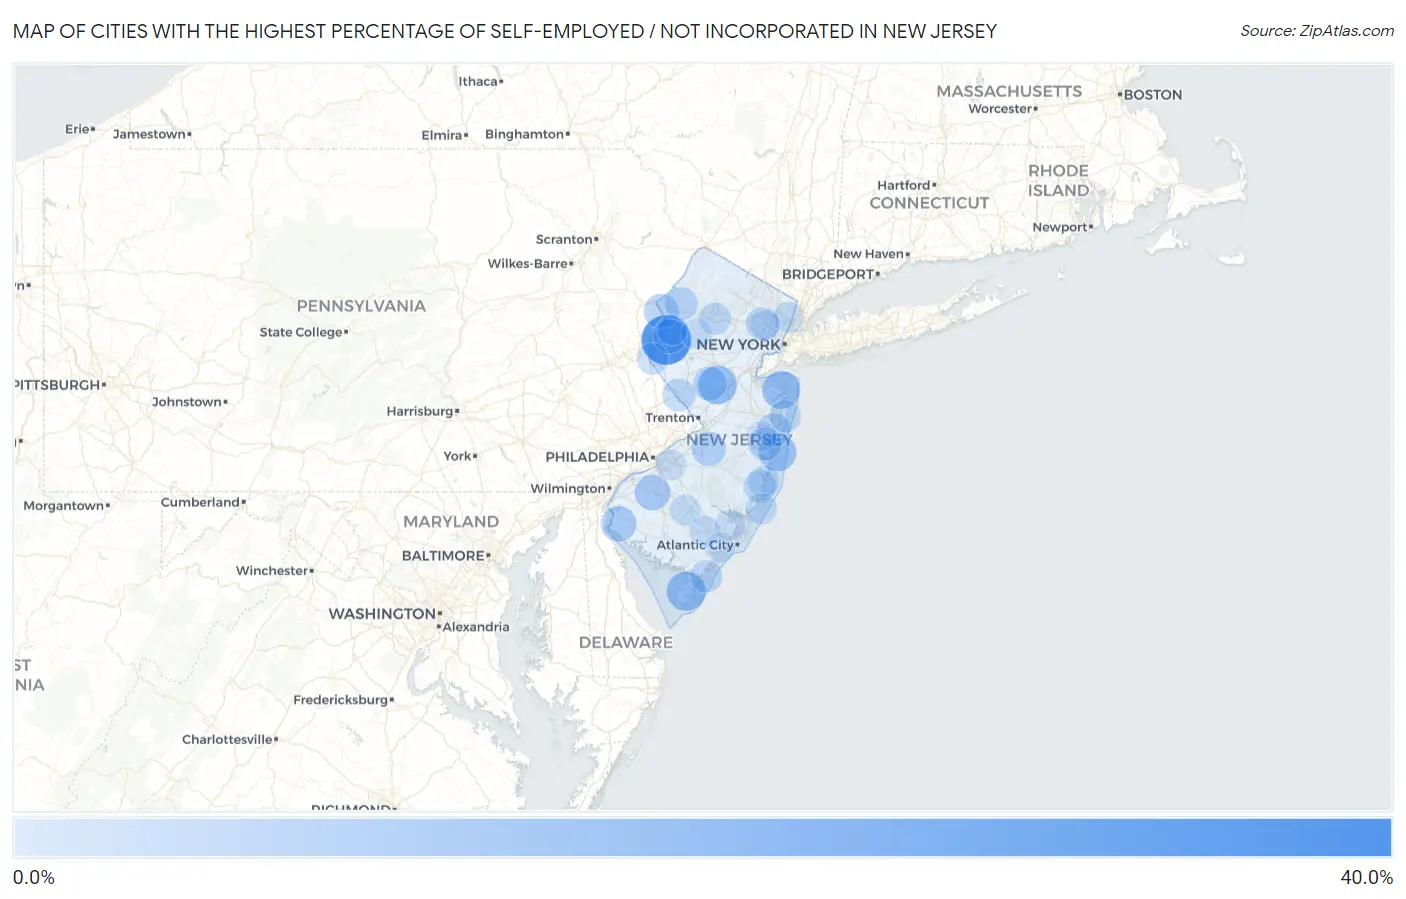
Map of Cities with the Highest Percentage of Self-Employed / Not Incorporated in New Jersey
0.0%
40.0%
Cities with the Highest Percentage of Self-Employed / Not Incorporated in New Jersey
| City | % Self-Employed / Not Incorporated | vs State | vs National | |
| 1. | Encore At Monroe | 32.6% | 4.7%(+27.9)#1 | 5.8%(+26.7)#560 |
| 2. | Broadway | 31.8% | 4.7%(+27.1)#2 | 5.8%(+26.0)#578 |
| 3. | Beesleys Point | 31.2% | 4.7%(+26.5)#3 | 5.8%(+25.4)#596 |
| 4. | Harrisonville | 30.3% | 4.7%(+25.6)#4 | 5.8%(+24.5)#637 |
| 5. | Oldwick | 29.7% | 4.7%(+25.0)#5 | 5.8%(+23.9)#662 |
| 6. | Green | 27.6% | 4.7%(+22.9)#6 | 5.8%(+21.8)#770 |
| 7. | West Cape May Borough | 25.7% | 4.7%(+21.0)#7 | 5.8%(+19.8)#902 |
| 8. | Pottersville | 24.0% | 4.7%(+19.4)#8 | 5.8%(+18.2)#1,035 |
| 9. | Titusville | 22.8% | 4.7%(+18.2)#9 | 5.8%(+17.0)#1,146 |
| 10. | Cedar Knolls | 21.2% | 4.7%(+16.5)#10 | 5.8%(+15.4)#1,339 |
| 11. | New Gretna | 20.4% | 4.7%(+15.7)#11 | 5.8%(+14.6)#1,452 |
| 12. | Cape May Point Borough | 19.6% | 4.7%(+14.9)#12 | 5.8%(+13.7)#1,580 |
| 13. | Whitesboro | 18.9% | 4.7%(+14.2)#13 | 5.8%(+13.1)#1,686 |
| 14. | Silver Lake Cdp Warren County | 18.6% | 4.7%(+13.9)#14 | 5.8%(+12.8)#1,737 |
| 15. | Germania | 18.5% | 4.7%(+13.9)#15 | 5.8%(+12.7)#1,752 |
| 16. | Griggstown | 18.3% | 4.7%(+13.6)#16 | 5.8%(+12.5)#1,802 |
| 17. | Navesink | 17.5% | 4.7%(+12.8)#17 | 5.8%(+11.6)#1,968 |
| 18. | Dover Beaches North | 17.2% | 4.7%(+12.5)#18 | 5.8%(+11.4)#2,028 |
| 19. | Renaissance At Monroe | 16.4% | 4.7%(+11.7)#19 | 5.8%(+10.6)#2,220 |
| 20. | Deal Borough | 16.2% | 4.7%(+11.5)#20 | 5.8%(+10.4)#2,287 |
| 21. | Fortescue | 16.1% | 4.7%(+11.4)#21 | 5.8%(+10.3)#2,302 |
| 22. | Rockleigh Borough | 16.1% | 4.7%(+11.4)#22 | 5.8%(+10.3)#2,306 |
| 23. | Far Hills Borough | 15.6% | 4.7%(+10.9)#23 | 5.8%(+9.76)#2,451 |
| 24. | Goshen | 15.5% | 4.7%(+10.8)#24 | 5.8%(+9.69)#2,471 |
| 25. | Spring Lake Borough | 15.2% | 4.7%(+10.5)#25 | 5.8%(+9.36)#2,582 |
| 26. | Regency At Monroe | 14.8% | 4.7%(+10.1)#26 | 5.8%(+8.94)#2,724 |
| 27. | Richwood | 14.6% | 4.7%(+9.94)#27 | 5.8%(+8.81)#2,765 |
| 28. | Hancocks Bridge | 14.4% | 4.7%(+9.72)#28 | 5.8%(+8.59)#2,828 |
| 29. | Columbia | 13.5% | 4.7%(+8.79)#29 | 5.8%(+7.67)#3,234 |
| 30. | Hampton Borough | 13.5% | 4.7%(+8.78)#30 | 5.8%(+7.65)#3,240 |
| 31. | Millstone Borough | 13.1% | 4.7%(+8.38)#31 | 5.8%(+7.25)#3,422 |
| 32. | Brass Castle | 13.0% | 4.7%(+8.35)#32 | 5.8%(+7.23)#3,425 |
| 33. | Juliustown | 12.9% | 4.7%(+8.21)#33 | 5.8%(+7.09)#3,505 |
| 34. | Interlaken Borough | 12.9% | 4.7%(+8.18)#34 | 5.8%(+7.06)#3,513 |
| 35. | Silver Lake | 12.9% | 4.7%(+8.18)#35 | 5.8%(+7.06)#3,517 |
| 36. | North Caldwell Borough | 12.8% | 4.7%(+8.06)#36 | 5.8%(+6.93)#3,574 |
| 37. | Beach Haven Borough | 12.6% | 4.7%(+7.94)#37 | 5.8%(+6.82)#3,631 |
| 38. | Harlingen | 12.6% | 4.7%(+7.94)#38 | 5.8%(+6.82)#3,634 |
| 39. | Barnegat Light Borough | 12.6% | 4.7%(+7.92)#39 | 5.8%(+6.80)#3,643 |
| 40. | Monmouth Beach Borough | 12.6% | 4.7%(+7.87)#40 | 5.8%(+6.74)#3,667 |
| 41. | Mantoloking Borough | 12.3% | 4.7%(+7.62)#41 | 5.8%(+6.49)#3,831 |
| 42. | Allenwood | 12.2% | 4.7%(+7.49)#42 | 5.8%(+6.36)#3,915 |
| 43. | Allenhurst Borough | 12.0% | 4.7%(+7.31)#43 | 5.8%(+6.18)#4,019 |
| 44. | Malaga | 11.9% | 4.7%(+7.25)#44 | 5.8%(+6.12)#4,056 |
| 45. | Seaside Park Borough | 11.9% | 4.7%(+7.18)#45 | 5.8%(+6.05)#4,093 |
| 46. | Leisure Village | 11.9% | 4.7%(+7.18)#46 | 5.8%(+6.05)#4,095 |
| 47. | Keasbey | 11.8% | 4.7%(+7.12)#47 | 5.8%(+5.99)#4,134 |
| 48. | Marksboro | 11.8% | 4.7%(+7.07)#48 | 5.8%(+5.95)#4,167 |
| 49. | Andover Borough | 11.7% | 4.7%(+7.01)#49 | 5.8%(+5.88)#4,206 |
| 50. | Upper Saddle River Borough | 11.6% | 4.7%(+6.93)#50 | 5.8%(+5.81)#4,254 |
| 51. | Upper Montclair | 11.6% | 4.7%(+6.89)#51 | 5.8%(+5.77)#4,277 |
| 52. | Lambertville | 11.4% | 4.7%(+6.71)#52 | 5.8%(+5.58)#4,406 |
| 53. | Stockton Borough | 11.3% | 4.7%(+6.63)#53 | 5.8%(+5.51)#4,459 |
| 54. | Barnegat | 11.2% | 4.7%(+6.53)#54 | 5.8%(+5.40)#4,527 |
| 55. | Haworth Borough | 11.1% | 4.7%(+6.46)#55 | 5.8%(+5.33)#4,561 |
| 56. | Sea Isle City | 10.8% | 4.7%(+6.14)#56 | 5.8%(+5.02)#4,817 |
| 57. | Franklin Lakes Borough | 10.8% | 4.7%(+6.14)#57 | 5.8%(+5.01)#4,821 |
| 58. | Peapack And Gladstone Borough | 10.8% | 4.7%(+6.13)#58 | 5.8%(+5.01)#4,826 |
| 59. | Mount Ephraim Borough | 10.7% | 4.7%(+5.99)#59 | 5.8%(+4.87)#4,943 |
| 60. | Lower Berkshire Valley | 10.7% | 4.7%(+5.96)#60 | 5.8%(+4.84)#4,966 |
| 61. | Kenvil | 10.6% | 4.7%(+5.88)#61 | 5.8%(+4.76)#5,022 |
| 62. | Loch Arbour | 10.5% | 4.7%(+5.84)#62 | 5.8%(+4.71)#5,069 |
| 63. | Brookside | 10.5% | 4.7%(+5.79)#63 | 5.8%(+4.66)#5,111 |
| 64. | Saddle River Borough | 10.4% | 4.7%(+5.76)#64 | 5.8%(+4.63)#5,136 |
| 65. | Finesville | 10.1% | 4.7%(+5.38)#65 | 5.8%(+4.26)#5,460 |
| 66. | Lebanon Borough | 10.0% | 4.7%(+5.36)#66 | 5.8%(+4.23)#5,481 |
| 67. | Westville Borough | 10.0% | 4.7%(+5.31)#67 | 5.8%(+4.18)#5,505 |
| 68. | Englewood | 10.0% | 4.7%(+5.29)#68 | 5.8%(+4.16)#5,573 |
| 69. | Liberty Corner | 9.9% | 4.7%(+5.17)#69 | 5.8%(+4.05)#5,689 |
| 70. | Waretown | 9.8% | 4.7%(+5.12)#70 | 5.8%(+4.00)#5,734 |
| 71. | North Beach Haven | 9.7% | 4.7%(+4.98)#71 | 5.8%(+3.85)#5,917 |
| 72. | Woodcliff Lake Borough | 9.5% | 4.7%(+4.84)#72 | 5.8%(+3.72)#6,046 |
| 73. | Surf City Borough | 9.5% | 4.7%(+4.82)#73 | 5.8%(+3.70)#6,080 |
| 74. | Harvey Cedars Borough | 9.5% | 4.7%(+4.78)#74 | 5.8%(+3.66)#6,112 |
| 75. | Ship Bottom Borough | 9.5% | 4.7%(+4.78)#75 | 5.8%(+3.65)#6,123 |
| 76. | Collings Lakes | 9.2% | 4.7%(+4.56)#76 | 5.8%(+3.43)#6,335 |
| 77. | Cookstown | 9.2% | 4.7%(+4.56)#77 | 5.8%(+3.43)#6,336 |
| 78. | Audubon Borough | 9.2% | 4.7%(+4.55)#78 | 5.8%(+3.43)#6,342 |
| 79. | Long Valley | 9.1% | 4.7%(+4.41)#79 | 5.8%(+3.28)#6,487 |
| 80. | Mays Landing | 9.1% | 4.7%(+4.37)#80 | 5.8%(+3.25)#6,550 |
| 81. | Rocky Hill Borough | 9.0% | 4.7%(+4.35)#81 | 5.8%(+3.23)#6,579 |
| 82. | Mickleton | 9.0% | 4.7%(+4.35)#82 | 5.8%(+3.23)#6,584 |
| 83. | West Wildwood Borough | 9.0% | 4.7%(+4.34)#83 | 5.8%(+3.22)#6,597 |
| 84. | Marshallville | 9.0% | 4.7%(+4.33)#84 | 5.8%(+3.21)#6,608 |
| 85. | Old Tappan Borough | 9.0% | 4.7%(+4.29)#85 | 5.8%(+3.16)#6,645 |
| 86. | Westwood Borough | 8.8% | 4.7%(+4.13)#86 | 5.8%(+3.00)#6,827 |
| 87. | Barclay | 8.8% | 4.7%(+4.09)#87 | 5.8%(+2.96)#6,866 |
| 88. | Arrowhead Lake | 8.8% | 4.7%(+4.08)#88 | 5.8%(+2.96)#6,883 |
| 89. | Oxford | 8.7% | 4.7%(+4.03)#89 | 5.8%(+2.90)#6,950 |
| 90. | Smithville | 8.7% | 4.7%(+4.03)#90 | 5.8%(+2.90)#6,952 |
| 91. | Fieldsboro Borough | 8.7% | 4.7%(+4.01)#91 | 5.8%(+2.88)#6,978 |
| 92. | Little Silver Borough | 8.7% | 4.7%(+4.00)#92 | 5.8%(+2.87)#7,001 |
| 93. | Sea Girt Borough | 8.4% | 4.7%(+3.72)#93 | 5.8%(+2.60)#7,365 |
| 94. | Shrewsbury Borough | 8.4% | 4.7%(+3.70)#94 | 5.8%(+2.58)#7,394 |
| 95. | Roseland Borough | 8.4% | 4.7%(+3.70)#95 | 5.8%(+2.58)#7,399 |
| 96. | Linwood | 8.3% | 4.7%(+3.59)#96 | 5.8%(+2.47)#7,583 |
| 97. | Morris Plains Borough | 8.3% | 4.7%(+3.59)#97 | 5.8%(+2.46)#7,589 |
| 98. | Englewood Cliffs Borough | 8.3% | 4.7%(+3.59)#98 | 5.8%(+2.46)#7,592 |
| 99. | Lakewood | 8.3% | 4.7%(+3.57)#99 | 5.8%(+2.44)#7,607 |
| 100. | Brookdale | 8.2% | 4.7%(+3.53)#100 | 5.8%(+2.40)#7,665 |
Common Questions
What are the Top 10 Cities with the Highest Percentage of Self-Employed / Not Incorporated in New Jersey?
Top 10 Cities with the Highest Percentage of Self-Employed / Not Incorporated in New Jersey are:
#1
31.8%
#2
18.9%
#3
18.3%
#4
17.5%
#5
17.2%
#6
14.6%
#7
14.4%
#8
13.5%
#9
13.0%
#10
12.9%
What city has the Highest Percentage of Self-Employed / Not Incorporated in New Jersey?
Broadway has the Highest Percentage of Self-Employed / Not Incorporated in New Jersey with 31.8%.
What is the Percentage of Self-Employed / Not Incorporated in the State of New Jersey?
Percentage of Self-Employed / Not Incorporated in New Jersey is 4.7%.
What is the Percentage of Self-Employed / Not Incorporated in the United States?
Percentage of Self-Employed / Not Incorporated in the United States is 5.8%.